_____________________________________________________________________________________________________
13(9): 1-8, 2016, Article no.BJMMR.22982
ISSN: 2231-0614, NLM ID: 101570965
SCIENCEDOMAIN international
www.sciencedomain.org
Dietary Intake Adequacy and Evaluation of
Nutritional Value in Diabetic Patients
Behrooz Ebrahimzadeh Koor
1, Mahmoud R. Nakhaie
2*, Saied Babaie
3and Mehdi Ranjbaran
41
Department of Nutrition, Faculty of Health, Yasouj University of Medical Sciences, Yasouj, Iran.
2
Department of Nutrition, School of Health, Arak University of Medical Sciences, Arak, Iran.
3
Departmentof Anatomy, Arak University of Medical Sciences, Arak, Iran.
4
Department of Epidemiology, Arak Faculty of Health Sciences, Arak, Iran.
Authors’ contributions
This work was carried out in collaboration between all authors. Authors BEK and MRN designed the study, wrote the protocol and supervised the work. Author SB managed the literature searches. Authors MRN and BEK carried out all laboratory work, analysis of data managed by authors BEK and MR. All authors read and approved the final manuscript.
Article Information
DOI: 10.9734/BJMMR/2016/22982
Editor(s):
(1) Alex Xiucheng Fan, Department of Biochemistry and Molecular Biology, University of Florida, USA.
Reviewers:
(1) Barugahara Evyline Isingoma, Kyambogo University, Uganda. (2)Jorge Isaac Castro Bedrinana, National University of Central Peru, Peru. Complete Peer review History:http://sciencedomain.org/review-history/13233
Received 8th November 2015 Accepted 8th January 2016 Published 9th February 2016
ABSTRACT
Aims: Diabetes as a health problem, leads to many pathological effects. Many studies showed that micronutrients found in these patients are not in accordance with the recommendations of RDA*. The aim of this study was to assess the adequacy of nutrient intake in diabetic patients attending diabetes clinics in Markazi Province of Iran, there by basic information on the nutritional status of this group of patients was obtained and early survey started.
Study Design: Cross - sectional study.
Place and Duration of Study: Clinical Research Unit,Markazi Province, Arak, Iran, between April 2012 and July 2013.
Methodology: In a random sample procedure 250 diabetic patients referring to diabetic clinics in Markazi Province was assessed. A questionnaire was completed for each patient. This form
included some demographic data and laboratory food frequency questionnaire (FFQ -168) and a 24-hour dietary recall. After completing the questionnaire the amount of energy and nutrients in each food and beverage ingredients were calculated by using food composition table USDA designed in a food processing software. The standard amounts of Recommended Daily Allowances (RDA 1989) were used to evaluate the adequacy of the diet. Data was analyzed using Pearson correlation coefficient, chi-square and Independent Samples T-test, Paired Samples T-test the SPSS16 statistical software were used.
Results: In this study, about 32% of patients had normal weight and 68% of them were overweight or obese. The mean of fasting blood glucose was 212.5 mg /dl. Percentage of energy derived from carbohydrate, protein and fat, was 58.8 and 13.6 and 27.6% respectively. Percentage of energy from saturated fat was around 17%. Among male patients, energy intake, fiber, unsaturated saturated fat energy percentage, calcium, phosphorus, iron, potassium, zinc, vitamin A, selenium, vitamin K, vitamin C and vitamin E intake values are significantly different from RDA values, the amounts of iron, percent of energy from saturated fatty acids, and vitamin E intakes were significantly higher than RDA values and other nutrient intakes were lesser than the RDA. Among female patients, fiber intake, percentage of energy from unsaturated and saturated fat, calcium, phosphorus, potassium, zinc, vitamin B1, folic acid and vitamin E values are significantly different from RDA values, among of these amounts, energy from saturated fat, zinc, vitamin B1 and vitamin E were significantly higher than RDA values and other nutrient intakes were lesser than the RDA.
Conclusion: Our findings indicate that the nutritional adequacy of food intake in diabetic patients, is not desirable. The amount of energy from carbohydrate was higher than RDA recommendations. Percent of energy from saturated fatty acids was higher than standard. Percent of energy from saturated fatty acids was higher than standard. Despite the apparent over-weight and obesity of patients, there was nutrient deficiency in them. In overall, in this area choice of balance diet and training are necessary.
Keywords: Diabetes mellitus; macronutrient; micronutrient.
ABBREVIATIONS
RDA: Recommended Dietary Allowances; FFQ: Food Frequency Questionnaire; USDA: United States Department of Agriculture; ADA: American Diabetes Association; T2DM: Type 2 Diabetes Mellitus; USFAs: Un Saturated Fatty Acids; MUFAs: Mono Un Saturated Fatty Acids; PUFA: Poly Un Saturated Fatty Acids; ULSAM: The Uppsala Longitudinal Study of Adult Men;SFAs: Saturated Fatty Acids; EPIC-InterAct Study: European Prospective Investigation into Cancer and Nutrition; CVD: Cardio Vascular Disease; PMBG: Postmeal Blood Glucose; ARIC: Atherosclerosis Risk in Communities.
1. INTRODUCTION
Medical nutrition therapy is an integral part of diabetes management [1], especially the management of metabolic control for achieving optimal weight [2,3]. Dietary pattern has synergistic effects of whole foods and may prove more beneficial in terms of assessing the quality of dietary intake [4]. Dietary intake has essential role in ethiology and management of type 2 diabetes mellitus [1]. Dietary intake with high energy especially with fat and simple sugars and low fiber diet has been shown to increase of T2DM [5]. The newest lists focus on control of daily energy intake [6]. Several studies have examined the effects of dietary carbohydrate , fat and proteins on postprandial glucose [7-11]. The
2. MATERIALS AND METHODS
2.1 Study Design
Diabetic men and women from Diabetic – Centre in hospitals of Markazi province were offered an opportunity to participate in this study.
2.2 Study Subjects
These adult(n=250) diabetic patients(men and women) between 45-79 years in age, that referred to Diabetic –centre selected in five city of Markazi-province.
2.3 Demographic, Anthropometric and Laboratory Measures
Standard demographic information and anthropometric measurements including weight and height for the calculation of body mass index(BMI), were recorded. A fasting blood sugar were analyzed. A questionnaire was completed for each patient. This form included some
demographic data and laboratory food frequency questionnaire (FFQ -168) and a 24-hour dietary
recall. After completing the questionnaire, the amount of energy and nutrients in each food
and beverage ingredients were calculated by using food composition table USDA Designed in a food processing software. The standard amounts of Recommended Daily Allowances (RDA 1989) were used to evaluate the adequacy of the diet. Also we record systolic and diastolic
blood pressure (mmHg). Injected insulin dose, Metformin and Glibenclamide were
determined.
2.4 Statistical Analyses
Data was analyzed using Pearson correlation coefficient, chi-square and Independent Samples T-testt,Paired Samples T-test with SPSS16 statistical software. Values are demonstrated as mean±SD. Differences with*p<0.05 were regarded as statistically significant.
3. RESULTS
3.1 Demographic, Anthropometric and Laboratory Measures
The study represented that thirty-two percent of ** patients with normal weight, and sixty-eight percent had over – weight or obese. Table 1 shows anthropometric measurement of patients.
Food groups intake in patients Food groups intake in men and women showed in Table 2. There was no significant difference between two groups, but men received more food groups than women.
If we accepted adequate food groups for meat will be equal 2.5 serving, milk and dairy products, 2.5 serving, fruits and vegetables 2 and 3 serving, and cereals, breads is be equal 9 serving, in the basis of this classification food group distribution in their diets, determined in Table 3.
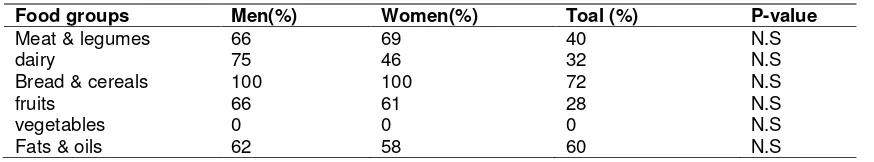
According to Table 3 the most problem for food groups intake was observed in vegetable groups. The second problem was in milk and dairy groups. Only 32% of patients received adequate
Table 1. Anthropometric characteristics of patients
Variable Men(Mean±SD) Women(Mean±SD) Toal Mean±SD P-value
Age (year) 62.5±17.14 59.23±7.6 62.5±17.14 N.S
Weight (kg) 79.16±17.12 68.12±6.5 73.4±13.7 P=0.019
Height (Cm) 167.6±8.3 157.2±6.8 162.2±9.11 N.S
BMI (Kg/m2) 28±4.5 27.7±3.7 27.9±4.02 N.S
Table 2. Food groups intake in men and women
Food groups Men(Mean±SD) Women(Mean±SD) Toal Mean±SD P-value
Meat & legumes 2.4 ±1.5 2±1.1 2.2±0.3 N.S
dairy 2.2±0.8 1.9±1.1 2.1±0.6 N.S
Bread & cereals 9.4±1.4 9±0.9 9.2±1.4 N.S
fruits 1.8±0.9 2±1.4 1.9±1.2 N.S
vegetables 1.2±0.6 0.7±0.9 0.95±0. 6 N.S
serving for this mentioned groups. Macro and micro – nutrients intake of their diets shown in Tables 4,5,6.
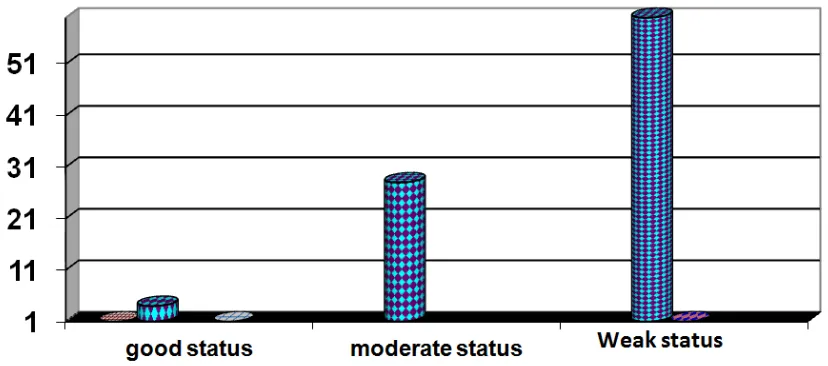
On the basis of MAR(Mean Adequacy Ratio) as an index of nutritional status, and adequacy of nutrients (Nutrient Adequacy Ratio=NAR). Which
estimated that the ratio of any nutrient intake divided by the amount of recommended allowances of the same nutrient. Nutritional status of patients divided into three groups (adequate. Moderate and weak). Fig. 1 shows the percentage of different nutritional status in patients.
Table 3. Distribution of food groups in patients
Food groups Men(%) Women(%) Toal (%) P-value
Meat & legumes 66 69 40 N.S
dairy 75 46 32 N.S
Bread & cereals 100 100 72 N.S
fruits 66 61 28 N.S
vegetables 0 0 0 N.S
Fats & oils 62 58 60 N.S
Table 4. Analysis of macronutrients in patients
Variable Men RDAm Women RDAf P-value
Energy(Kc/d) 1934.5 2300 1855.7 1900 N.S
% energy from CHO 58.2 55 59.3 55 N.S
% energy from fats 27.7 30 27.6 30 N.S
% energy from proteins 14.2 15 13.2 15 N.S
% energy from SFA s 17.5* ≤10 15.9* ≤10 N.S
% energy from USFA s 10.1* >15 11.7* >15 N.S
Cholesterol(mg/d) 239.1 ≤300 139.7* ≤300 P=0.003
Fiber(gr/d) 19.4* 30 20.4* 28 N.S
Table 5. Minerals intake in patients
Variable Men RDAm Women RDAf P-value
Ca (mg/d) 813.3* 1200 801.4* 1200 N.S
P (mg/d) 864.9* 700 853.7* 700 N.S
Fe(mg/d) 11.9* 10 10.8 10 N.S
K(mg/d) 1322.5* 1900 1405.5* 1900 N.S
Na(mg/d) 2532 2400 2755.7 2400 N.S
Zn(mg/d) 8.5* 15 20.4* 15 N.S
Se(µg/d) 49.6* 70 50 55 N.S
Table 6. Vitamins intake in patients
Variable Men RDAm Women RDAf P-value
V.A(µg/d) 704* 1000 593 800 N.S
V.D(µg/d) 11.07 10 10.1 10 N.S
V.E(mg/d) 12.1* 10 11.2* 8 N.S
V.K(µg/d) 61.2* 80 55.9 65 N.S
V.B1(mg/d) 1.27 1.2 1.42* 1.1 N.S
V.B2(mg/d) 1.5 1.3 1.5 1.1 N.S
V.B3( mg/d) 14.9 16 18.6 14 N.S
V.B9(folic Acid)( µg/d) 185.9* 400 222.8* 400 N.S
V.C(mg/d) 64.7* 90 74.8 75 N.S
Fig. 1. The percent of nutritional status in patients
4. DISCUSSION
This study showed that overall quality of dietary intake consumed by patients with T2DM was less than that of healthy populations like Mediterranean regions. In this cross sectional study a cause and effect relationship between dietary quality and incidence of T2DM cannot be determined. Individuals with T2DM. When micronutrients intake was assessed using adequacy score, results showed that micronutrient adequacy was suboptimal in both groups (men & women). When the intake of sixteen micronutrients was assessed, the patients with T2DM consumed significantly less calcium, potassium, zinc, selenium, vitamin A, vitamin K, folic acid and vitamin C.
A study based on the ARIC cohort in relationship between dietary potassium, as measured by food frequency questionnaire, and diabetes risk, with average dietary potassium intake levels of less than 2700 mg/d, found no significant association. [14]. In our study potassium intake was 1322 and 1405 mg/d in men and women respectively. That was less than, in comparison with RDA. Systematic review and meta-analysis in patients with diabetes demonstrates that Zinc supplementation has beneficial effects on glycaemic control and promotes healthy lipid parameters [15]. Vitamin A, C and E are antioxidants, They worked along with other minerals, like selenium and other compounds. Antioxidants are not usually implicated in the aetiology of type 2 diabetes directly, but may help to prevent effect of vitamins C, E and A can reduce this damage [16]. Studies have
suggested that vitamin K may improve glycemic status and insulin sensitivity. In healthy young male volunteers, showed that men with lower phylloquinone intakes had lower insulin and higher glucose concentrations after oral glucose loading than did men with higher phylloquinone intakes [17]. Oral supplementation of vitamin C with metformin, reduced FBS, PMBG, and improved HbA1c [18].
Researchers, looked at plasma vitamin C and consumption of fruit and vegetable in relationship with the prevention of type 2 diabetes. They showed that higher plasma vitamin C levels and, to a lesser degree, fruit and vegetable intake were associated with a substantially decreased risk of developing diabetes. Their findings showed an important public health message for the benefits of a diet rich in fruit and vegetables in diabetes prevention [19].
positively related with diabetes incidence ([21]. The investigation of Jiang R, et al. [22] on food groups (Nuts), as an important source of MUFAs and s) showed the Nuts have been associated with lower risk of diabetes in women even after adjusting for fiber intake. In the Iowa Women`s Health Study, incidence of T2DM was independently and inversely associated with vegetable fat (low in SFAs) intake reported by FFQ [23]. There was also an inverse relation between incidence of diabetes and substitution of PUFA for SFA. The incidence of type 2 diabetes observed in The EPIC-Inter-Act Study in population with a high intake of total fiber compared with a low intake was associated with an 18% lower risk, when adjusted for lifestyle and dietary factors. This finding was mainly driven by the intake of cereal fiber and vegetable fiber, intake of fruit fiber did not have any effect on lowering incidence of T2DM. A stronger inverse association observed between cereal fiber intake and type 2 diabetes than for fruit or vegetable fiber is consistent with previous meta-analyses of fiber intake and type 2 diabetes [24], [25], recently meta analyses research that has shown stronger associations for whole grain intake [26] than for fruit and vegetable intake in relation to risk of type 2 diabetes [27]. The American Diabetes Association recommends fiber consumption of at least 14 g/1,000 kcal/d or a range of 25 to 30 g/d, the values recommended by the United States Department of Agriculture [3]. Where as the American Dietetic Association’s position statement recommends 30 to 50 g of dietary fiber per day for patients with type 2 diabetes mellitus [28]. Our study showed that a significantly difference between RDA fiber intake between men (30 gr/day) and women (28 gr/day) compare with dietary intake .In addition, there is a limited research regarding optimal dietary cholesterol and trans fat intake in people with diabetes. One large prospective cohort study [29] in women with type 2 diabetes found a 37% increase in CVD risk for every 200 mg cholesterol/1,000 kcal. Due to the lack of research in this area, people with diabetes should follow the guidelines for the general population. The Dietary Guidelines for Americans, 2010 [30]. The cholesterol intake of our study in men and women was 239 gr/day 139.7 gr/day respectively. That was adequate or (less than 300 mg/day). Intake of cholesterol in women was less than men (P≤0.003). It seems a relationship between low intake of saturated fatty acids (SFAs) and low cholesterol intake, because the source of dietary cholesterol and SFAs is similar.
5. CONCLUSION
Our findings showed that the nutritional quality for dietary intake of diabetic patients was not Suitable. Distribution of energy from carbohydrates and SFAs is greater than RDA, In spite of over – weight and obesity among patients, the intake of several micronutrients in diets was inadequate. The patients must be intake a healthy food pyramid and diabetic – center must be educate all of the patients that referred to these clinical – center.
CONSENT
It is not applicable.
ETHICAL APPROVAL
All authors hereby that all human studies have been examined and approved by the appropriate ethics committee with code 91-139-9 by the Ministry of Health & Educational Medicine, Arak Medical University.
COMPETING INTERESTS
Authors have declared that no competing interests exist.
REFERENCES
1. Alssema M, Schindhelm RK, Dekker JM, Diamant M, Nijpels G, Teerlink T, et al. Determinants of postprandial triglyceride and glucose responses after two consecutive fat-rich or carbohydrate-rich meals in normoglycemic women and in women with type 2 diabetes mellitus: The Hoorn prandial Study. Metabolism. 2008; 57:1262–1269.
2. Alssema M, Schindhelm RK, Rijkelijkhuizen JM, Kostense PJ, Teerlink T, Nijpels G, et al. Meal composition affects insulin secretion in women with type 2 diabetes: A comparison with healthy controls. The Hoorn prandial study. Eur J Clin Nutr. 2009;63:398–404.
3. American Diabetes Association. Standards of medical care in diabetes 2013. Diabetes Care. 2013;36(Suppl. 1):S11–S66.
American Diabetes Association. Diabetes Care. 2008;31(Suppl 1):S61–78.
5. American Dietetic Association. Position of the American Dietetic Association: Health implications of dietary fiber. J Am Diet Assoc. 2008;108:1716–31,2924-171. Tanasescu M, Cho E, Manson JE, Hu FB. Dietary fat and cholesterol and the risk of cardiovascular disease among women with type 2 diabetes. Am J Clin Nutr. 2004;79:999–1005.
6. Aune D, Norat T, Romundstad P, Vatten LJ. Whole grain and refined grain consumption and the risk of type 2 diabetes: a systematic review and dose– response meta-analysis of cohort studies. Eur J Epidemiol. 2013;28:845–858. 7. Cooper AJ, Forouhi NG, Ye Z, et al. Fruit
and vegetable intake and type 2 diabetes: EPIC-InterAct prospective study and meta-analysis. Eur J Clin Nutr. 2012;66:1082– 1092.
8. De Natale C, Annuzzi G, Bozzetto L, Mazzarella R, Costabile G, Ciano O, et al. Effects of a plant-based high-carbohydrate/high-fiber diet versus highmonounsaturated fat/low-carbohydrate diet on postprandial lipids in type 2 diabetic patients. Diabetes Care. 2009;32:2168– 2173.
9. Franz MJ, Boucher JL, Green-Pastors J, Powers MA. Evidence-based nutrition practice guidelines for diabetes and scope and standards of practice. J. Am. Diet. Assoc. 2008;108:S52–S58.
10. Franz MJ, Powers MA, Leontos C, Holzmeister LA, Kulkarni K, Monk A, Wedel N, Gradwell, E. The evidence for medical nutrition therapy for type 1 and type 2 diabetes in adults. 2010;110(12): 1852-89
11. Fung TT, Schulze M, Manson JE, Willett WC, Hu FB. Dietary patterns, meat intake, and the risk of type 2 diabetes in women. Arch. Intern. Med. 2004;164:2235–2240. 12. Hodge AM, English DR, O'Dea K, Sinclair
AJ, Makrides M, Gibson RA, Giles GG. Plasma phospholipid and dietary fatty acids as predictors of type 2 diabetes: Interpreting the role of linoleic acid. Am J Clin Nutr. 2007;86:189–197.
13. Inzucchi SE, Bergenstal RM, Buse JB, et al. American Diabetes Association (ADA); European Association for the Study of Diabetes (EASD). Management of hyperglycemia in type 2 diabetes: A
patient-centered approach: position statement of the American Diabetes Association (ADA) and the European Association for the Study of Diabetes (EASD). Diabetes Care. 2012;35:1364– 1379.
14. Chatterjee R, Yeh HC, Shafi T, et al. Serum and dietary potassium and risk of incident Type 2 diabetes mellitus: The Atherosclerosis Risk in Communities (ARIC) study. Arch Intern Med. 2010;170: 1745–1751.
15. Ayawardena R, Ranasinghe P, Galappatthy P, Malkanthi RLDK, Constantine GR, Katulanda P. Effects of zinc supplementation on diabetes mellitus: A systematic review and meta-analysis. Diabetol Metab Syndr. 2012;4:13.
16. Carol M. Treatment of type 2 diabetes and its complications. Journal of Diabetes Nursing. 2013;17:376–83.
17. Sakamoto N, Nishiike T, Iguchi H, Sakamoto K. Possible effects of one week vitamin K (menaquinone-4) tablets intake on glucose tolerance in healthy young male volunteers with different descarboxy prothrombin levels. Clin Nutr. 2000;19: 259–63.
18. Ganesh N Dakhale, Harshal V Chaudhari, Meena Shrivastava2 Ganesh N Dakhale, Harshal V Chaudhari, Meena Shrivastava. Supplementation of vitamin C reduces blood glucose and improves glycosylated hemoglobin in type 2 diabetes mellitus: A randomized, double-blind study. Advances in Pharmacological Sciences. 2011;1-5. 19. Harding AH, Wareham NJ, Bingham SA, et
al. Plasma vitamin C level, and the risk of new-on set type 2 diabetes mellitus: The European prospective investigation of cancer—Norfolk prospective study. Arch Intern Med. 2008;168:1493–9.
20. Jiang R, Manson JE, Stampfer MJ, Liu S, Willett WC, Hu FB. Nut and peanut butter consumption and risk of type 2 diabetes 2554–2560 in women. JAMA. 2002;288. 21. Lindstrom J, Eriksson JG, Valle TT, Aunola
S, Cepaitis Z, Hakumaki M, et al. Prevention of diabetes mellitus in subjects with impaired glucose tolerance in the finnish diabetes prevention study: Results from a randomized clinical trial. J Am Soc Nephrol. 2003;14(Suppl 2):108–113. 22. McNaughton SA, Ball K, Crawford D,
in an Australian population. J Nutr. 2008;138:86–93.
23. Meyer KA, Kushi LH, Jacobs DR Jr, Folsom AR. Dietary fat and incidence of type 2 diabetes in older Iowa women. Diabetes Care. 2001;24:1528–1535. 24. Pearce KL, Noakes M, Keogh J, Clifton
PM. Effect of carbohydrate distribution on postprandial glucose peaks with the use of continuous glucose monitoring in type 2 diabetes. Am J Clin. Nutr. 2008;87:638– 644.
25. Powers MA, Cuddihy RM, Wesley D, Morgan B. Continuous glucose monitoring reveals different glycemic responses of moderate- vs high carbohydrate lunch meals in people with type 2 diabetes. J Am Diet Assoc. 2010;110:1912–1915.
26. Risérus U, Arnlov J, Berglund L. Long-term predictors of insulin resistance: Role of lifestyle and metabolic factors in
middle-aged men. Diabetes Care. 2007;30:2928– 2933.
27. Schulze MB, Schulz M, Heidemann C, Schienkiewitz A, HoffmannK Boeing H. Fiber and magnesium intake and incidence of type 2 diabetes: A prospective study and meta-analysis. Arch Intern Med. 2007;167: 956–965
28. U.S. Department of Health and Human Services and U.S. Department of Agriculture. Dietary Guidelines for Americans; 2010. [Internet].
Available:www.health.gov/dietaryguideline s/
29. Yao B, Fang H, Xu W, et al. Dietary fiber intake and risk of type 2 diabetes: A dose– response analysis of prospective studies. Eur J Epidemiol. 2014;29:79–88.
30. Yamada S. Dietary therapy of type 2 diabetic mellitus (in Japanese). Naika. 2011;108:616–620.
_________________________________________________________________________________
© 2016 Koor et al.; This is an Open Access article distributed under the terms of the Creative Commons Attribution License
(http://creativecommons.org/licenses/by/4.0), which permits unrestricted use, distribution, and reproduction in any medium,
provided the original work is properly cited.
Peer-review history: