A mesoscopic model for compression of granular materials
Elisha Rejovitzky1,*
1 RAFAEL, P.O. Box 2250, Haifa, 3102102 Israel
Abstract. The design of protective structures often requires numerical modeling of shock-wave propagation in the surrounding soils. Properties of the soil such as grain-grading and water-fraction may vary spatially around a structure and among different sites. To better understand how these properties affect wave propagation we study how the meso-structure of soils affects their equation of state (EOS). In this work we present a meso-mechanical model for granular materials based on a simple representation of the grains as solid spheres. Grain-grading is prescribed, and a packing algorithm is used to obtain periodic grain morphologies of tightly packed randomly distributed spheres. The model is calibrated by using experimental data of sand compaction and sound-speed measurements from the literature. We study the effects of grain-grading and show that the pressures at low strains exhibit high sensitivity to the level of connectivity between grains. At high strains, the EOS of the bulk material of the grains dominates the behavior of the EOS of the granular material.
1 Introduction
The study of the mechanical behavior in granular materials has a large importance in various fields. Each field requires accurate modeling of different aspects of the complex mechanics. Issues in powder mechanics in silos and soil strength in civil engineering require the understanding of strength and stability of soils under low and intermediate pressures. The study of shock-wave propagation for the defense industry [1] requires models for the response of different soils under compression at a wide range of pressures. In the work presented here we focus on the volumetric response of granular materials to pressure, i.e., their EOS.
Experimental studies of the dynamic compression of soils are complex and limited. Dynamic measurements in the split Hopkinson bar test and measurements of spherical-shock propagation present one-dimensional cases of the strain state [2-3]. Thus, neither retrieve the material behavior under different spatial loading scenarios, nor enable the separation of material response into a deviatoric and a hydrostatic part. Static measurements of the mechanical response of soils are regularly performed in tri-axial cell devices. These experiments enable different spatial loads but not at the full range of pressures required for shock dynamics. In addition, there is an open discussion in the literature whether the material response of soils is rate-dependent [4-5]. For that reason, the applicability of static measurements for the modeling of dynamic phenomenon is controversial. Of special interest for our work is static tri-axial experiments done by Laine and Sandvik on sand from the shores of Sjöbo, Norway [6]. In their experiments the EOS was isolated by applying a hydrostatic load, and strains at pressures up to 100 MPa
were measured. The experimental results were later implemented in the commonly used hydrodynamic code AUTODYN [7]. We use these results to calibrate our model.
In this work we focus on capturing the full range of compaction including large deformations of the grains up to full closure of the pores in the material and subsequent compression of the bulk material (the material from which the grains are formed). The aim is to find the dependence of the EOS on different material parameters such as: grain-size distribution, porosity, and properties of the bulk material.
Preliminary work to ours was done by Larcher and Gebbeken to compute the full compaction range by a mesoscopic model [8]. Unfortunately, convergence of the model was not achieved, and no conclusions regarding the effect of the grain meso-structure or material properties on the EOS were derived.
2 The model
2.1 Morphology generation
A granular material is generally composed of grains of different shapes, sizes and composition. Under compression, the grains are packed and deform. For simplicity we degenerate the shape of the grains into solid spheres. To form the morphology, the spheres are packed by using a random sphere-packing algorithm [9-10]. The initial condition for the packing algorithm is a periodic ensemble of non-overlapping spheres created by a Matérn hard-core process (see Fig. 1). Then, each sphere is given a random initial velocity vector, and a constant growth-rate. On each computational step of the algorithm, the collision times between all spheres are calculated and the spheres are repositioned to their locations at the nearest collision time. The post-collision velocities are then computed and the computational step is repeated until the ensemble locks. The resulting morphology is then cut to obtain a cubic representative volume element (RVE) to be used in the FEM simulation (see Fig. 1).
Different sphere-size distributions may yield different porosities. The porosity for a random packing of equal diameter spheres is ϕ0 = 0.38, and interestingly corresponds to the porosity of SJOBO sand. In correspondence we chose an equal diameter sphere-morphology in our simulations.
Fig. 1. Right - the initial conditions for the packing algorithm; left: the periodic packed-sphere morphology.
2.2 Boundary conditions
The RVE is compressed via applying displacement boundary conditions on all its faces. Since the morphology is periodic, an exact boundary condition to use would be a periodic one. For simplicity we choose to use an approximate boundary condition of prescribed velocities on the faces:
v1|x1=0 = v2|x2=0 = v3|x3=0 = 0
v1|x1=l = v2|x2= l = v3|x3= l = v0 (1) where xi, vi, l, v0 are the components of the location,
components of velocity, RVE edge length, and boundary velocity respectively. The conditions are implemented using moving rigid walls which compress the RVE. The contact forces between the grains and the rigid walls are then measured and averaged by area to obtain the pressure.
Two main issues may arise from the choice of boundary conditions: (1) dynamic effects may occur due to the finite time is takes the elastic wave to propagate
throughout the RVE, and (2) the approximate boundary conditions may give rise to errors in the pressure. These issues are addressed in convergence tests in the results section.
2.3 Material model
We use Quartz as the bulk material from which the sand is composed. Since the elastic behavior of Quartz is almost isotropic, we assume isotropic linear elasticity with respect to the true-strain measure. The averaged bulk and shear moduli used in the simulation are G = 46.9 GPa, K = 37.7 GPa [11]. The bulk density is ρQuartz = 2650 kg/m3 and corresponds to initial sand density of
ρ0 = (1−ϕ0) ρQuartz = 1650 kg/m3 (2) The granular material undergoes irreversible deformation in the form of pore-closure. This irreversibility is caused by fracture and micro-plasticity in the grains. In order to obtain a first approximation of this irreversibility we use a simple continuum plasticity-model. Some energy is stored elastically and released upon unloading. A simple linear-hardening plasticity model is used
σ = σy + βεp (3)
where σ, σy, β, and εp are the stress, the yield stress, the hardening coefficient, and the plastic strain measure respectively.
2.4 Simulation parameters
Simulations are performed in the commercial explicit finite-element code LS-DYNA. The geometry is meshed with 4-node constant-strain tetrahedron elements, and the ratio of element-size to RVE length is taken as 1/40. Sensitivity of the results to the stiffness of the contact algorithm between the grains was tested and shown to be low.
3 Results
The former dominates at high porosities, and the latter at low porosities.
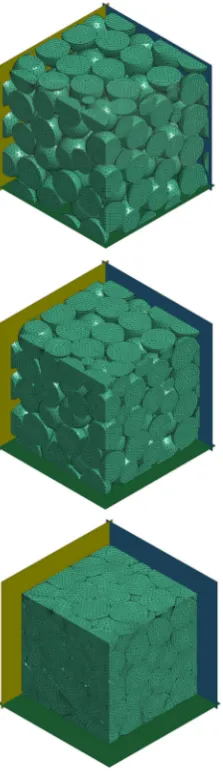
Fig. 2. RVE at different states during compression. Static rigid walls are represented in green, yellow, and blue. Densities (from top to bottom) are: ρ= 1650, 2200, 2820 kg/m3.
3.1 Convergence tests
Convergence tests were performed to verify the level of sensitivity of the simulation to the approximate boundary conditions and the dynamic wave-propagation in the RVE.
To examine the effects of the boundary conditions, two simulations describing the uni-axial compression of RVEs of a different size were performed. Morphologies from ensembles of 80 and 640 grains were studied with an arbitrary constant yield stress Quartz (σy = 200 MPa). As the effect of the approximate boundary condition increases with the surface-area to volume ratio, it is expected that any significant error originating from them will cause a deviation between the results of the two simulations. Fig. 3 presents the pressure vs. density curve of the simulations. It is clear that the sensitivity to the ensemble size is very low. Thus, an ensemble of 80 grains is sufficient. A small initial ramp in the pressure is visible in Fig. 3. This is a result of strength effects as the
loading is not hydrostatic. Strength effects will be studied in a future work.
Fig. 3. Pressure-density curve at uni-axial compression of different ensemble sizes.
Simulation results at different strain-rates are presented in Fig. 4. The smooth increase in pressure at the beginning of the loading shows that there is sufficient time for the elastic waves which form at the moving boundaries to reverberate and reach equilibrium in the grains. In addition, the curves at different rates coalesce. Hence, a strain-rate of 100 µs-1 is sufficiently converged, and is used in all other simulations presented here.
Fig. 4. Pressure-density curves at different strain-rates. The EOS of Quartz is represented by a Purple line.
3.2 Calibration of the grain material model and the Loading EOS
Fig. 5. Calibration of the EOS: pressure-density curves at different bulk-material parameters. In black marker – experimental measurements of SJOBO sand. The black dotted line represents the extrapolation used for the sand model in the AUTODYN hydrodynamic code.
Since calibration is performed on a single realization of the mesoscopic structure, it is important to validate that the variation of the calibrated EOS among different realizations is low. The sensitivity to the randomness of the grain morphology is examined on 9 realizations of grain ensembles containing 80 grains. The pressure-density curves of all simulations along with the deviation from the average EOS are presented in Fig. 6. The variation in pressure is up to 5%. Hence, the accuracy of the calibrated EOS can be roughly taken as 5%.
Fig. 6. Pressure-density curves for different realizations of the mesoscopic structure with calibrated parameters.
3.3 The unloading EOS
The unloading portion of the EOS is computed in simulations of a loading stage up to a prescribed density, followed by an unloading stage down to zero pressure. The unloading portion is obtained in simulations by reversing the velocities on the boundaries. This yields different unloading curves for different peak previous densities (ρmax). Generally, the EOS can be described by
P = P (ρ, ρmax) (4)
Notice that according to this model, a soil that passed a loading-unloading sequence will, when loaded again, follow the unloading branch of the EOS until it reaches the peak previous density, and then continue on the loading branch.
Fig. 7 presents the unloading curves from 8 different densities. The simulation shows that unlike the loading process which exhibits both accumulation of elastic energy and the plastic dissipation, the unloading process is purely elastic. The initial slope represents the drop in forces between grains. As unloading progresses, some grains disconnect, and as a result, the overall stiffness decreases down to zero-stiffness – the point at which the grains are not in contact.
Fig. 7. Pressure-density curves for unloading from different densities.
The volumetric speed of sound c in the soil is related to density-pressure curve of the unloading by
c2 = dP/dρ. (5) Since the model is calibrated from the loading curve,
the speed of sound is a useful parameter for validating the model. SJOBO experimental data and prediction of the herein model for the volumetric speed of sound at the beginning of an unloading phase are presented in Fig. 8. Note that the five lower density points of the SJOBO data were calculated from wave propagation measurements. Since the experimental apparatus did not enable pressures above 100 MPa (corresponding to a density of 2200 kg/m3), data points of higher density were extrapolated linearly. The two upper data points were taken as the sound of speed of Peaks Pike Granite [12] (assuming full pore closure) and show a clear discontinuity which suggests that the extrapolation is inaccurate.
Our Mesoscopic model presents an increase in the sound of speed up to the Quartz speed of sounds at the point of full pore-closure. The reasonable fit between the speeds of sound predicted by the model and the SJOBO measurements supports the accuracy of the model and shows that the EOS can be reasonably predicted even with simplified physics and grain morphology.
3.4 Extrapolation of the model to soils with higher initial density
The density of the soil depends on the tightness of packing and the grain size-distribution. Other properties of the soil may also vary due to gain size-distributions. For example, an ideal one-sized spherical grain ensemble in a tight random packing reaches a volumetric packing of 62.5%. A random tight-packing of spheres with a bimodal distribution may theoretically reach up to 85.9% [10]. One useful application of the model is to study how the density of the soil affects the EOS. In order to investigate this effect we choose a packing algorithm which assures a tight packing with a relatively low number of spheres. The initial grain ensemble is of tightly packed equally-sized spheres. Then, an unoccupied point in the RVE space is chosen randomly and a sphere is placed in it with initial random velocity. The sphere is then increased in size while colliding with adjacent spheres up to the point of locking. Then, if the sphere fulfils a certain size criterion, the process is repeated until the desired density is reached. Fig. 9 presents the progress of the packing as a function of the number of grains in the RVE. Notice that reaching very low porosities require a large number of grains, i.e., grain distributions with very large deviations in sizes.
Fig. 9. Packing fraction as a function of the number of grains. Simulations results for the compression of low porosity (high-density) sand with a porosity of ϕ0 = 0.3 are presented in Fig. 10 along with the standard-density sand. The low-porosity sand presents a higher stiffness, initially threefold the stiffness of the regular sand. As expected, the stiffness increases asymptotically up to the stiffness of Quartz. Note that this result is applicable to sand that has a low porosity due to its grain-grading. Reduced porosity may also occur due to past loads as analyzed in section 3.3 in this work.
Fig. 10. Pressure-density curves of low and regular porosity sands. To ease the comparison between the two sands, a translation along the abscissa of the low-porosity curve down to the initial density of the regular sand is plotted in a dashed green line.
4 Conclusions and outlook
In this work we presented a numerical model that predicts the EOS of a granular material while taking into account some aspects its random structure. Convergence of the model with respect to loading rate, randomness of meso-structure, and boundary-condition driven errors was shown. The model was then calibrated to the loading branch of the EOS of SJOBO sand. Validation was performed by comparing the unloading response of SJOBO sand to the model’s prediction. In addition, the EOS of sands of low porosities was predicted with a significant increase of stiffness. The simulations revealed that the curvatures observed at the unloading branches of the EOS are due to disconnections between the grains.
In the future this type of model may provide predictions for the strength of granular materials under high compression. The model may also predict, when taking into account fluid-structure interactions, the effect of water content on the EOS. In addition, grain fracture may be added to the model by using numerical methods such as smoothed particle hydrodynamics.
The author would like to thank Dr. Erez Dekel and Alon Malka-Markovitz for their valuable discussions.
References
1. Y. Lu, Z. Wang, K. Chong, Soil Dynamics and Earthquake Engineering 25 (2005)
2. B.E. Martin, M.E. thesis, University of Florida (2007)
3. P.R. Gefken, A.L. Florence, M. Sandi, Report# SRI PYU-6214, Stanford Research Institute, Menlo Park, CA (1996)
4. A.D. Barr, S. D. Clarke, M. Petkovski, A. Tyas, J. Warren, Proceedings of the Hopkinson Centenary Conference, Cambridge UK (2014)
6. L. Laine, A. Sandvik, Proceedings of the 4th Asia-Pacific Conference on Shock and Impact Loads on Structures, Singapore (2001)
7. L. Laine, O.P. Larsen, Proceedings of 83rd Shock and Vibration Symposium, Shock and Vibration Exchange, New Orleans, Louisiana (2012)
8. M. Larcher, N. Gebbeken, EPJ Web of Conferences 26, 04005 (2012)
9. B.D. Lubachevsky, F.H. Stillinger, J. Stat Phys 60, 5/6 (1990)
10. G. M. Knott, T. L. Jackson, J. Buckmaster, AIAA Journal 39, 4 (2001)
11. P. Heyliger, H. Ledbetter, S. Kim, J. Acoust. Soc. Am. 114, 2 (2003)