Available Online at www.ijcsmc.com
International Journal of Computer Science and Mobile Computing
A Monthly Journal of Computer Science and Information Technology
ISSN 2320–088X
IMPACT FACTOR: 6.017
IJCSMC, Vol. 6, Issue. 6, June 2017, pg.133 – 142
Popular Decision Tree Algorithms of
Data Mining Techniques: A Review
Radhwan H. A. Alsagheer
1, Abbas F. H. Alharan
2, Ali S. A. Al-Haboobi
3¹Faculty of Jurisprudence, Computer Center, University of Kufa, Iraq ²Faculty of Education for Girls, Computer Department, University of Kufa, Iraq ³Faculty of Computer Science and Mathematics, Computer Science, University of Kufa, Iraq
1
radhwan.hu@uokufa.edu.iq; 2 abbasf.abood@uokufa.edu.iq; 3 ali.alhaboobi@uokufa.edu.iq
Abstract— The technologies of data production and collection have been advanced rapidly. As result to that, everything gets automatically: data storage and accumulation. Data mining is the tool to predict the unobserved useful information from that huge amount of data. Otherwise, we have a rich data but poor information and this information may be incorrect. In this paper, review of data mining has been presented, where this review show the data mining techniques and focuses on the popular decision tree algorithms (C4.5 and ID3) with their learning tools. Different datasets have been experimented to demonstrate the precision.
Keywords— Data Mining, Decision tree, Classification, ID3, C4.5
I. INTRODUCTION
Daily, various organizations have drawbacks and damages because they assemble massive quantities of data. This is due to the lack of interest in methods that are extracting the useful patterns from these data. To improve revenue and reduce losses, we need to knowledge discovery in databases (KDD). KDD is process to analyse the data from various perspectives and obtaining the knowledge. There are many steps for KDD: Selection, Transformation, Interpretation/Evaluation, Processing and, Data mining. Data mining is part of KDD; its task is search for valuable data across enormous database. Therefore, much of researchers became increasingly interested in data mining[1, 2]. The data mining development is a consequence to increased use of computerized databases to store data and provide multi-level answers to the businessman, as shown in Table 1. [3].
TABLEI
DATAMININGEVOLUTION
Evolutionary Question Technology
Data Collection What was the revenue in six
months ago? computers, tapes, disks
Data Access What were item sales in India Jun.ago?
faster and cheaper computers with more storage, relational databases
Data Warehousing
What were item sales in India Jun.ago? Drill down to Delhi
faster and cheaper computers with more storage, On-line analytical processing multidimensional databases, data warehouses
Data Mining What's likely to happen to Delhi item sales next month? Why?
II. DATAMININGTECHNIQUES
These techniques are varying according to the wants of mining approaches[4]. There are a large number of good techniques for mining and data retrieval operation .these techniques involve Association, Clustering, Regression, and Classification as shown in Fig. 1.
Fig. 1 Data mining techniques.
Association enables the finding of hidden links between unlike variables in databases. It exposes ambiguous patterns in the data, to get best rules from other rules selects different measures of importance is used. The best measurement is lowest thresholds on support and confidence.
Clustering is the technology of identifying data sets that are comparable among themselves to understand the variations as well as the similarities within the data. It relies on the measuring of the distance .There are several different approaches of clustering algorithm as partitioning: Locality-based and Grid based [5].
Regression is a technology that allows data analysis to characterize the links between variables. It uses to get new values relied on presenting values. It uses linear regression for simple cases but with Complex cases which are difficult to predict uses relative decline because it relies on complex interactions of multiple variables[6].
Classification means the organization of data into categories to be easy to use and more efficient. It aims to accelerate getting data and retrieve it as well as predict a particular effect based on given information. For illustration, we can be divided the incoming messages to the e-mail address as given dates.
III.PREDICTIVE ANALYSIS
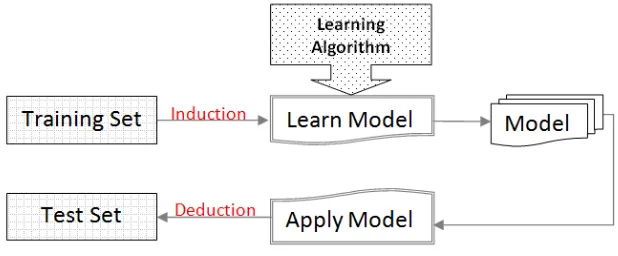
The predictive analysis could be defined as the part of data analysis to know unknown values of prediction target feature. It includes classification task for class label prediction and a numerical prediction where the task is to predicate continuous values or ordered values. The essential duties of prediction are learning model and prediction. Type of target attribute specifies whether the problem is classification with binary values or numerical prediction with continuous values[7]. Classification refers to predict a definite effect according to a specific input to get the outputs. The algorithm attempts to get relation through the attributes that would make it reasonable to get the outcomes. Fig. 2 is showing the classification task.
It concludes the functions to get classes or principles to get the class of objects whose class is uncovered. The derived steps are relied on the analysis of training set. To get the accuracy of the final, optimized and method, we use the test data. This data set is used to compute the goodness of classification learning. Decision tree, rule-based, back propagation, lazy learners and others are examples of classification methods that used in data mining. A decision tree is an important classification technique in data mining classification [8]. It concludes the functions to get classes or principles to get the class of objects whose class is uncovered. The derived steps are relied on the analysis of training set. To get the accuracy of the final, optimized and method, we use the test data. This data set is used to compute the goodness of classification learning. Decision tree, rule-based, back propagation, lazy learners and others are examples of classification methods that used in data mining. A decision tree is an important classification technique in data mining classification [8].
A. Decision tree
Decision Tree classification algorithm can be done in serial or parallel steps according to the amount of data, efficiency of the algorithm and memory available. A serial tree is a logical model as a binary tree constructed using a training data set. It helps in predicting the value of a target variable by making use of predictor variables [9]. It consists of hierarchically organized sets of rules. It is a plain recursive structure for representing a decision procedure in which a future instance is classified in present predefined classes and it attempts to divide observations into mutually exclusive subgroups. Each part in a tree corresponds to one or more records from the original data set. The topmost nodes are named as the root node (no incoming link) and represent all of the rows in the given dataset. The other nodes are named as internal or decision nodes (only one incoming link) use to test on an attribute. The down most nodes are named as terminal nodes (no out coming link) and denote a decision class, as shown in Fig. 3.
Fig. 3 The form of decision tree.
Each node generates child nodes until either the subgroups are very small to undergo similar meaningful division or no statistically significant subgroups are produced by splitting further. Some sections of the sample may outcomes in a big tree and some of the links may give outliers or false values. Such branches are required to be removed. Tree pruning should be done in a manner that does not affect the model's accuracy rate significantly. In our paper, we will leave the pruning for future work. Decision trees provide the easier way to represent the information and extract IF-THEN classification rules as in Fig. 4.
Fig. 4 The structure of trees and its rules.
B. Decision trees construction
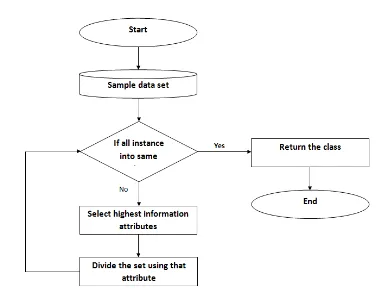
A top-down recursive and divide
- conquer manner are the ways that use to construct the tree as the Fig. 5,
the tree commences with root node to represent all training dataset.2. Otherwise, the tree selects the greatest information attribute to divide the set and labelled the node by
the name of the attribute.
3. Recur the steps and stop when all samples have the same class or there is no more samples or new
attributes to portion
4. Tree Ends.
Fig. 5 Decision trees construction
C. Decision tree algorithms
There are several algorithms that used to build decision Trees CHID, CART, ID3, C4.5, and others.
CHID (Chi-square–Automatic–Interaction–Detection): is an essential decision tree learning algorithm to handle nominal attributes only. It is a supplementation of the automatic interaction detector and theta automatic interaction detector procedures.
CART (Classification - regression tree): is the most popular algorithm in the statistical community. In the fields of statistics, CART helps decision trees to gain credibility and acceptancein additional to make binary splits on inputs to get the purpose.
ID3 (Iterative Dichotomiser 3) is an easy way of decision tree algorithm. The evaluation that used to build the tree is information gain for splitting criteria. The growth of tree stops when all samples have the same class or information gain is not greater than zero. It fails with numeric attributes or missing values.
TABLEII
THE DIFFERENCE BETWEEN C4.5 AND ID3
D. Attribute selection measures
Many measures that can be used to determine the optimal direction to split the records as:
Entropy
It is a one of the information theory measurement; it detects the impurity of the data set. If the attribute takes on c different values, then the entropy S related to c-wise classification is defined as equation below
P
P
i c i iS
E
1 2log
)
(
Eq 1
Pi is the ratio of S belonging to class i. The entropy is a unit of the expecting length measured in bits so the algorithm is base 2.
Information gain
It chooses any attribute is used for splitting a certain node. It prioritizes to nominate attributes having large number of values by calculating the difference in entropy. The value of Information Gain will be zero when the number of either yes’s or no’s is zero and when the number of yes’s and no’s is equal, the information reaches a maximum. The information gain, Gain(S, A) of an attribute A, relative to the collection of examples S, is defined as equation below
)
(
)
(
)
,
(
)(A v
Values v
v
Entropy
S
S
S
S
Entropy
A
S
Gain
Eq 2Where Values (A) is the set of all potential values for attribute A, and Sv is the subset of S for which
the attribute A has value v. We can use this measurement to group attributes and structure the decision tree where at each node is located the attribute with the towering information gain among the attributes not yet considered in the path from the root[10].
The gain ratio
It is a modification of the information gain that reduces its bias on high-branch attributes. Split Info (D,
T) is the information due to the split of T on the basis of value of categorical attribute D. as equations belowT)
D,
SplitInfo(
T)
Gain(D,
T)
D,
GainRatio(
Eq 3T
D
log
T
D
T)
Info(D,
Split
i2 K 1 i i
Eq 4IV.ID3 ALGORITHM
ID3 is a simple decision learning algorithm developed by J. Ross Quinlan (1986). ID3 constructs decision tree by employing a top-down, greedy search through the given sets of training data to test each attribute at every node. It uses statistical property call information gain to select which attribute to test at each node in the tree. Information gain measures how well a given attribute separates the training examples according to their target classification.
Algorithms Selection attribute handling continuous attributes
Missing values Need Test sample
Speed pruning
C4.5 Information gains ratio Pre-sorting handle NO faster Pre-pruning
Let us use the ID3 algorithm to decide if the time fit to play ball. During two weeks, the data are grouped to help build an ID3 decision tree bellow. The target is “play ball?" which can be Yes or No.
TABLEIII WEATHER DATA SETS
Outlook Temp Humidity Windy Play Golf
Rain Hot High false No
Rain Hot High true No
overcast Hot High false Yes
Sunny Mild High false Yes
Sunny Cool normal false Yes
Sunny Cool normal true No
overcast Cool normal true Yes
Rain Mild High false No
Rain Cool normal false Yes
Sunny Mild normal false Yes
Rain Mild normal true Yes
overcast Mild High true Yes
overcast Hot normal false Yes
Sunny Mild High true NO
To construct a decision tree, we need to calculate two types of entropy using frequency tables as follows:
Step 1: Calculate entropy of Play Golf (target).
Play Golf Entropy(Play Golf ) = Entropy (5,9)
= - (0.36 log2 0.36) - (0.64 log2 0.64)
= 0.94 Yes No
9 5
Step 2: The dataset is then split into the different attributes.
The entropy for each way is calculated. To get final entropy for the split calculates the difference between resulting entropy and the entropy before the split. The result means the Information Gain.
Play Golf
Yes No
Outlook
Sunny 3 2 Overcast 4 0 Rainy 2 3 Gain=0.247
Play Golf
Yes No
Temp.
Hot 2 2 Mild 4 2 Cool 3 1 Gain=0.029
Play Golf
Yes No
Humidity High 3 2
Normal 4 0 Gain=0.152
Play Golf
Yes No
Windy False 3 2
True 4 0 Gain=0.048
Step 3: pick out attribute with the greatest information gain as the decision node.
Play Golf
Yes No
Outlook
Step 4a: A branch with the entropy of Outlook= overcast.
Temp Humidity Windy Play Golf
hot high False Yes cool normal True Yes mild high True Yes hot normal False Yes
Step 4b: A branch with entropy of Outlook= sunny (Windy=False & Windy=True).
Temp Humidity Windy Play
Golf
mild high False Yes cool normal False Yes mild normal False Yes mild high True NO cool normal True No
Step 4c: A branch with entropy of Outlook= rain (Humidity= high & Humidity = normal).
Temp Humidity Windy Play
Golf
hot high false No hot high true No mild high false No Cool normal false Yes mild normal true Yes
Decision Tree of Weather data sets
V. C4.5 ALGORITHM
C4.5 is an algorithm used to generate a decision tree developed by Ross Quinlan.C4.5 is an extension of Quinlan's earlier ID3 algorithm. The decision trees generated by C4.5 can be used for classification, and for this reason, C4.5 is often referred to as a statistical classifier.
It is developed to handle Noisy data better, missing data, Pre and post pruning of decision trees, Attributes with continuous values and Rule Derivation.
C4.5 builds decision trees from a set of training data in the same way as ID3, using the concept of information gain and entropy in addition to gain ratio. The notion of gain ratio introduced earlier favors attributes that have a large number of values. If we have an attribute D that has a distinct value for each record, then entropy (D, T) is 0, thus information gain (D, T) is maximal. To compensate for this Quinlan suggests using the following ratio instead of information gain as[11]:
T)
D,
SplitInfo(
T)
Gain(D,
T)
D,
GainRatio(
Eq 5So gin ratio is a modification of the information gain that reduces its bias on high branch attributes.
Split Info (D, T) is the information due to the split of T on the basis of value of categorical attribute D as:
T
D
log
T
D
T)
Info(D,
Split
i2 K
1 i
i
Eq 6VI.CONTINUOUS-VALUE ATTRIBUTES
C4.5 can remedy both continuous and discrete attributes. In order to handle continuous attributes, it makes a threshold and then sections the list into those whose attribute value is up the threshold and those that are down than or equal to it.
TABLEIV
ILLUSTRATION:TEMPERATURE VALUES [12]
85 80 83 70 68 65 64 69 72 75 81 71 75 72
NO NO Yes Yes Yes NO Yes Yes NO Yes Yes NO Yes Yes
Step1: Sort temperature values and repeated values have been collapsed together.
64 65 68 69 70 71 72 75 80 81 83 85
Yes NO Yes Yes Yes NO NO Yes NO Yes Yes NO
Yes Yes
Step2: Great the possible positions for the breakpoint.
Step 3: rank for each breakpoint the gain.
For example, 71.5 is considered as a breakpoint value, since it is the middle point of 71 and 72.The information gain is calculated for each of the breakpoint value. The breakpoint <71.5 produces four yes’s and two no’s, whereas temperature > 71.5 produces five yes’s and three no’s, and so the information value of this breakpoint is
And so on for all other breakpoints.
Step 4: The breakpoint with top elevated information gain is chosen to split the dataset.
For example, the temperature values will be as:
=< 71.5
=< 71.5
=< 71.5
=< 71.5
=< 71.5
=< 71.5
> 71.5
> 71.5
> 71.5
> 71.5
> 71.5
> 71.5
Yes NO Yes Yes Yes NO NO Yes NO Yes Yes NO
Yes Yes
VII. DECISION TREE LEARNING TOOLS AND DATASETS
Many of software are available for data mining work. We will use Weka tool to demonstrate the experimental results of the dataset with 10- fold cross validation .The datasets are collected from UCI / KEEL repositories[12] to test the accuracy of ID3 and C4.5 classifiers.
WEKA [13] is a machine learning that supports many algorithms of data mining. The tool is programmed in Java language with GUI for interacting with data files in additional to produce visual results. The following table shows the characteristics of selected datasets with nominal attributes and no missing values.
TABLEV DATASETS CHARACTERISTICS
Data Set No.of Attributes No.of Classes No.of Instances ID3 C4.5
car 7 4 1728 89.3519 % 94.1551 %
connect-4 43 3 67557 74.1507 % 80.1901 %
monks 7 2 124 79.0323 % 80.6452 %
nursery 9 5 11025 97.9955 % 98.6032 %
promoter 58 2 106 76.4151 % 81.1321 %
tic-tac-toe 10 2 958 83.2985 % 86.4301 %
voting 17 2 435 94.2529 % 94.4828 %
zoo 17 7 101 92.0198 % 98.0792 %
kr-vs-kp 37 2 3196 99.4871 % 99.6055 %
Figure 6 show the precision of each dataset when applying ID3 and C4.5 algorithms.
We can handle other features of datasets that contain both continuous and discrete attributes with missing values[11]. Whereas the ID3 algorithm cannot handle these features by using unsupervised discretization to convert continuous attributes into categorical attributes and pre-processing to replace the empty cells.
VIII. CONCLUSION
Data mining is a collection of algorithms that is used by office, governments, and corporations to predict and establish trends with specific purposes in mind. In this document, we have presented a summary of data mining development, techniques, Predictive analysis and focus on C4.5 and ID3 of the decision tree in additional to make a comparison between them with applying them in a different type of data having different values. Lastly, we can state that C4.5 algorithm as an ID3 algorithm but it: utilizing unknown or missing values; different weights for attributes are acceptable; creating the tree then pruning (pessimistic prediction).
References
[1] S. M. Weiss and N. Indurkhya, Predictive data mining: a practical guide: Morgan Kaufmann, 1998. [2] U. M. Fayyad, et al., Advances in knowledge discovery and data mining vol. 21: AAAI press Menlo Park, 1996.
[3] D. T. Larose, Discovering knowledge in data: an introduction to data mining: John Wiley & Sons, 2014. [4] L. Borzemski, "Internet path behavior prediction via data mining: Conceptual framework and case study,"
J. UCS, vol. 13, pp. 287-316, 2007.
[5] P. Berkhin, "A survey of clustering data mining techniques," in Grouping multidimensional data, ed: Springer, 2006, pp. 25-71.
[6] J. Han, et al., Data mining: concepts and techniques: Elsevier, 2011. [7] J. R. Quinlan, C4. 5: programs for machine learning: Elsevier, 2014.
[8] J. Janeiro, et al., "Data mining for automatic linguistic description of data," in 7th International Conference on Agents and Artificial Intelligence, 2015, pp. 556-562.
[9] N. Rahpeymai, Data Mining with Decision Trees in the Gene Logic Database: A Breast Cancer Study: Institutionen för datavetenskap, 2002.
[10] L. Yuxun and X. Niuniu, "Improved ID3 algorithm," in Computer Science and Information Technology (ICCSIT), 2010 3rd IEEE International Conference on, 2010, pp. 465-468.
[11] D. Joiţa, "Unsupervised static discretization methods in data mining," Titu Maiorescu University, Bucharest, Romania, 2010.
[12] H. Blockeel and J. Struyf, "Efficient algorithms for decision tree cross-validation," Journal of Machine Learning Research, vol. 3, pp. 621-650, 2002.