Design Optimization of Hypoid Gear by Using Structural
Analysis
Kammari Muralikrishna Achari1, C. Lakshmaiah (M.Tech)2
1
P.G. Scholar, 2Assistant Professor
1,2
Branch: Machine Design 1,2
Geethanjali College of Engineering & Technology, Nannur 1
[email protected], [email protected]
ABSTRACT
Gears are used for transmitting power from shaft to engine parts in automobiles. Naturally Larger trucks supply the huge amount of materials from one place to another place. For that one trucks’ engines require more amount of torque from shaft. In the sense the hypoid gear used for transmit large amount of torque in larger trucks. Hypoid gears are strong in nature and sliding action along teeth to produce high amount of torque with reduction of mechanical efficiency and consequent reduction in fuel economy. Sliding action along teeth requires high lubricating system under extreme pressure between teeth. This project focus on design of hypoid gear using CAD software. After that controlling vibration analysis of hypoid gear under pressure conditions using different materials in Ansys FEA software. Unigraphics software is used for designing hypoid gear. And ansys software produces vibration results for different materials of hypoid gear.
INTRODUCTION 1.1 GEARS
Gears are toothed members which transmit power / motion between two shafts by meshing without any slip. Hence, gear drives are also called positive drives. In any pair of gears, the smaller one is called pinion and the larger one is called gear immaterial of which is driving the other.
When pinion is the driver, it results in step down drive in which the output
speed decreases and the torque increases. On the other hand, when the gear is the driver, it results in step up drive in which the output speed increases and the torque decreases. When two gears mesh, and one gear is bigger than the other (even though the size of the teeth must match), a mechanical advantage is produced, with the rotational speeds and the torques of the
two gears differing in an inverse
relationship.
In transmissions which offer
multiple gear ratios, such as bicycles,
motorcycles, and cars, the term gear, as
in first gear, refers to a gear ratio rather than an actual physical gear. The term is used to describe similar devices even when the gear ratio is continuous rather than discrete, or when the device does not actually contain any gears, as in a continuously variable transmission.
1.2 CLASSIFICATION OF GEARS
Gears are classified according to the shape of the tooth pair and disposition into spur, helical, double helical, straight bevel, spiral bevel and hypoid bevel, worm and spiral gears .
A.SPUR GEARS
Fig.1.1 Spur gear
B.Helical gear
Helical or "dry fixed" gears offer a refinement over spur gears. The leading edges of the teeth are not parallel to the axis of rotation, but are set at an angle. Since the gear is curved, this angling causes the tooth shape to be a segment of a helix. Helical
gears can be meshed
in parallel or crossed orientations.
The angled teeth engage more gradually than do spur gear teeth, causing them to run more smoothly and quietly, With parallel helical gears, each pair of teeth first make contact at a single point at one side of the gear wheel; a moving curve of contact then grows gradually across the tooth face to a maximum then recedes until the teeth break contact at a single point on the opposite side. In skew gears, teeth suddenly meet at a line contact across their entire width causing stress and noise. Skew gears make a characteristic whine at high speeds. The speed is considered to be high when the pitch line velocity exceeds 25 m/s.
Fig.1.2 Helical gear
C. DOUBLE HELICAL GEAR OR HERRINGBONE GEAR
Double helical or Herringbone gears used for transmitting power between two parallel shafts. They have opposing helical teeth with or without a gap depending on the manufacturing method adopted, Figure. Two axial thrusts oppose each other and nullify. Hence the shaft is free from any axial force. Though their load capacity is very high, manufacturing difficulty makes them costlier than single helical gear. Their applications are limited to high capacity reduction drives like that of cement mills and crushers, one such application is exhibited in Figure.. In a stable orientation, the helical gear faces are oriented so that each axial force is directed toward the center of the gear. If the gears become misaligned in the axial direction, the unstable arrangement will generate a net force that may lead to disassembly of the gear train, while the stable arrangement generates a net corrective force.
Fig.1.3 Double helical gear
D.INTERNAL GEAR
Internal gears are used for transmitting power between two parallel shafts. In these gears, annular wheels are having teeth on the inner periphery. This makes the drive very compact Figure.
In these drives, the meshing pinion and annular gear are running in the same direction Their precision rating is fair. They are useful for high load and high speed application with high reduction ratio. Applications of these gears can be seen in
planetary gear drives of automobile
Fig.1.4 Internal gear
E. STRAIGHT BEVEL GEAR
Straight bevel gears are used for
transmitting power between intersecting shafts. They can operate under high speeds and high loads. Their precision rating is fair to good. They are suitable for 1:1 and higher velocity ratios and for right-angle meshes to any other angles. Their good choice is for right angle drive of particularly low ratios.
Fig.1.5 Straight bevel gear
F.SPIRAL BEVEL GEAR
Spiral bevel gears can be manufactured as Gleason types (circular arc with non-constant tooth depth), Oerlikon and Curvex types (circular arc with constant tooth
depth), Klingelnberg Cyclo-Palloid
(Epicycloide with constant tooth depth) or Klingelnberg Palloid. Spiral bevel gears
have the same advantages and
disadvantages relative to their straight-cut cousins as helical gears do to spur gears. Straight bevel gears are generally used only at speeds below 5 m/s (1000 ft/min), or, for small gears, 1000 r.p.m.
Fig.1.6 Spiral bevel gear
G. WORM GEAR
Worm and worm gear pair consists of a worm, which is very similar to a screw and a worm gear, which is a helical gear. They are used in right-angle skew shafts. In these gears, the engagement occurs without any shock. High reduction ratios 8 to 400 are possible.
Their precision rating is fair to good. They need good lubrication for heat dissipation and for improving the efficiency. The drives are very compact. Worm gearing finds wide application in material handling and transportation machinery, machine tools, automobiles etc.
Fig.1.7 Worm gear 1.1.1. H.Cage gear
A cage gear, also called a lantern
rather than becoming trapped and increasing wear.
Fig.1.8 Cage gear
I. HYPOID GEAR
These gears are also used for right angle drive in which the axes do not intersect. This permits the lowering of the pinion axis which is an added advantage in automobile in avoiding hump inside the automobile drive line power transmission.
A hypoidgear is a style of spiral
bevel gear whose main variance is that the
mating gears' axes do not intersect. The
hypoidgear is offset from the gear centre, allowing unique configurations and a large
diameter shaft. The teeth on a hypoid
gear are helical, and the pitch surface is best
described as a hyperboloid.
A hypoidgear can be considered a cross
between a bevel gear and a worm drive.
Hypoid gears resemble spiral bevel gears except the shaft axes do not intersect. The pitch surfaces appear conical but, to compensate for the offset shaft, are in
fact hyperboloids of revolution Hypoid
gears are almost always designed to operate with shafts at 90 degrees. followed by a number denoting the viscosity.
Fig.1.9 Hypoid gear
To establish line contact between the pitches in hypoid gears, the kinematical correct pitch surfaces have to be determined based on the axis. In cylindrical and bevel gears, the axoids are identical to the pitch surfaces and their diameter or cone angle can be calculated simply by using the knowledge about number of teeth and module or ratio and shaft angle.
2. 1.3 HYPOID VS. SPIRAL BEVEL
GEAR SYSTEMS
The hypoid gear system has an offset or difference between the pinion centreline and ring gear centreline. This offset is given the variable E.
Most automotive applications utilize a hypoid gear system, meaning that the gears have an offset. Typical rear axles have a left-hand spiral angle on the pinion gear and a right-hand spiral angle on the ring gear to accommodate a below-centre offset. A below-centre offset allows the prop shaft to be located lower in the vehicle relative to the axle shafts.This allows the tunnel in the vehicle to be shallower and protrude less into the passenger compartment.
LITERATURE SERVEY
The Mathematical Model of Spiral Bevel Gears - A Review by Jixin Wang – Long Kong, – Bangcai Liu, The spiral bevel gear (SBG) is a key component of the power transmission of intersection axes. Since the mathematical model of the SBG is a basis for stress and thermal analysis, the optimization of machine-tool settings, frictional contact analysis in lubricated condition, and advanced manufacturing technology, research on designing and
manufacturing of SBGs based on
mathematical models of SBG has long been a topic of considerable interest in the field of mechanical transmission.
in a very complicated condition. On the other hand, as tooth flank form design and production control have been exclusively entrusted to the empirical method provided by cutting machine manufactures so far, detailed study was difficult.
New methods for the calculation of the load capacity of bevel and hypoid gears by Prof. Dr.-Ing. Bernd-Robert Höhn, For the experimental investigations two types of bevel gears were designed, one for the pitting tests and one for the tooth root tests. The aim of the two different gear designs was to examine pitting isolated from tooth root breakage. Thus, the gears for the tooth root tests were designed with offsets a = 0 / 15 mm / 31.75 mm with a relatively small module (mmn = 2,2…2,5 mm), the gears for the pitting tests with offsets a = 0 / 15 mm / 31,75 mm / 44 mm with a bigger module (mmn = 3,5…4,2 mm). All wheels had the same outer diameter de2 = 170 mm. The gear sets were made of 18CrNiMo7-6 case hardened and finish ground. For each geometry the S/N-curve was determined by approximately 20 tests.
Effects of Axle Deflection and Tooth Flank Modification on Hypoid Gear Stress Distribution and Contact Fatigue Life by H. Xu, J. Chakraborty and J.C. Wang, As is well known in involute gearing, “perfect” involute gears never work
perfectly in the real world. Flank
modifications are often made to overcome the influences of errors coming from manufacturing and assembly processes as well as deflections of the system. The same discipline applies to hypoid gears. This paper, first of all, presents an approach on
validating FEA-predicted axle system
deflections.
Computer Aided Design and Analysis of Gear Tooth Geometry by S.H. Chang and R.L. Huston, specifically, the report is concerned with a computer analysis of the geometry of gears. It presents a new modelling method t o simulate t h e gear manufacturing machining processes, such as
gear hobbing, and straight and spiral bevel gear machining.
PROBLEM DEFINITION AND METHODOLOGY
The hypoid gear sets are very sensitive to the precise contact conditions. Assembling test rigs is expensive and time consuming, whilst Finite Element analysis of the complete system can be problematic due to non-linear contact. The gear sets in actual vehicles are supported by a number of other components, and deformation of these components in operation produces different gear meshing positions to those observed when the gears are unloaded. These changes in meshing position increase the stress on the tooth roots. A hypoid gear tooth root stress simulation that considers the stiffness of the supporting components was therefore developed.
The main objective of this project is to design and analysis of hypoid gear tooth root stress simulation that considers the stiffness of the supporting components was developed by implementing CAD and CAE systems. The methodology followed in this project is as follows:
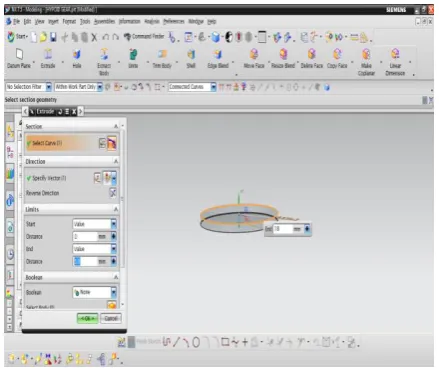
Create 3D model of the existing hypoid
gear from the 2D drawings.
Unigraphics software is used to do the 3D modelling.
Convert the 3D model into
parasolid(.xt) format and import into ANSYS to do Finite element analysis.
Perform Static analysis of the hypoid
gear by applying the axial force on tooth, and document the stresses and deflections.
Perform Modal analysis of the hypoid
gear and calculate the natural
frequencies in the operating range of 0-2000Hz.Plot the frequencies and mode shapes.
Perform harmonic analysis of the
hypoid gear in the operating range of 0-2000Hz.Check the harmonic response
of hypoid gear at the natural
stresses and deflections are within the limits.
These analysis carriedout for using steel
and HM Carbon/Epoxy materials. 3D MODELING OF HYPOID GEAR 2.1.1. 4.1 Dimension Specifications of Hypoid Gears
2.1.2.
Gears mate via teeth with very specific
geometry. Pressure angle is the angle of
tooth drive action, or the angle between the line of force between meshing teeth and the tangent to the pitch circle at the point of mesh. Typical pressure angles are 14.5° or 20°, but hyoids’ sometimes operate at
25°. Helix angle is the angle at which the
gear teeth are aligned compared to the axis.
Mounting Specifications of Hypoid Gears
Offset drives should be limited to 25% of the of the mating gear's diameter, and on heavily loaded alignments should not exceed 12.5% of the mating gear's diameter.
Table 4.1 Design parameters of the Hypoid gear
Boundary conditions for static analysis:
Hypoid gear is arrested in all Dof at
bolt region.
Tangential force (4306N) is applied on
one gear teeth.
Hypoid gears are widely used to transmit crossed-axis power and motion in vehicles,
ships and aircrafts, and could offer higher load capability and axis position flexibility than spiral bevel gears. The 3D model of the Hypoid gear is created using Unigraphics software from the 2d drawings. Unigraphics is the world’s leading. Unigraphics is used in a vast range of industries from manufacturing of rockets to computer peripherals.
2D drawing of Hypoid gear:
Fig 4.1 shows the 2D drawing of Hypoid gear (top view)
Fig:4.2 shows the 2d sketch of hypoid gear
Fig:4.4 shows the 2d sketch of hypoid gear
Fig:4.5 shows the extrude of sketch of hypoid gear
Fig:4.6 shows the 2d sketch for gear teeth
Fig:4.7 shows the extrude of sketch of hypoid gear
Fig:4.8 shows the 2d sketch for gear teeth
Fig: 4.9shows the 2d sketch for gear teeth
Fig:4.10 shows the instance for gear teeth
Fig:4.12 shows the extrude of sketch of hypoid gear
Fig:4.13 shows the 2d sketch for gear teeth
Fig:4.14 shows the extrude of sketch of hypoid gear
Fig:4.15 shows the 3d model of hypoid gear
STRUCTURAL ANALYSIS OF HYPOID GEAR USING STEEL
5.1 STRUCTURAL ANALYSIS OF HYPOID GEAR
Finite Element Modelling (FEM) and Finite Element Analysis (FEA) are two
most popular mechanical engineering
applications offered by existing CAE systems. This is attributed to the fact that the FEM is perhaps the most popular numerical technique for solving engineering problems. The method is general enough to handle any complex shape of geometry (problem domain), any material properties, any boundary conditions and any loading conditions. The generality of the FEM fits the analysis requirements of today’s complex engineering systems and designs where closed form solutions are governing equilibrium equations are not available. 5.2 FINITE ELEMENT METHOD
The FEM is numerical analysis
technique for obtaining approximate
solutions to wide variety of engineering problems. The method originated in the aerospace industry as a tool to study stresses in complicated airframe structures. It grew out of what was called the matrix analysis method used in aircraft design. The method
has gained popularity among both
researchers and practitioners and after so many developments codes are developed for wide variety of problems.
5.3 STRUCTURAL ANALYSIS
Structural analysis comprises the set of physical laws and mathematics required to study and predicts the behavior of structures. Structural analysis incorporates the fields of mechanics and dynamics as well as the many failure theories. From a theoretical perspective the primary goal of structural analysis is the computation of deformations, internal forces, and stresses. In practice, structural analysis can be viewed more abstractly as a method to drive the engineering design process or prove the soundness of a design without a dependence on directly testing it.
5.4 ANSYS DESCRIPTION:
structures, machine components or systems, apply operating loads and other design criteria and study physical responses, such as stress levels, temperature distributions, pressure, etc. The ANSYS program has a variety of design analysis applications, ranging from automobiles to such highly sophisticated systems as aircraft, nuclear reactor containment buildings and bridges. There are 250+ elements derived for various applications in ANSYS. In the present application shell, beam and mass elements that have structural static and dynamic analysis capabilities were considered.
FINITE ELEMENT MODELING:
3D model of the Hypoid gear was developed in UNIGRAPHICS from the design calculations done. The model was then converted into a parasolid to import into ANSYS. A Finite Element model was
developed with solid elements. The
elements that are used for idealizing the Hypoid gear were described below. Static and Modal analysis were carried out to find the natural frequencies. Changes were also implemented to shift the fundamental natural frequency. The elements that are used for idealizing the Hypoid gear are solid 187. The description of each element is given below.
5.5 STATIC ANALYSIS OF HYPOID GEAR
MATERIAL PROPERTIES:
All the components of the Hypoid gear are made using hot-rolled structural
steel IS: 2062-1999, Grade A, Fe
410WA.All the components of the Hypoid gear are assigned as per the below material properties.
Steel IS: 2062-1999 Mechanical Properties:
Young’s modulus = 200Gpa Yield Strength = 250 Mpa Tensile Strength = 410 Mpa Density = 7850 kg/m3 3D model of the Hypoid gear was developed in Unigraphics. The model was converted into a Para solid to import in ANSYS.
Fig.5.1 shows the geometric model of the Hypoid gear
The Hypoid gear model was meshed with solid 92 element type. A total number of 50440 elements and 78978 nodes were created. The meshed model is shown in the below figure.
Fig.5.2 shows the Finite element model of the Hypoid gear
Structural static analysis has been
performed on the Hypoid gear structure by applying the Tangential force. The bolt is fixed in all dof. Deflection and stresses are observed and plotted. From the analysis results the factor of safety of the Hypoid gear at different locations are calculated.
Boundary conditions for static analysis:
Hypoid gear is arrested in all Dof at
Hexagonal bolt.
Tangential force (4306N) is applied on
Fig.5.3 shows the Boundary conditions for static analysis of Hypoid gear
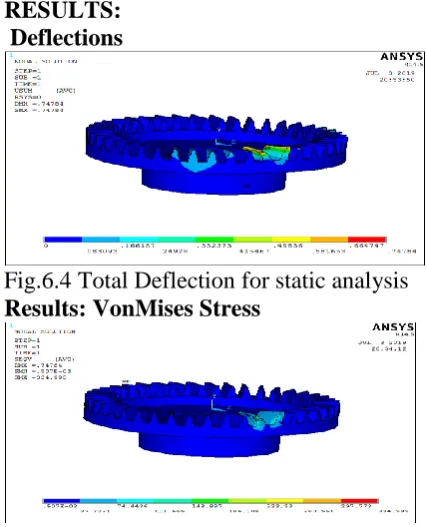
RESULTS: Deflections
Fig.5.4 Total Deflection for static analysis
Results: VonMises Stress
Fig.5.5 Von Mises stress for static analysis
From the analysis, It is observed that the maximum displacement and VonMises stress observed are 0.070mm and 131.42 Mpa respectively. The yield strength of the material is 250 Mpa. The FOS at most of the locations is 250/131.42=1.90.
Further modal analysis is done to check the dynamic behaviour of Hypoid gear.
5.6 DYNAMIC ANALYSIS OF HYPOID GEAR
5.6.1 MODAL ANALYSIS:
The objective of my analysis is to perform the modal analysis of the Hypoid gear and find the natural frequencies
Methodology:
Develop a 3D model.
The 3D model is created using
nx-cad software.
The 3D model is converted into
parasolid and imported into ANSYS to do modal analysis.
Calculate natural frequencies and
plot their mode shapes. Natural Frequency:
Natural frequency is the frequency at which a system naturally vibrates once it has been set into motion. In other words, natural frequency is the number of times a system will oscillate (move back and forth) between its original position and its displaced position, if there is no outside interference.
Fundamental Natural Frequency
The fundamental frequency, often referred to simply as the fundamental, is defined as
the lowest frequency of
a periodic waveform. In terms of a
superposition of sinusoids (e.g. Fourier
series), the fundamental frequency is the lowest frequency sinusoidal in the sum.
Resonance:
In physics, resonance is the tendency of a system to oscillate with greater amplitude at
some frequencies than at others.
Frequencies at which the response
amplitude is a relative maximum are known
as the system's resonant frequencies,
or resonance frequencies. At these
frequencies, even small periodic driving
forces can produce large amplitude
oscillations, because the system
stores vibration energy.
Resonance occurs when a system is able to store and easily transfer energy between two or more different storage modes (such as kinetic energy and potential energy in the case of a pendulum). However, there are
some losses from cycle to cycle,
called damping. Mode Shapes:
For every natural frequency there is a corresponding vibration mode shape. Most mode shapes can generally be described as being an axial mode, torsional mode, bending mode, or general modes. A crude mesh will give accurate frequency values, but not accurate stress values.
Modal analysis is used to determine the vibration characteristics (natural frequencies and mode shapes) of a structure or a machine component while it is being designed. It can also serve as a starting point for another, more detailed, dynamic analysis, such as a transient dynamic analysis, a harmonic response analysis, or a spectrum analysis.
MODAL ANALYSIS:
Modal analysis was carried out on Hypoid gear to determine the natural frequencies and mode shapes of a structure in the frequency range of 0 -2000 Hz.
Boundary Conditions:
Hypoid gear is arrested in all Dof at
Hexagonal bolt region
Fig5.6 shows the applied Boundary
conditions on Hypoid gear
Table shows the Frequencies Results and mass participation.
From the modal analysis, a total of 5 natural frequencies are observed in the frequency range of 553-850 Hz. The mode shapes of these frequencies are shown in the below figures.
The mode shapes for the above frequencies are plotted below.
Results –Mode1 @ 553.55Hz
Fig.5.7 Shows Mode shape [email protected] for Hypoid gear
Results –Mode2 @ 565.22 Hz
Fig .5.8 Shows Mode shape 2@ 565.22 Hz
for Hypoid gear
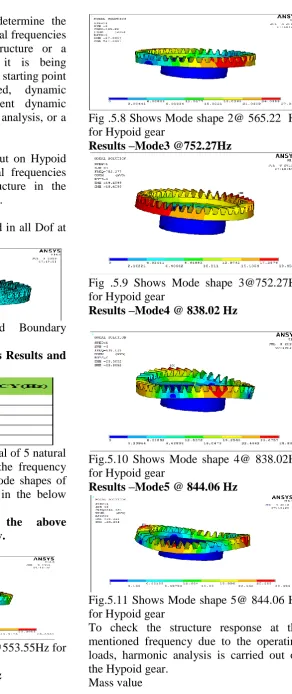
Results –Mode3 @752.27Hz
Fig .5.9 Shows Mode shape [email protected] for Hypoid gear
Results –Mode4 @ 838.02 Hz
Fig.5.10 Shows Mode shape 4@ 838.02Hz for Hypoid gear
Results –Mode5 @ 844.06 Hz
Fig.5.11 Shows Mode shape 5@ 844.06 Hz for Hypoid gear
To check the structure response at the mentioned frequency due to the operating loads, harmonic analysis is carried out on the Hypoid gear.
Mass value of hypoid gear absorbed that 11.0346 Kg
5.6.2 HARMONIC ANALYSIS OF HYPOID GEAR
Any sustained cyclic load will produce a sustained cyclic response (a harmonic response) in a structural system. Harmonic response analysis gives you the ability to predict the sustained dynamic behaviour of your structures, thus enabling you to verify whether or not your designs will successfully overcome resonance, fatigue, and other harmful effects of forced vibrations.
Harmonic response analysis is a technique used to determine the steady-state response of a linear structure to loads that vary sinusoidal (harmonically) with time. The idea is to calculate the structure's response at several frequencies and obtain a graph of some response quantity (usually displacements) versus frequency.
A harmonic analysis, by definition, assumes that any applied load varies harmonically (sinusoidal) with time. To completely specify a harmonic load, three pieces of information are usually required: the amplitude, the phase angle, and the forcing frequency range
Boundary conditions for harmonic analysis:
tangential force on one teeth at once = 4306N
Hypoid gear is arrested in all Dof at
Hexagonal bolt region.
Axial force is applied on one gear teeth.
Fig.5.12 Shows the applied
boundary conditions for harmonic analysis of Hypoid gear
The deflections and stresses nearest to the above frequencies are plotted below. DEFLECTIONS AND STRESS
1. Max. Deflection and stress of frequency @ 566.67Hz
Deflection:
Fig.5.13 shows the max. Deflection of Hypoid gear
Von Mises stress:
Fig.5.14 shows the Von Mises stress of Hypoid gear
2. Max. Deflection and stress of frequency @ 633.33Hz
Deflection:
Fig.5.15 shows the max. Deflection of Hypoid gear
Fig.5.16 shows the Von Mises stress of Hypoid gear
3. Max. Deflection and stress of frequency @ 700Hz
Deflection:
Fig.5.17 shows the max. Deflection of Hypoid gear
Von Mises stress:
Fig.5.18 shows the Von Mises stress of Hypoid gear
Table: shows the deflections and von mises stress for critical frequencies
From the above results it is observed that the critical frequencies 566.66Hz, 633.33 Hz, and 700Hz are having stresses of 2466.3MPa, 122.99MPa, and 134.97MPa respectively. The yield strength of the material used for Hypoid gear is 250 MPa. According to the Von Mises Stress Theory, the VonMises stresses of Hypoid gear at
frequencies are more than the yield strength of the material at 566.66 Hz.
STRUCTURAL ANALYSIS OF HYPOID GEAR BY USING COMPOSITE HM CARBON/EPOXY 6.1 STATIC ANALYSIS OF HYPOID GEAR
MATERIAL PROPERTIES
Longitudinal Modulus (EZ): 190 GPa
Transverse Modulus (EY): 7.7 GPa
Shear modulus (Gxy ): 4.2 GPa
Shear modulus (Gyz ): 4.2 GPa
Shear modulus (Gxz ): 4.2 GPa
Poisson’s Ratio: 0.3
Density: 1600 Kg/m3
Yield strength: 800 Mpa
Boundary conditions for static analysis:
Hypoid gear is arrested in all
Dof at Hexagonal bolt.
Tangential force (4306N) is
applied on one gear teeth.
Fig.6.1 shows the geometric model of the Hypoid gear
The Hypoid gear model was meshed with solid 92 element type. A total number of 50440 elements and 78978 nodes were created. The meshed model is shown in the below figure.
Fig.6.2 shows the Finite element model of the Hypoid gear
Structural static analysis has been
fixed in all dof. Deflection and stresses are observed and plotted. From the analysis results the factor of safety of the Hypoid gear at different locations are calculated. Boundary conditions for static analysis:
Hypoid gear is arrested in all
Dof at Hexagonal bolt.
Tangential force (4306N) is
applied on one gear teeth.
Fig.6.3 shows the Boundary conditions for static analysis of Hypoid gear
RESULTS: Deflections
Fig.6.4 Total Deflection for static analysis Results: VonMises Stress
Fig.6.5 Von Mises stress for static analysis
From the analysis, It is observed that the maximum displacement and VonMises stress observed are 0.747mm and 334.99
Mpa respectively. The yield strength of the material is 800 Mpa. The FOS at most of the locations is 800/334.99=2.38
Further modal analysis is done to check the dynamic behaviour of Hypoid gear.
6.2 MODAL ANALYSIS OF HYPOID GEAR:
Modal analysis was carried out on Hypoid gear to determine the natural frequencies and mode shapes of a structure in the frequency range of 0 -2000 Hz.
Boundary Conditions:
Hypoid gear is arrested in all Dof at
Hexagonal bolt region
Fig6.6 shows the applied Boundary
conditions on Hypoid gear
Table shows the Frequencies Results and mass participation.
From the modal analysis, a total of 5 natural frequencies are observed in the frequency range of 337-762 Hz. The mode shapes of these frequencies are shown in the below figures.
The mode shapes for the above frequencies are plotted below.
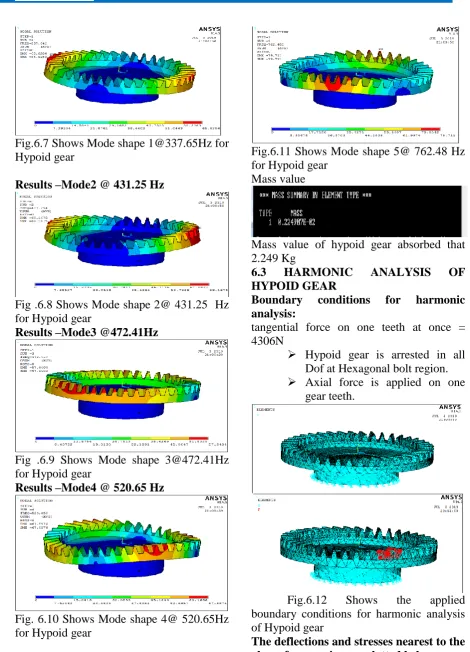
Fig.6.7 Shows Mode shape [email protected] for Hypoid gear
Results –Mode2 @ 431.25 Hz
Fig .6.8 Shows Mode shape 2@ 431.25 Hz
for Hypoid gear
Results –Mode3 @472.41Hz
Fig .6.9 Shows Mode shape [email protected] for Hypoid gear
Results –Mode4 @ 520.65 Hz
Fig. 6.10 Shows Mode shape 4@ 520.65Hz for Hypoid gear
Results –Mode5 @ 762.48 Hz
Fig.6.11 Shows Mode shape 5@ 762.48 Hz for Hypoid gear
Mass value
Mass value of hypoid gear absorbed that 2.249 Kg
6.3 HARMONIC ANALYSIS OF HYPOID GEAR
Boundary conditions for harmonic analysis:
tangential force on one teeth at once = 4306N
Hypoid gear is arrested in all
Dof at Hexagonal bolt region.
Axial force is applied on one
gear teeth.
Fig.6.12 Shows the applied
boundary conditions for harmonic analysis of Hypoid gear
1. Max. Deflection and stress of frequency @ 416.66Hz
Deflection:
Fig.6.13 shows the max. Deflection of Hypoid gear
Von Mises stress:
Fig.6.14 shows the Von Mises stress of Hypoid gear
2. Max. Deflection and stress of frequency @ 533.33Hz
Deflection:
Fig.6.15 Shows the max. Deflection of Hypoid gear
Von Mises stress:
Fig.6.16 Shows the Von Mises stress of Hypoid gear
3. Max. Deflection and stress of frequency @ 650Hz
Deflection:
Fig.6.17 shows the max. Deflection of Hypoid gear
Von Mises stress:
Fig.6.18 shows the Von Mises stress of Hypoid gear
From the above results it is observed that the critical frequencies 416.66Hz, 533.33 Hz, and 650Hz are having stresses of 112.16MPa, 214.76MPa, and 341.93MPa respectively. The yield strength of the material used for Hypoid gear is 800 MPa. According to the Von Mises Stress Theory, the VonMises stresses of Hypoid gear at frequencies are less than the yield strength of the material. Hence the design of Hypoid gear is safe for the above operating loading conditions.
RESULTS AND DISCUSSIONS
Hypoid gear was studied for validation for structural behaviour and design calculations. The following observations were made from the structural analysis of the design model. The Hypoid gear was studied for 3 different cases:
Static Analysis
Modal analysis
Harmonic Analysis
CONCLUSION
In the present project a Hypoid gear has been designed and analysis for structural behaviour of well designed model with design calculations.
The Hypoid gear was studied for 3 different cases:
Static Analysis
Modal analysis
Harmonic Analysis
1. From static analysis results absorbed
that hypoid gear using steel and HM
Carbon/Epoxy composite material
formed less vonmisses stress results
than their yield strength. But
Carbon/Epoxy composite material
released High Factor of safety than
steel hypoid. Which means
Carbon/Epoxy hypoid gear has high strength.
2. From modal analysis results absorbed
that hypoid gear using Carbon/Epoxy
composite material released less
frequency range and low mass value than steel hypoid gear.
3. From harmonic analysis results
absorbed that hypoid gear using
Carbon/Epoxy composite material
released less damped frequency range and harmonic stress values than steel hypoid gear.
Finally concluded that hypoid gear using Carbon/Epoxy composite material is a best one.
REFERENCES
1. Computer Aided Design and Analysis
of Gear Tooth Geometry by S.H. Chang and R.L. Huston,
2. Effects of Axle Deflection and Tooth
Flank Modification on Hypoid Gear Stress Distribution and Contact Fatigue Life by H. Xu, J. Chakraborty and J.C. Wang,
3. New methods for the calculation of the
load capacity of bevel and hypoid gears by Prof. Dr.-Ing.
4. Bernd-Robert Höhn, Development of
optimal tooth flank in spiral bevel gears by contact analysis and measurement by Tetsu Nagata, Hayato Shichino and Yukio Tamura,
5. The Mathematical Model of Spiral
Bevel Gears - A Review by Jixin Wang – Long Kong, – Bangcai Liu,
6. Fan, Q. “Enhanced Algorithms of
Contact Simulation for Hypoid Gear Drives Produced by Face-Milling and Face- Hobbing Processes,” 2007 ASME J. Mech. Des., 129 (1), pp.31–37.
7. Vimercati, M. and A. Piazza.
“Computerized Design of Face Hobbed
Hypoid Gears: Tooth Surfaces
FallTechnical Meeting, Detroit, Michigan, October 16–18.
8. Saiki, K., K. Tobisawa and M. Kano.
“Loaded TCA of Measured Tooth Flanks for Lapped Hypoid Gears,” 10th
ASME International Power
Transmission and Gearing Conference, Las Vegas, Nevada, September 4–7, 2007.
9. Xu, H. “Development of a Generalized
Mechanical Efficiency Prediction
Methodology for Gear Pairs,” 2005 Ph.D. Dissertation, The Ohio State University, Columbus, Ohio.
10.Xu, H., A. Kahraman and D.R. Houser.
“A Model to Predict Friction Losses of Hypoid Gears,” AGMA Fall Technical
Meeting, 05FTM06, Detroit, Michigan,
October 16–18, 2005.
11.Winter, H., and Paul. M., "Influence o f
R e l a t i v e Displacements Between Pinion and Gear on Tooth Root Stresses of S p i r a l Bevel Gears," ASME, Journal of Mechanisms, Transmission, and Automation i n Design, Vol.N107, Mar 1985, pp. 43-48.
12.38. Dudley, W. O., "Gear Handbook," McGraw H i l l , New York, 1962. Chapter 12.
13.Gutman, Ye., "Methods of Synthesis
and Analysis f o r Hypoid Gear Drives o f 'Formate' and Helixform,"' P.l, P.2, P.3., ASME, Journal of Mechanical Design, Vol. 103, Jan. 1981, pp. 83-102.
14.Krenzer, T. J., "The Effects of Cutter Radius on spiral Bevel and Hypoid Tooth Proportions," AGMA 124.20, Oct. 19-
15.Litvin, F., Petrov, K. and Ganshin, V .