TABLE OF CONTENTS:
Vol. 38, No. 4, July 1985
ARTICLES291
295
299
302
305 312
317
321
325
328
331
336
339
342
346
350
353
357
362
365
The Use of Supplement Blocks for Sheep Grazing Dry, Annual Pastures in California by E.J. DePeters, M.R. Dally, A.A. Alwash,and P. Therkelsen-Tucker Factors Influencing Selection of Resting Sites by Cattle on Shortgrass Steppe by
R.L. Senft, L.R. Rittenhouse, and R.G. Woodmansee
Forage Use by Cattle and Sheep Grazing Separately and Together on Summer Range in Southwestern Utah by G.B. Ruyle and James E. Bowns
Effects of Hunger Satiation on Diet Quality by Grazing Sheep by H.G. Jung and L.J. Koong
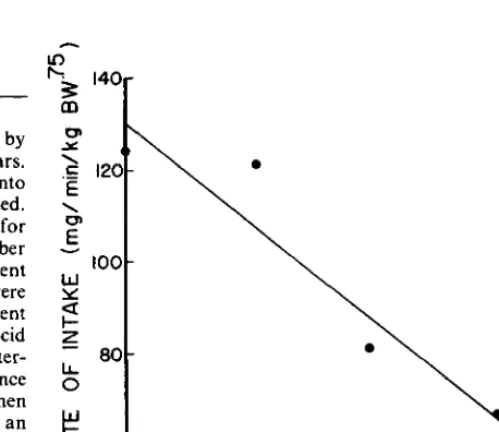
Factors Affecting Forage Intake by Range Ruminants: A Review by C.D. Allison Growth and Development of Pinegrass in Interior British Columbia by Darryl G.
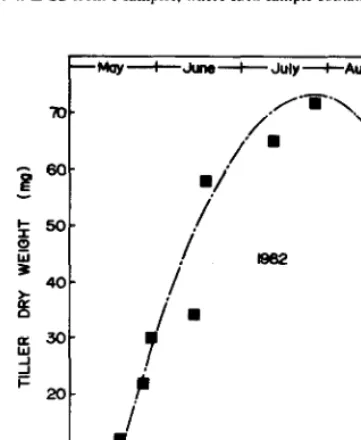
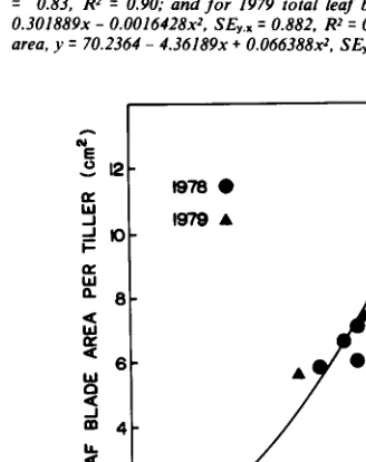
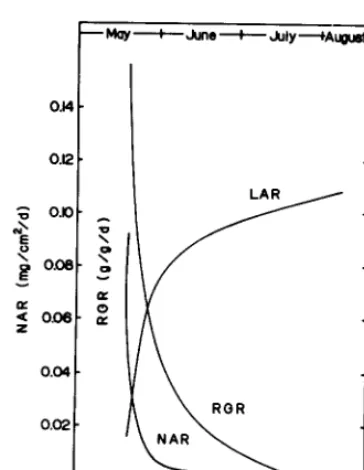
Stout and Barbara Brooke
Effects of Moisture and Temperature on Germination of Idaho Fescue by Paul Doescher, Richard Miller, and Alma Winward
Temperature and Water Stress Effects on Growth of Tropical Grasses by D.H. Bade, B.E. Conrad, and E.C. Holt
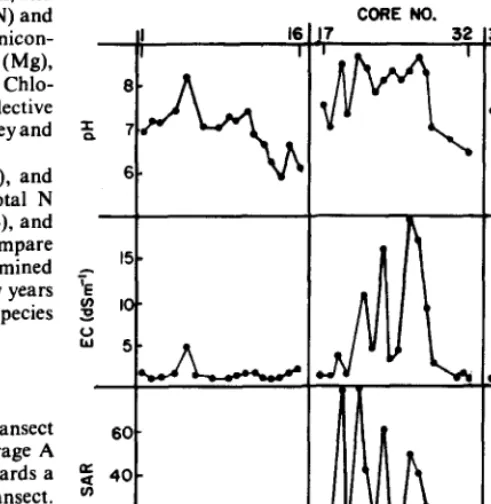
Soil and Vegetation Relationships in a Central Plains Saltgrass Meadow by R.A. Bowman, D.M. Mueller, and W.J. McGinnies
Influence of Canopy Characteristics of One-seed Juniper on Understory Grasses by M.R. Schott and R.D. Pieper
Environmental Factors Influencing Gardner Saltbush Seed Dormancy Alleviation by R. James Ansley and Rollin H. Abernethy
Germination Characteristics of Helianthus maxbnilianai Schrad. and Simsia caba (Engelm. & Gray) Gray by D.W. Owens and CA. Call
Growth Parameter Differences between Populations of Blue Grama by M.J. Samuel
Evaluation and Management of Grasses for Dual Livestock and Game Bird Use by E.C. Holt, J.R. Cain, and R.J. Hendler
The Animal-Unit and Animal-Unit-Equivalent Concepts in Range Science David L. Scarnecchia
Magnification and Shrub Stemmy Material Influences on Fecal Analysis Accuracy by Jerry L. Holechek and Raul Valdez
Automated Rainout Shelter for Controlled Water Research by R.E. Riesand L.G. Zachmeier
Response of Vegetation of the Northern Great Plains to Precipitation Amount and Grazing Intensity by Kenneth C. Olson, Richard S. White, and Brian W. Sindelar Economic Returns from Burning Tobosagrass in the Texas Rolling Plains D.E.
Ethridge, R.G. Sudderth, and H.A. Wright
Published bimonthly-January, March, May, July, September, November
Copyright 1985 by the Society for Range Manage- ment
INDIVIDUAL SUBSCRIPTION IS by membership in the Society for Range Management.
LIBRARY or other INSTITUTIONAL SUBSCRIP- TIONS on a calendar year basis are $58.00 for the United States postpaid and $68.00 for other coun- tries, postpaid. Payment from outside the United States should be remitted in US dollars by interna- tional money order or draft on a New York bank. BUSINESS CORRESPONDENCE, concerning sub- scriptions, advertising, reprints, back issues, and related matters, should be addressed to the Manag- ing Editor, 2760 West Fifth Avenue, Denver, Cola. 80294.
EDlTORlALCORRESPONDENCE,concerningmanu- scriptsorothereditorial mattersshould beaddressed to the Editor, 2766 West Fifth Avenue, Denver, Cola. 80204.
INSTRUCTIONS FOR AUTHORS appear on the inside back cover of each issue. A Style Manual is also available from the Society for Range Manage- ment at the above address @$1.25 for single copies; $1.00 each for 2 or more.
THE JOURNAL OF RANGE MANAGEMENT (ISSN 0022-409X) is published six times yearly for $58.00 per year by the Society for Range Management, 2760 West Fifth Avenue, Denver, Colo. 80204. SECOND CLASS POSTAGE paid at Denver, Colo. POSTMASTER: Return entlre Journal with address changa-RETURN POSTAGE GUARANTEED-to Society for Range Management, 2780 West Fifth Avenue, Denver, Cola. 80204.
The Journal of Range Management serves as a forum for the presentation and discussion of facts, ideas, and philosophies pertaining to the study, management, and use of range- lands and their several resources. Accord- ingly, all material published herein is signed and reflects the individual views of theauthors and is not necessarily an official position of the Society. Manuscripts from any source- nonmembers as well as members-are wel- come and will be given every consideration by the editors. Submissions need not be of a technical nature, but should be germane to the broad field of range management. Editor- ial comment by an individual is also welcome and subject to acceptance by the editor, will be published as a “Viewpoint.”
370
372
378
Effects of Secondary Metabolites from Balsam Poplar and Paper Birch on Cellulose Digestion by Kenneth L. Risenhoover, Lyle A. Renecker, and Luigi E. Morgantini
Emergence and Survival Response of Seven Grasses for Six Wet-Dry Sequences by G.W. Frasier, J.R. Cox, and D.A. Woolhiser
Some Responses of Riparian Soils to Grazing Management in Northeastern Oregon by C.C. Bohn and J.C. Buckhouse
BOOK REVIEWS
382 Emerging Technology and Managementfor Ruminants edited by Frank H. Baker and Mason E. Miller; Forages: Z%e Science of Grassland Agriculture edited by
Maurice E. Heath, R.F. Barnes, and D.S. Metcalf; Land Classification for Land Uses. Management, and Valuation by Marion E. Everhart.
Managing Edltor PETER V. JACKSON Ill
2760 West Fifth Avenue Denver, Colo. 80204 Editor
PATRICIA G. SMITH
Society for Range Management 2760 West Fifth Avenue Denver, CO 86204 Book Review Editor GRANT A. HARRIS
Forestry and Range Management Washington State University Pullman, Wash. 99164-6410
ASSOCIATE EDITORS E. TOM BARTLETT
Dept. of Range Science Colorado State University Fort Collins, CO 80523 GARY FRASIER
786 West Cool Drive Tucson, AZ 85704 G. FRED GIFFORD
Deot. of Ranae Wildlife, and Forestry University of-Nevada
Reno, Nev. 89506 THOMAS A. HANLEY
Forestry Sciences Lab Box 909
Juneau, Alaska 99802 N. THOMPSON HOBBS
Colorado Div. of Wildlife 317 W. Prospect Fort Collins, Colo. 80526 W.K. LAUENROTH
Department of Range Science Colorado State University Fort Collins. CO 80523
LYMAN MCDONALD Statistics Department
College of Commerce and Industry University of Wyoming
Laramie, WY 82071 ROBERT MURRAY
US Sheep Experiment Station Dubois, ID 83423
DARREL UECKERT
Texas Agricultural Experiment Station 7887 N. Highway 87
San Angelo, TX 76991 BRUCE WELCH
Shrub Science Laboratory 735 N 500 E
Provo, UT 84701 LARRY M. WHITE
USDA ARS
S. Plains Range Research Station 2999 18th St.
Woodward, OK 73801 JAMES YOUNG
USDA ARS
GRASLAN
KILLS
YOUR
TOUGHEST
BRUSH
PROBLEMS.
BulletsrM are the newest form of specially formulated for spot
kill undesirable brush in angeland. Brush Bullets let treat individual trees, clumps erows
problems
. . . killing spotty brush before they spread.
Brush Bullets work the same as Graslan pellets applied by plane, but you apply the Bullets by hand. No messing with sprays or sprayers. Just take the Bullets from the plastic, resealable pail and toss them under the brush YOU want to kill. The label tells you how many Bullets to use and how to apply them for different brush problems. Since Graslan is not a restricted use pesticide, you don’t need a pesticide license.
your nearest Graslan representative, call toll-free:
l-800-428-4441. -
Kills more than 50 brush species, roots and all.
fast burnback of toD arowth vou see with some When you need to clear large areas of overgrown brush, your local GRASLAN specialist can prescribe the formula for proper aerial application. By air, you can cover areas that are hard to reach on the ground. And by flying on Graslan pellets, you don’t have the drift problems associated with liquid spraying.
Talk over your brush control needs with your Graslan representative. He can advise you on how to get the best results. . . whether you use an aerial application or apply Brush Bullets vourself. For the name of
Whichever form you use, Graslan kills a wide variety of woody plants and weeds. And it kills the whole plant . . roots and tops. . . giving.grass more room to grow.
mce Graslan works slowly (one to three years, depending on rainfall) you won’t see the
Making more of the land you graze.
You don’t just want to kill brush, you want better grazing. So you can use the land you have to raise more cattle, more efficiently. Graslan may just be your most cost effective way to expand without adding acres. More grass. Graslan lets you kill the brush you want to kill, leaving more moisture, nutrients and sunlight for more grass.Better nutrition. Grasses, whether native or seeded, provide more palatable, more nutritious forage than woody plants and weeds.
Increased stocking rate. Grazing studies consistently show that with proper management, Graslan-treated acres support more animal units than untreated acres. In many cases, stocking rates can be doubled.
Higher weaning weights. Research also
other herbicides. a’ may take a little longer, but this thorough kill means brush can’t come back or resprout. And you can apply Graslan any time the ground is not frozen. You don’t have to wait until spring when brush is actively growing.
shows that with improved nutrition and good management, cows have higher conception rates, deliver more live calves and produce heavier calves at weaning.
Improved water supply. A sprawling growth of brush soaks up a lot of water and produces very little forage. Without brush, that water can be used for grass, for livestock, and increased soil moisture.
Greater land value. While all the benefits of brush control with Graslan make your grazing land more productive, they also make that same land more valuable. So Graslan is not only a tool for today, ils an investment for tomorrow.
Talk to your Graslan representative or call the toll-free number above. And start clearing the way to better grazing with Graslan.
Elanw Products Company A Division of Eli Lilly and Company 740 South Alabama Street Indianapolis, Indiana 46285
SOCIETY FOR
RANGE MANAGEMENT
President
EDWARD A. MCKINNON Box 3474 Sta. B.
Calgary, Alta., Canada T2M2Ml 1st Viie-President
F E “FEE” BUSBY ’ i203 Park,
Laramie, WY 82070 2nd Vke-President JACK R. MILLER
7 Azalea Ct. Petaluma, Calif. 94952 Executive Vice-President PETER V. JACKSON III
Society for Range Management 2768 West Fifth Ave.
Denver, Cola. 80284 (303) 571-0174 Directors 1983-85 PAT 0. CURRIE
Livestock and Range Research Station Miles City, Montana
DAVID A. FISCHBACH Box 218
Faith, South Dakota 57626 1984-1986
JOHN R. HUNTER Range 81 Wildlife Dept. Texas Tech University Lubbock, Texas 79489 DICK WHETSELL
P.O. Box 1289 Pawhuska, OK 74856 1985-1987
REX CLEARY P.O. Box 1098 Susanville, Calif. 96138 ROBERT ROSS
3% E. Story
Bozeman, Mont. 59715
The term of office of all elected officers and directors begins in February of each year during the Society’s annual meeting.
THE TRllL BOSS
Contribution Policy
The Society for Range Management may accept donations of real and/or personal property, subject to limitations imposed by State and Federal Law. All donations shall be subject to control by the Board of Directors and their discretion in utilization and application of said donations. However, consideration may be given to the donor’s wishes concerning which particular fund account and/or accounts the contribution would be applied.
We recommend that donor consult Tax Advisors in regard to any tax consideration that may result from any donation. Donations may be made by bequests, legacies, devises or transfers from private individuals, partnerships, corporations, foundations, sections, organizations, estates, and trusts, or a memorial fund established as an expression of remembrance to members of real and/ or personal property. Donations can be sent to the Society for Range Management, Executive Vice-President, 2760 West Fifth Avenue, Denver, Colorado 80204.
The Society for Range Management, founded in 1948 as the American Society of Range Managemenr, is a nonprofit association incorporated under the laws of the State of Wyoming. It is recognized exempt from Federal income tax, as a scientific and educa- tional organization, under the provisions of Section 501(c)(3) of the Internal Revenue Code, and also is classed as a public foundation as described in Section 509(a)(2) of the Code. The name of the Society was changed in 1971 by amendment of the Articles of Incorporation.
The objectives for which the corporation is established are:
--IO develop an understanding of range ecosystems and of the principles applicable to the management of range resources;
-to assist all who work with range resources to keep abreast of new findings and techniques in the science and art of range management;
-to improve the effectiveness of range management to obtainfrom range resources the products and vaIues necessary for man S welfare;
-to create a public appreciation of the economic and social benefits to be obtained from the range environment;
-to promote professional development of its members.
The Use of Supplement Blocks for Sheep Grazing Dry,
Annual Pastures in California
E.J. DEPETERS, M.R. DALLY, A.A. ALWASH, AND P. THERKELSEN-TUCKER
Abstract
The objective of this study was to evaluate the use of supplement blocks on body weight change, blood parameters, and lambing performance of ewes grazing dry, annual grasses during the summer prior to and during breeding. Two experiments were conducted in successive years to compare performance of unsup- plemented control (C)and supplemented (S) Targhee ewes. In the first season, yearling ewes were used while aged ewes (2 or 4 years) were used during the second season. During the fust year (1980), supplemented ewes lost less body weight during the dry grazing season than C ewes. However, no lambing performance difference was found between C and S groups. During the second year (1981), supplemented ewes maintained their body weight over the summer while C ewes lost weight. In addition, lambing performance (mul- tiple births) was higher for S than C ewes. Supplementation of ewes with blocks containing molasses, urea, protein, and minerals required little labor input. However, based on lambing perfor- mance, it is unlikely that supplementation would be economically profitable under the range conditions utilized in these trials.
Table 1. Ingredient and chemical composition of supplement block fed to range sheep.
Block
Sheep grazing pastures containing dried, annual grasses during the summer show a progressive decline in body weight and produce fewer lambs when exposed to rams in the fall (Tore11 et al. 1972a). In the north coastal areas of California, flushing ewes to improve
lambing performance has been practiced by commercial sheep
producers maintaining flocks on dry summer range forage. While this practice has increased the incidence of multiple births (Tore11 et al. 1972a, b), flushing can be expensive in terms of feed and labor required.
Ingredients Molasses solids Cottonseed meal Urea
Flour, bakery Fat
Fish solubles
Rock phosphate Lime Zinc sulphate Copper sulphate
Composition
Total nitrogen (N) Nonprotein-N Fat Ash
Dry matter
%DM
66.96 14.0
6.1 6.0 2.4
2.0
1.3 1.0 .2 .04
5.0 3.4 2.3 13.9
90.2
contained nitrogen from protein and nonprotein sources and
minerals.
Forage available during the dry grazing period is low in nitrogen and high in fiber content. Supplementing animals grazing forage low in nitrogen with urea and molasses has been found to result in reduced live weight losses compared with unsupplemented animals (Beames and Morris 1965, Entwistle and Knights 1974, Mulhol- land and Coombe 1979). In contrast, Beasley and McMeniman (1976) reported no advantage in urea and molasses supplementa- tion. Forages containing below 1% nitrogen are reported to have reduced efficiency of cellulose breakdown in the reticula-rumen (Pigden and Heaney 1969). Therefore, attempts have been made to supplement low nitrogen diets with urea. Nitrogen from urea can be used for microbial growth if adequate energy is available result- ing in improved fiber digestion. However, there is a limit to the amount of nonprotein nitrogen that can be utilized by the micro- bial population (Satter and Roffler 1975).
Experiment 1. During the first grazing season (6/ 80 to IO/ 80) 76 yearling Targheeewes were randomly assigned to 1 of 2 treatments. Treatments consisted of either no supplementation (C) or supple- mentation (S) with a hard molasses-nitrogen-mineral block during the summer dry grass grazing period. Animals were weighed and assigned to treatments on 6/28/80 and were allotted to 1 of 2 pastures. The range pastures consisted of annual grasses and forbs (Van Dyne and Heady 1965) which were already dry at the initia- tion of the study. Grasses included soft chess (Bromus mollis),
slender oat (Aveno barbatu), silver hairgrass (Aim caryophylleu),
annual fescues (Festuca spp.), ripgut grass (Bromus rubens), and
medusahead (Taeniatheran asperum). Forbes included
broadleaf filaree (Erodium botrys), true clover (Trifolium spp.), and Italian thistle (Curduus pycnocephalus).
The objective of the present study was to evaluate hard supple- ment blocks as a source of nitrogen, energy, and minerals and their effects on live weight change of ewes grazing summer range and their subsequent lambing performance.
Materials and Methods
Two experiments were conducted at the Hopland Field Station to evaluate the use of a hard supplement block on body weight and lambing performance of ewes grazing dry annual California range land for 2 seasons. Ingredient and chemical compositions of the supplement block used during both grazing seasons are shown in Table 1. The block was composed predominately of molasses and
Ewes were weighed monthly. Determination of plasma glucose and urea nitrogen was made by jugular blood samples collected from all ewes prior to monthly weighing. Blood was collected in 10 ml vacutainers containing disodium EDTA and sodium fluoride and was centrifuged at 3000 rpm for 10 minutes. Plasma was frozen for later analysis. Fecal samples from 10 ewes in each group were also collected at weighing. Because of the difficulty in obtaining sufficient sample size from each animal, fecal samples were compo- sited (many sheep defecated while being moved through the corral area, making sample collection difficult). Groups were rotated between pastures to reduce pasture effects following monthly weighing of sheep. Samples of diets selected by grazing sheep were obtained using 6 esophageally fistulated sheep. Three animals per pasture were used. Samples were collected at 600 h for 30 minutes 1 day per month. Forage samples were dried, ground, and analyzed individually.
The authors are assistant professor, research associate, visiting scientist from the University of Baghdad, and graduate student, Department of Animal Science, Uni- versity of California, Davis 95616.
The authors wish to thank Benton Feed Yard of Walnut, Calif., for supplying the supplement blocks and D.T. Tore11 for his help.
Manuscript accepted October 18, 1984.
Supplement blocks were placed in wooden mangers in the pas- ture at the bedding area. Blocks were weighed initially and at approximately weekly intervals thereafter. Fresh blocks were pro- vided when necessary until lo/ 29/ 80, and samples taken for chem- ical analysis. All ewes were shorn on 7/ 14180 and weighed before
and after shearing. Two Targhee rams per group were placed with ewes for mating for 40 days, beginning 8/ 28/ 80. All ewes were barn lambed to facilitate collection of lambing data.
Experiment 2. Aged Targhee ewes (106) were allotted to 1 of 2 treatment groups (53 ewes/group) as described in Experiment 1 based on age of ewe (2 vs 4 year old) and previous lambing performance (single vs multiple births). In an attempt to advance onset of the breeding season, vasectomized rams were placed with both groups between 7/ 23 to 8/ 9/ 8 1. Two intact Targhee rams per group were added for mating and remained with ewes for 40 days, beginning S/9/81. Supplement blocks were the same as used in Experiment 1. Blocks were offered until lo/ 14/ 8 1. Animals were weighed monthly and jugular blood samples collected randomly from 20 ewes per group prior to weighing. Samples of diets selected by grazing ewes were obtained using 2 esophageally fistulated animals per pasture (4). Samples were collected at 600 h for 30 minutes 1 day per month. Forage samples were dried, ground, and analyzed individually. Pastures were the same as used in Experi- ment 1. Supplement blocks were sampled and weighed weekly. Fecal samples were randomly collected from 10 ewes per group and prepared as in Experiment 1. All ewes were barn lambed for collection of lambing data.
Esophageal forage and fecal samples were analyzed for dry matter (DM), nitrogen(N), and ash according to the specifications provided by the Association of Official Analytical Chemists (1975). Acid detergent fiber (ADF), cellulose, lignin, and neutral detergent fiber (NDF) were determined by procedures described by Goering and Van Soest (1970) and in vitro disappearance of organic matter (IVOMD) according to Tilley and Terry (1963). Plasma was analyzed for glucose and urea nitrogen on a Technicon Auto Analyzer by method N-2b and N-lb, respectively. Supple- ment block samples were analyzed for total nitrogen and nonpro- tein nitrogen (Association of Official Analytical Chemists 1975).
Body weight and plasma urea nitrogen and glucose for each weigh date were analyzed for differences by t-test (Dixon et al. 1981). Lambing performance was analyzed as categorial data because the variables are discrete (Dixon et al. 1981). Statistical model included treatment as a factor in Experiment 1 and 2. Age of ewe was initially included in the model for Experiment 2 but was found to be not significant and therefore only treatment was included as a factor. Individual animal data during each experi- ment were used for statistical analysis since groups were not repli- cated. It was assumed that all animals had equal access to blocks and therefore individual animal data were used, although the authors acknowledge the shortcomings of such analysis. Chemical compositions of esophageal forage and fecal grab samples were not statistically analyzed.
Results and Discussion
During Experiment 1, supplement intakes were low during the first 8 weeks of the trial (Fig. 1). As the trial progressed, muzzle stains indicated an increasing number of ewes consumed the sup- plement. From the end of August to the end of October, supple- ment intake averaged 130 g DM/ewe/day. This provided 6.5 g N/ewe/day, of which 68% of the nitrogen was from nonprotein sources. Approximately 40% of the ewe’s daily N requirement was supplied by block supplementation during this period for ewes averaging 47 kg body weight (National Research Council 1975). Yearling ewes were slow to adapt to the blocks even though blocks were available at all times. Intake of supplement increased as the trial progressed. Quality of forage selected by grazing animals varied little during the grazing period (Table 2). Nitrogen content was low and fiber content high for all samples for both pastures.
No difference in body weight between the two groups was observed except on 10/22/80, at which time S ewes weighed more than C ewes (Fig. 2). This time period of improved body weight coincides with the time of highest supplement intake. However, ewes in both groups lost body weight from the end of July through
292
1980
r
TIME
Fig. 1. Daily intake of supplement (Exp. 1).
Table 2. Chemical composition of esophageal forage samples during the grazing season (Exp. 1).
Pasture’ I Pasturec 2
Date” 7131 8/28 9124 7131 8/28 9124
ltemb
Nitrogen (o/c) 1.1 1.3 1.2 1.1 1.2 1.2
ADF (%) 50.6 7.7 52.2 8.6 9.1 50.7
NDF (%) 62.0 61.5 67.8 65.0 63.9 70.2 Cellulose (%) 9.4 6.2 9.4 7.5 6.9 8.0
Lignin (%) 8.4 8.8 9.3 8.6 9.6 9.3
IVOMD (%) 52.0 53.1 50.0 50. I 49.3 49.2
“Saves begangrazingpasture Lon7/3l/BO,wereswitched topasture2until8/28/80 when they were returned to pasture I, etc.
%‘alues are expressed on an organic matter basis. ‘Pasture I was 30.8 ha and pasture 2 was 33.6 h.
breeding.
During the second experiment, mature ewes consumed more supplement during the early weeks of the trial than yearling ewes. Molasses stains on muzzles were used as an indication that all ewes except one consumed the block. Quality of forage selected by grazing animals did not change during the grazing period (Table 3). Although the same pastures were used in both years, higher N and lignin contents were observed in the second grazing season. The reason for the higher lignin content is uncertain. It may have contributed to the slightly lower in vitro disapperance of organic matter.
Body weight for S ewes during the second grazing season was greater (K.05) than C ewes only at the last 2 weighing dates (Fig. 4). Weight gain for S ewes coincided with the period of greatest supplement intake. Intake averaged 301 g DM/ewe/day supplying 15 g N/ewe daily or approximately 100% of the ewe’s daily requirement based on an average body weight of 54 kg (National Research Council 1975). Even though S ewes lost body weight during the last period of the trial, final body weight was greater (P<.O5) for S than for C ewes. Unsupplemented C ewes lost a total of 5 kg of body weight per ewe over the grazing season while S ewes maintained initial body weight. Supplemented ewes gained body
Table 3. Chemical composition of esophageal forage samples during the second grazing season (Exp. 2).
Pasture I
Date” 6123 7121 8126 9123
hen-lb
Nitrogen (%) 1.9 1.3 1.9 I.0
ADF (%) 39.3 53.2 41.6 52.8
NDF (%) 57.1 70.4 49.3 74.9
Cellulose (%) 23.8 36.7 18.9 43.7
Lignin (%) 13.7 13.3 21.5 6.3
IVOMD (%) 39.6 48.2 37.0 52. I
“S ewes began grazing pasture I on 6123181. were switched to pasture 2 on 7121181, etc. bValues are expressed on an organic matter basis.
6123
1.7 36.4 55.1 22.7 12.5 39.2
Pasture 2
7121 8126 9123
I.1 1.6 1.7
49.8 45.2 54.5
74.2 56.7 59.0
40.2 27.4 29. I
6.9 17.0 23.6
53.6 40.3
54
1980
52 -
: 50 -
l-
& 46 -
t;
3 46 - &
g 44 -
42 -
6124 7114 7130 8127 9124 10122
TIME
Fig. 2. Monthly body weight control (AA)andsupplemenfed (U - q )ewes (Exp. I),
400
ri
i
JUL
L
1981
\UG
SEP
1
OCT
TIME
Fig. 3. Daily intake of supplement (Exp. 2).
JOURNAL OF RANGE MANAGEMENT 38(4), July 1985 .
52 -
6123 7121 6121 9115 10114
TIME
Fig. 4. Monthly body weight control (AA)andsupplemented &I - q )ewes (Exp. 2).
weight during mating while C ewes lost weight.
In Experiment 1 no difference was found between groups in the plasma glucose levels at the first sample date, but at subsequent sampling dates plasma glucose was higher (P<.O5) for ewes (S) receiving the supplement block (Table 4). A similar pattern was observed during the second grazing season where plasma glucose concentrations on July 21 were found not to differ, but at subse- quent dates were higher (X.05) for S than for C ewes. Plasma urea nitrogen (PUN) in Experiment 1 was lower (K.05) for S than for C ewes at the first sampling period (Table 4). However, at subse- quent samplings S ewes had higher PUN concentrations (P<.O5) than their unsupplemented counterparts. During the second graz- ing season PUN was greater for S than for C ewes at all sampling dates.
Lambing performance of yearling ewes during the first season was not affected by supplementation (Table 5). Lambing percent for ewes present at lambing was 96 and 109% for C and S groups, respectively. No difference in the proportion of multiple births between groups was found. Observed lambing performance and number of dry ewes were similar to values reported previously at this station (Tore11 et al. 1972b).
Lambing performance for aged ewes during the second grazing season was affected by supplementation. Ewes receiving the sup- plement produced more twins (K.05) than unsupplemented ewes (Table 5). There were no multiple births among C ewes. Although lambing performance was improved for S ewes, performance was below that observed previously for ewes fed in drylot (Tore11 et al. 1972b) or supplemented with alfalfa pellets while grazing dry, annual grass (Tore11 et al. 1972a). Performance for C ewes was poor and below levels previously observed at this station for range
Table 4. Plasma urea nitrogen (PUN) mod glucose of ewes during the first (Exp. 1) and second (Exp. 2) grazing season.
Exp. I Exp. 2
PUN’ Glucose1 PUN Glucose
Group C s C S C S C S
Date Date
7/30/80 8.4” 7.6b 54.2 56.7 7/21/S] 6.4” 10.2b 46.2 49.7
8/27/80 6.8’ 10.4b 50.3” 54.7b 8/2l/Sl 5.7” 9.4b 50.4’ 56.5b
9124180 6.8’ 8.2b 58.7’ 64.4b S/15/81 4.6” 7.7b 50.1” 53.3b
IValues expressed as mg/ 100 ml.
a~bMeans with different superscript between C and S within a blood parameter differ K.05.
Table 5. Lambing performance of ewes in Exp. 1 and Exp. 2.
Group Measurement
Exp. I’ Exp. 2
C S C S
No. ewes 28
Lambing %I 96.4
Lambing o/o2 112.5
% dry ewes 14.3
% multiple births 12.5 Lambing date (d)J 221 ‘Lambs born X lOO/ewe present at lambing. *Lambs born X lOO/ewe lambing.
34 31 49
108.8 87.1 100.0 115.6 100.0” I 16.7b
5.9 12.9 14.3
15.6 0” 16.7b
221 223 221
accept the blocks. Other workers have reported variation in accep- tability of urea-molasses supplements (Nolan et al. 1975, Mulhol- land and Coombe 1979, Lobato and Pearce 1980a). Intake of blocks was greater earlier and throughout the second grazing season. Although some ewes in the S group were experienced with blocks, Lobato and Pearce (1980b) reported that previous expe- rience with molasses-urea blocks did not consistently affect initial intake with sheep.
‘Lambing date is days at lambing where day I = July I. s.bMeans with different superscripts differ K.05.
bred ewes (Tore11 et al. 1972a). However, in the present work, breeding took place earlier in the breeding season.
Animal losses for both experiments was similar. Coyote and dog kills accounted for some losses, although other animals were miss- ing and no determination of loss could be made. During Experi- ment 2, twelve C ewes were eliminated from the study as a result of being bred out of schedule by a ram gaining access to the pasture.
In summary, supplement blocks containing molasses, N, and minerals reduced body weight loss and did not affect reproductive performance of yearling ewes during the first experiment. Supple-
mentation of aged ewes maintained initial body weight and
improved reproductive performance during the second grazing
season. However, the cost of supplementation may not be cost effective compared with flushing ewes just prior to and during breeding with concentrate or forage. Block supplementation may be cost effective if death losses of ewes are reduced during summer grazing of annual ranges, which could not be measured in the present experiments.
Literature Cited
Allden, W.G., and A.C. Jennings. 1969. The summer nutrition of immature sheep: the nitrogen excretion of grazing sheep in relation to supplements of available energy and protein in a Mediterranean environment. Aust. J. Agr. Res. 20: 125.
Composite fecal grab samples were collected 3 times during each grazing season. During the first grazing season fecal N levels averaged 1.7 and 1.8% for C and S groups, respectively. For the second grazing season fecal N levels were slightly higher for sup- plemented ewes (2.3%) compared with control ewes (I .70/o). The higher fecal N content of S ewes may indicate improved pasture digestibility (Gartner and Murphy 1972). Allden and Jennings (1969) proposed that fecal N values below 1.4-1.5s may indicate that grazing animals are marginal in dietary N. However, response to urea supplementation has been reported for cattle fed diets containing 1.6% N (Langlands and Donald 1978). These authors proposed that the dietary N level requiring supplemental N is influenced by organic matter digestibility and rumen degradability of the protein. In the present work, fecal N of composite samples is presented only in observations.
Association of Official Analytical Chemist. 1975. Official methods of anal- ysis, 12th ed. Ass. Offic. Anal. Chem., Washington D.C.
Beames, R.M., and J.G. Morris. 1965. Effect of salt/urea blocks on body- weight, body composition and wool production of sheep fed low-protein native grass hay. Queensl. J. Agr. Anim. Sci. 22:369.
Beasley, P.S., and N.P. McMeniman. 1976. The effect of urea molasses supplementation on live weight, wool production and reproductive per- formance of Merino ewes grazing poor quality native pasture. Queensl. J. Agr. Anim. Sci. 33:223.
Dixon, W.J., M.B. Brown, L. Engelman, J.W. Frane, M.A. Hill, R.I. Jennrich, and J.D. Toporek. 1981. BMDP statistical software. Univer- sity of California Press, Berkeley.
Entwistle, K.W., and G. Knights. 1974. The use of urea-molasses supple- ments for sheep grazing semi-arid tropical pastures. Aust. J. Exp. Agr. 1417.
Beames and Morris (1965) reduced body weight losses of ewes receiving pasture hay (0.6% N) by supplementation with salt blocks containing 10% molasses and either 20 or 35% urea. Similarly, Mulholland Coombe (1979) reduced body weight loss with urea- molasses supplements. The favorable responses to supplementa- tion during the second grazing season may be related to either N or energy (molasses) intake. Although responses to molasses-urea blocks have been attributed to the N fraction, Nolan et al. (1975) provided evidence that the reduction in weight loss by sheep was due largely to molasses intake. It is not possible to separate the contribution of N and energy in the present experiments. In addi- tion, the blocks provided minerals which may influence animal performance.
Gartner, R.J.W., and G.M. Murphy. 1972. Blood and fecal parameters of Merino ewes grazing Mitchell grass pastures when supplemented with urea, phosphorus and vitamins. Proc. Aust. Sot. Anim. Prod. 9:241.
Goering, H.K., and P.J. Van Soest. 1970. Forage fiber analysis. USDA Agr. Handbk. 379.
Langlands, J.P., and G.E. Donald. 1978. The nutrition of ruminants graz- ing native and improved pastures. II. Responses of grazing cattle to molasses and urea supplementation. Aust. J. Agr. Res. 29:863.
Lobato, J.F.P., and G.R. Pearce. 19gOa. Responses to molasses-urea blocks of grazing sheep and sheep in yards. Aust. J. Exp. Agr. Anim. Hush. 20:417.
Lobato, J.F.P., and G.R. Pearce. 19SOb. Effects of some management procedures on the responses of sheep to molasses-urea blocks. Aust. J. Exp. Agr. Anim. Husb. 20:422.
The reason for the variation in block acceptance across seasons is not clear. Yearling ewes in the first year were much slower to
Mulholland, J.G., and J.B. Coombe. 1979. Supplementation of sheep grazing wheat stubble with urea, molasses and minerals: quality of diet, intake of supplements and animal response. Aust. J. Exp. Agr. Anim. Husb. 19:23.
Nolan, J.V., B.W. Norton, R.W. Murray, F.M. Ball, F.B. Roseby, W. Robnn-Jones, M.K. Hill, and R.A. Leng. 1975. Body weight and wool production in grazing sheep given access to a supplement of urea and molasses: intake of supplement/response relationships. J. Agr. Sci. (Camb.) %#39!
Nat. Res. Council. 1975. Nutrient requirements of Domestic Animals. No. 5. Nutrient Requirements of Sheep. Fifth Revised Ed. Nat. Acad. Sci. Nat. Res. Council, Washington, D.C.
Pigden, W.J., and D.P. Heaney. 1969. Lignocellulose in ruminant nutri- tion. In: R.F. Gould (Ed), Cellulosesand their Applications. Advances in Chemistry Series 95245.
Satter, L.D.,and R.E. Roffler. 1975.Nitrogen requirement and utilization in dairy cattle. J. Dairy Sci. 58:1219.
Tilley, J.M.A., and R.A. Terry. 1963. A two-stage technique for the in vitro digestion of forage crops. J. Brit. Grassl. Sot. 18:104.
Torell, D.T., I.D. Hume,and W.C. Weir. 1972a. Flushing of range ewes by supplementation, drylot feeding, or grazing of improved pasture. J. Range Manage. 25:357.
Torell, D.T., I.D. Hume, and W.C. Weir. 1972b. Effect of level of protein and energy during flushing on lambing performance of range ewes. J. Anim. Sci. 34:479.
Factors Influencing Selection of Resting Sites
by Cattle on Shortgrass Steppe
R.L. SENFT, L.R. RITTENHOUSE, AND R.G. WOODMANSEE
Abstract
Spatial patterns of cattle resting behavior were investigated on shortgrasssteppe. Resting was divided into daytime and nighttime categories. Sites selected for daytime resting during June through August were low-lying areas, fencelines, and stock-water area. Daytime resting during September through May occurred on south-facing slopes and lowland areas. Degree of use of warm slopes varied from month to month, peaking in midwinter. A significant portion of daytime resting occurred near water (23%) and fencelines (27%) at all times of the year. Resting at night during October through May occurred on south-facing slopes, low-lying areas, sites with sandy soils, and sites with high buffalo grass
(Buchloe dactyloides) cover. During June through September, cattle preferred sites on east-facing slopes and on lowlands. Cattle rested near fencelines less at night than during the day. Patterns of and factors correlated to resting were different from those asso- ciated with grazing activity. Resting behavior was correlated with topographic variables, whereas previous work has shown grazing to be correlated with vegetation variables.
Long-term management strategies for grazing ecosystems should consider animal-landscape interactions. Research has traditionally emphasized livestock grazing and travel behavior (or an artifact such as forage utilization), while ignoring resting or bedding behavior. Distribution of resting is potentially important because sites selected for resting are often sites of nutrient accumulation (Hilder and Mottershead 1963, Gillingham and During 1973). Further, resting is a form of animal maintenance behavior (Arnold and Dudzinski 1978) which occupies up to 50% of activity time.
For management purposes, it is important to know where resting activity occurs and the environmental factors that contribute to observed patterns.
Preliminary research suggested that cattle resting was correlated to abiotic factors, that there was a seasonality to resting distribu- tion, and that factors influencing daytime and nighttime resting were fundamentally different (Senft et al. 1983). These inferences required further investigation because the study area was small (25
Authors are former graduate student and professor, Range Science Department. Colorado State Universitv. Fort Collins 80523. Senft is currentlv at Animal. Dairv. and Veterinary Sciences spartment, UMC 48. Utah State University, Logan 84322.
This project was funded in part by National Science Foundation Grant DEB- 7906009 and the Colorado State University Experiment Station Scientific Series Paper No. 295 I,
The authors thank the Central Plains Experimental Range, USDA-ARS, for their assistanceand cooperation. Theauthors thank M.C. Shoopand W. Pinchak fortheir comments on an early draft of this manuscript.
Manuscript accepted December I I. 1984.
JOURNAL OF RANGE MANAGEMENT 38(4). July 1985
ha) and uniform in terms of vegetation. Time scales used were variable. Work with grazing behavior has indicated that a shift of observational scale may result in the emergence of a new set of predictors (Senft et al. 1983, Senft et al. 1985). Thus, we were interested in 3 questions: are patterns observed on small, uniform pastures applicable to larger, heterogenous areas; does seasonality of cattle resting patterns shift abruptly or gradually; and finally, do patterns of and factors correlated to resting compare with those of grazing?
This paper describes cattle resting behavior on shortgrass steppe in northeastern Colorado. The objectives of this research were to: (I) document spatial patterns of resting behavior on shortgrass range, (2) determine relationships between observed patterns and environmental factors, and (3) build predictive regression models of resting activity.
Methods The Study Area
Research was conducted on the USDA-ARS Central Plains Experimental Range (CPER) in northeastern Colorado. The semiarid climate of CPER has been described in detail elsewhere (Jameson 1969). Mean maximum monthly temperatures for Janu- ary and July are 0.5 and 28’ C, respectively. Mean minimum monthly temperatures for January and July are -12 and 12O C. Average annual precipitation is approximately 3 10 mm, with con- siderable year-to-year variation.
Vegetation is shortgrass steppe, dominated by blue grama [Bouteluoa grucilis (H.B.K.) Lag.] and buffalo grass [Buchloe ductyloides (Nutt.) Engelm]. There is little or no shade or shelter for large animals. Terrain is characterized by gently rolling hills and intermittent drainages. Relief is approximately 25 m. Closed basins, or playas, are common. Plant communities are described elsewhere (Senft et al. 1985).
Cattle resting behavior was studied on a I25-ha pasture (Fig. 1). Topographic features include a ridge running diagonally across the center from northwest to southeast, 2 intermittent drainages lying parallel to the ridge, and a playa lying southeast of the center of the pasture. A grazing exclosure is located in the center of the pasture, and a stock-watering tank and salt block are in the center of the north fenceline (asterisk in Fig. I). Seven to I I yearling heifers freely roamed the study pasture. Herd size was adjusted seasonally to maintain light to moderate stocking, based on available forage.
al
bl
Fig. 1. Resting sites selected by corrle during doylighr: (A) worm season (June rhrough August); (B) cool-season (September through May). Three-m (IO-ft) contour intervals ore shown. Location of the water rank is indicated by on asterisk p).
Behavior Observations and Analysis
Resting behavior was defined as any stationary, nonfeeding activity engaged in by the herd for 30 minutes or longer (e.g., standing, lying, ruminating, sleeping, and social activity). Resting was divided into daytime- and nighttime-resting categories. Rest- ing behavior was observed for 1 week each month over a 2-year period (June 1980 through May 1982). Locations of resting sites were recorded on topographic maps.
To determine which factors influenced resting distribution, data were analyzed using multiple regression techniques (Senft et al. 1983). Maps of the study area were gridded into 0. l-ha cells. Total resting time (h) was summed in each cell for daytime and nighttime categories. Resting time per month was the dependent variable in the analysis. A pool of potential independent variables included topographic factors, frequencies of 22 plant species, and percen- tage cover of the dominant perennial grasses. Values for topogra- phic factors were estimated from an enlarged topographic map (Fig. I). Values for vegetation cover and frequency were obtained
from surveys conducted during the US/IBP Grassland Biome
Study. Predictors of spatial behavior were selected according to the criteria of Senft et al. (1983).
We hypothesized that, on shortgrass steppe, microclimates would be associated with major topographic features or terrain types. Accordingly, the study area was divided into six zones; (I) ridgetops, (2) south-facing slopes, (3) north-facing slopes, (4) low- lands and bottoms, (5) fencelines and fence corners, and (6) the watering area. The watering area was defined as the zone within
100-m radius of the water tank (asterisk in Fig. 1). The fenceline zone included any site within 25 m of a fence or fence corner. Ridgetops included sites above the 1,660-m contour line with slopes less than 5%. The lowlands and bottoms categories con- sisted of lower parts of drainage areas, toeslopes, and low-lying, level areas. North- and south-facing slope categories included sites on northern or southern slopes, respectively, not included in any of the other 4 categories. The smallest area considered a potential resting site was the 0. l-ha grid cell used for mapping and statistical analysis.
Table 1. Breakdown of monthly observed daytime resting by topographic zone (percent of total resting time).
Month Ridgetops
South-facing slopes
Topographic zone North-facing Draws and
slopes Lowlands Fencelines Watering area
June 0.4 5.7 16.8 32.5 25.3 19.3
July 0.2 5.1 11.0 35.3
August 0.0 8.3 9.1 28.5
September 0.0 7.7 13.1 25.2
October 1.5 9.8 12.7 28.2
November 4.1 17.0 8.2 23.8
December 2.9 18.1 2.9 23.8
January 2.2 17.2 3.7 27.6
February 7.5 16.4 8.2 18.2
March 10.9 10.9 9.5 9.5
April 5.8 7.7 13.6 14.6
May 0.3 8.7 20.6 26.8
30.1 37.1 31.5 24.9 26.5 25.7 23.1 25.2 28.5 28.2 25.5
18.3 17.0 22.5 22.9 20.4 26.6 26.2 24.5 30.7 30.1 18.1
June-August
Observed 0.2
Expected 7.2
September-May
Observed 3.9
Expected 6.4
Annual Mean 3.0
Area (%) 8.4
‘Tabular value, Mf, 0.01 level of probability = 15.09.
6.4 12.3 32.1 30.8 18.2
10.8 16.4 30.5 22.7 12.4
12.6 10.2 22.0 26.6 24.7
12.5 16.8 21.5 20.8 22.0
11.0 10.8 24.5 27.6 23.1
29.5 27.2 21.7 11.3 1.9
Chi-square* 15.07
5.53
Results
al
Patterns of Daytime Resting
Locations of observed resting sites are shown in Figure 2. Between 18 and 25% of resting occurred near the stock-watering facility at all times of the year (Table 1). Cattle moved to water in midmorning and frequently remained in the watering area for several hours. Fencelines also received a disproportionate amount of daytime-resting activity, much of which was concentrated in fence corners (Fig. 1).
Daytime use of south-facing slopes peaked in winter, while use of north-facing slopes peaked during summer (Table 1). During summer, cattle spent a substantial portion of the daylight hours standing near, and wallowing in, intermittent ponds. Cattle gener- ally preferred low-lying areas with gentle slopes and avoided upper slopes.
Spatial patterns of daytime resting were described by proximity to the water tank (l/distance), proximity to fence corners, eleva- tion, and aspect (Table 2). The elevation term was expressed as 1.0 divided by elevation(m) above the lowest point in the pasture. The aspect term was expressed as cosine of degrees deviation from due south. The coefficient of the aspect term was a sinusoidal function of time, peaking in January. The time-varying aspect coefficient resulted from seasonal shifts in preference for north- and south- facing slopes. During the warm season (June through August), the aspect term dropped out of the model and the coefficient of the elevation term more than doubled (Table 2). The value of the elevation coefficient was greatest during July.
bl
For behaviors that occur in discrete locations in space, regres- sion models, when used as predictive devices, generate probability distributions of behavior (Senft et al. 1983). Seasonal differences in patterns of daytime resting behavior were reflected in model pre- dictions (Fig. 2). The predicted pattern of summer daytime resting emphasized low-lying sites and the stock-watering facility, exclud- ing a large portion of the study area. During cool-season months, however, a larger array of sites were likely to be used. Predicted patterns of resting were not significantly different @<.Ol) than observed (Table 1).
hours. hectarti’. montti’
Patterns of Nighttime Resting
Locations of bedding sites are shown in Figure 3a. Patterns of bedding were very similar throughout the year (Table 2). Use was primarily in the low-lying areas of the pasture, especially on channels
of
intermittent drainages and on lower slopes; no bedding sites were observed on ridgetops. Some bedding occurred along fencelines, particularly in corners; but the amount of fenceline use was less at night than during daylight hours.I
<’
; ..
‘... .: . . ..I : 5-15 I-5 m >I5Fig. 2. Probability distributions of daytime resting generated by season- al regression models. (A) Warm season. (B) cool season.
south-facing slopes. During the remaining 4 months of the year (the warm season), 48% of bedding activity occurred on east-facing slopes and only 30% on south-facing slopes.
TO isolate the influence of aspect on bedding-site selection, we divided the study area into 4 zones, each centered on a different
Six independent variables were required to describe spatial pat- cardinal direction (Table 4). From October through May (the cool
terns of nighttime resting (Table 5). These were: proximity to fence season), an average of 60% of all nighttime resting occurred on
corners, percent slope, aspect (2 seasonal variables), frequency of a soil texture indicator, spreading buckwheat (Erigonum effisum Table 2. Coefficients in the seasonal daytime resting models.
Season
Proximity to water
Proximity to fence corners
Independent variable
Elevation Aspect Constant r
Warm
(JuneeAug) 4 16.45 157.71 II.25 -I .89 ,426
Cool
(Sept-May) 408.80 106.60 5.34 k4 -1.51 ,555
Mathematical
expression in model* I - I - 1 cos(x4) C
Xl X2 X3
*XI q distance from stock tank (meters)
x2 = distance from nearest fence corner (meters) xa = elevation above 1646 m contour (meters) kr = 0.600 (cos(0,5236(month-12))
XI = degrees deviation from due south
al
bl
hours. hectard’. mod
1-5
Fig. 3. (A) Resting sires selecred at night: wartn season (June through Seprember) sites are indirared by solid dots; cool-season (October through May by open circles. (B) Probability distribution of resting ar night.
Table 4. Breakdown of observed monthly nighttime resting time by aspect (percent of total resting time)
Month
June through September Mean
October through May Mean
Annual Mean
Area (%)
North- facing
8.9
8.9
8.9
29.2
Exposure
East- South- facing facing
48.1 30.0
23.5 59.6
31.7 49.7
26.6 36.2
West- facing
13.0
8.0
9.7
8.0
Nutt., or Eref), and percent buffalo grass cover. Each predictor had a time-varying coefficient, suggesting seasonal shifts in the tactics of site selection. The predicted annual pattern of nighttime resting is shown in Figure 3b. (Resting patterns predicted by cool-and warm-season models were combined, as the differences in seasonal patterns were not pronounced).
Predicted and observed seasonal bedding breakdowns are shown in Table 3. The chi-square value for the cool-season model was the result of over- or underprediction of behavior time for relatively small areas. The cool-season model underpredicted use of the watering area and overpredicted use of fencelines. Predicted cool-season use was accurate for the remaining 90% of the study area.
Discussion
Relation to Grazing Patterns
Distribution of resting differed from distribution of cattle grazing. While resting was primarily correlated to topographic variables, cattle selected grazing areas on the basis of relative forage abundance (Senft et al. 1985). Drainage channels and adjacent plant communities were preferred during the growing season (April through October); upland plant communities were preferred during the dormant season. A wide zone around the watering area received concentrated grazing and resting in all
Table 3. Breakdown of monthly observed nighttime resting (bedding) time by topographic zone (percent of total resting time).
Topographic Tone
South-facing North-facing Draws and
Month Ridgetops slopes slopes lowlands Fencelines Watering area
June 0.0 46.4 14.3 10.7 28.6 0.0
July 0.0
August 0.0
September 0.0
October 0.0
November 0.0
December 0.0
January 0.0
February 0.0
March 0.0
April 0.0
May 0.0
June~September Observed 0.0
Expected 0.0
OctoberrMay
Observed 0.0
Expected 0.0
Annual Mean 0.0
-
Area (%) 8.4
*Tabular value. 4df. 0.01 lecel of probability = 13.28.
298
31.4 17.2
31.4 22.9
16.7 31.3
13.3 31.7
24.4 29.3
45.5 12.1
45.0 7.5
38.7 16. I
37.5 20.8
51.9 10.5
77.8 5.6
31.5 21.4
32.7 15.0
42.5 16.7
32.7 15.0
38.8 18.4
29.5 27.2
20.0 31.4 0.0
25.7 20.0 0.0
35.4 8.3 8.3
35.0 5.0 15.0
26.8 4.9 14.6
15.2 15.1 12.1
15.0 17.5 15.0
25.8 9.7 9.7
41.7 0.0 0.0
31.6 0.0 0.0
5.6 I I.0 0.0
Chi-square
23.0 22.0 2. I
34.5 14.9 2.9 Il.38
24.6 17.9 8.3
34.5 14.9 2.9 19.31
24.0 12.6 6.2
21.7 I I.3 1.9
seasons, but a fouled zone immediately surrounding the water tank (radius = 60 m) was not grazed. Cattle displayed no measurable preference for grazing fencelines or fence corners.
Grazing and resting patterns were partially dependent. Midnight grazing invaribly occurred in the immediate vicinity of bedding sites. During the course of the night, the resting site often “drifted” as cattle got up, grazed, and selected new bedding sites a short distance away. During the daylight hours, however, cattle walked to and from resting sites. Searching for desirable resting sites was especially evident in the interval between the late afternoon grazing period and bedding. Cattle traveled more while grazing during this period than at any other time of day.
Resting and Comfort Seeking
Behavioral thermoregulation may have been one of many
factors influencing selection of resting sites. Since shade and shelter were absent from the study area, cattle would have to exploit micro-climates associated with topography. Our results indicated daytime use of cool exposures during summer and warm exposures during winter. Cattle may have selected nighttime resting sites on the basis of surface heat exchange properties. Spreading buckwheat, for example, is an indicator of sandy soils, which lose heat more rapidly than fine-textured soils. Buffalo grass mats, which were highly preferred during winter, may have been used for insulation against cold soil. Other aspects of comfort-
seeking behavior are use of (or escape from) wind and escape from insect harassment. Summer use of slopes may have been related to wind (Weaver and Tomanek 1951). The only sites not affected by wind were sink holes. Cattle were observed resting in these holes on cold, windy days.
Literature Cited
Arnold, G.W., and M.L. Dud&ski. 1978. Ethology of free-ranging domestic animals. Elsevier Sci. Pub]. Co., New York.
Gillingham, AX., and C. During. 1973. Pasture production and transfer of fertility within a long-established hill pasture. N.Z. J. Exp. Agr.
1~227-232.
Hilder, EJ., and B.E. Mottershead. 1%3. The redistribution of plant nutrients through free-grazing sheep. Austr. J. Sci. 26:88-89.
Jameson, D.A. 1969. General description of the Pawnee Site. USjIBP Grassland Biome Tech. Rep. No. 1. Colorado State Univ., Fort Collins. Senft, R.L., L.R. Rittenhouse, and RX. Woodmansee. 1983. The use of
regression models to predict spatial patterns of cattle behavior. J. Range Manage. 36553-557.
Senft, R.L., L.R. Rittenhouse, and R.G. Woodmansee. 1985. Factors influencing patterns of cattle grazing behavior on shortgrass steppe. J. Range Manage. 38:82-87.
Forage Use by Cattle and Sheep Grazing Separately
and Together on Summer Range in Southwestern
Utah
-
G.B. RUYLE AND JAMES E. BOWNS
Abstract
Grazing trials were conducted on high elevation summer range in southwestern Utah, with cattle and sheep stocked separately and together in .4-ha paddocks. Vegetation measurements were taken before and after grazing treatments to quantify vegetation utiliza- tion as measured by several sampling techniques. Sheep removed less grass and more forbs and shrubs than cattle. Cattle showed a strong reluctance to browse mountain snowberry (Symphoricar- pos oreophilus Gray) even when herbaceous forage was greatly
reduced. In the common use grazing treatments, all 3 forage cate- gories were well utilized. Cattle and sheep grazing together used more forage, especially mountain snowberry, than calculated from single use averages.
Summer rangelands in southwestern Utah are an integral part of the local livestock production system and have been grazed almost exclusively by domestic sheep for decades. The extensive and heavy sheep grazing induced a general shift in the herbaceous vegetation from what was probably a tall forb-grass community to a grass dominated community. Despite these vegetation modifica- tions, sheep continue to be the major livestock species on Cedar
Authors are research assistant and professor, Range Science Department, Utah State University, Logan 84322. Ruyle is now range management specialist and assist- ant professor, School of Renewable Natural Resources, University of Arizona, Tuc- son 85721.
The authors wish to thank Calvin Bagley, Kent Hughes, and Kevin Schoppmann for assistance in the field. A special thanks goes to Darrell Mathews for use of the livestock used in the grazing trials.
The report was submitted as Utah Agriculture Experiment Station journal paper 2934.
Manuscript accepted November 29, 1984.
JOURNAL OF RANGE MANAGEMENT 38(4), July 1985
Mountain in Iron County, Utah, the location of the study area. Sheep are well suited to vegetation containing a mixture of grasses, forbs, and shrubs, and they use all 3 forage categories. Some of the coarse grasses are often left ungrazed, however, and therefore increase in abundance. Letterman needlegrass (Szipa
lettermanii Vasey) has done just that on much of the mountain range in southern Utah. On the other hand, an increase in shrubs may follow prolonged, heavy, cattle grazing. Common use by cattle and sheep may result in more efficient range management and improved range condition by balancing forage demand.
Much has been written about common use of mountain ranges, but few studies have been conducted to compare the diets of cattle and sheep when stocked in common on mountain rangeland. In northern Utah, sheep grazing alone consumed significantly more forbs and browse than did cattle grazing alone or sheep and cattle grazing together (Cook et al. 1967).
Schlundt (1980) reported similar results from a study in southern Utah. He found that grasses were removed from pastures grazed by sheep and cattle alone at a rate similar to that of pastures grazed in common by cattle and sheep. Forbs were less used by cattle than were the grasses. Mountain snowberry was browsed to a greater degree by sheep than by cattle. Additionally, shrub use in the common-use pasture was higher than predicted from single-use stocking rates.
Common use is best applied where there is a mixture of grasses, forbs, and shrubs (Heady 1975). Animal behavior, topography, the availability of livestock water, and personal preferences of the