i
EVALUATION OF APICULTURE IN THE CONTEXT OF FOOD
SECURITY AND ENVIRONMENTAL MANAGEMENT IN
KATHONZWENI DIVISION, MAKUENI COUNTY, KENYA
MUTUA CAROLINE NZULA N50/CE/11401/2008
A RESEARCH PROJECT SUBMITTED IN PARTIAL FULFILMENT FOR THE DEGREE OF MASTER OF ENVIRONMENTAL STUDIES
(COMMUNITY DEVELOPMENT) IN THE SCHOOL OF ENVIRONMENTAL STUDIES OF KENYATTA UNIVERSITY
ii
DECLARATION
This project is my original work, and has not been submitted for a degree or any other
award in any other university.
Signature--- Date---
Caroline Nzula Mutua
Supervisors
This project has been submitted for examination with our approval as university
supervisors.
Dr. Jane Mutinda
Signature--- Date---
Department of Environmental Studies and Community Development, Kenyatta
University
Prof. Fuchaka Waswa
Signature --- Date---
iii
DEDICATION
To my beloved mother Jane Muthuka, my beloved late father Bernard Muthuka, my
husband Martin Mutula, my son Andrew Mutula and my daughter Tressie Mutindi.
iv ACKNOWLEDGEMENT
Special thanks go to all those who immensely contributed to this project in one way or
the other. I first acknowledge the support and guidance from my competent
supervisors, Dr Jane Mutinda and Prof. Fuchaka Waswa, without whom this study
would not have come to a successful conclusion. Their comments, suggestions, and
constructive criticism throughout the entire period of my study are highly appreciated.
I also acknowledge the tremendous role played by all respondents in Kathonzweni
division for voluntarily providing the vital information during interviews. I too
acknowledge the much support extend to me by Mr Kagio and Mr. Kamau of Egerton
University during honey quality analysis. Special thanks to my good friend and
coursemate Margaret Okumu for her constant encouragement to complete this study.
v
TABLE OF CONTENTS
DECLARATION... i
DEDICATION... iii
LIST OF TABLES ... viii
LIST OF FIGURES ... ix
DEFINITION OF TERMS...x
ABSTRACT ... xii
CHAPTER 1: INTRODUCTION ...1
1.1 Background to the Study ...1
1.2 Problem Statement and Justification ...3
1.3 Objectives of the Study ...4
1.4 Research Questions ...4
1.5 Significance of the study ...4
1.6 Conceptual framework ...5
CHAPTER 2: LITERATURE REVIEW...6
2.1 The emerging Issues on Food Security ...6
2.2 Status of Food Security in Makueni County ...8
2.3 Overview of Apiculture for Rural Development in Africa ...10
2.4 Adoption of Apiculture in Kenya ...11
vi
2.7 Summary of Knowledge Gaps ...17
CHAPTER 3: RESEARCH METHODOLOGY ...18
3.1 Study Area ...18
3.2 Research Design ...19
3.3 Sample Size and Sampling Procedures ...19
3.4 Data Collection Methods ...20
3.4.1 Questionnaires ...20
3.4.2 Key Informant Interviews ...20
3.4.3 Focus Group Discussions ...21
3.4.4 Participatory Transect Survey ...21
3.5 Data Analysis Methods ...21
3.5.1 Questionnaire Data ...21
3.5.2 Focus Group Discussion and Key Respondent Data ...22
3.5.3 Participatory Transect Survey Data ...22
3.5.4 Sampling and Analyzing On Farm Honey Quality ...22
3.6 Validity and Reliability of Instruments ...25
3.7 Ethical Considerations...26
CHAPTER 4: RESULTS AND DISCUSSION ...27
4.1 Introduction ...27
vii
4.3 Demographic Information of Respondents ...27
4.3.1 Gender and Age Bracket of Household Heads ...27
4.3.2 Level of Education...29
4.3.3 Length of residency in the Division ...31
4.4 Extent to which Apiculture is practiced in Kathonzweni Division ...32
4.5 Contribution of Apiculture to Food Security ...33
4.6 Challenges facing the adoption of apiculture ...38
4.8 Honey Quality Analysis Results ...45
CHAPTER 5: SUMMARY, CONCLUSIONS AND RECOMMENDATIONS ..50
5.1 Summary of Findings ...50
5.2 Conclusions ...53
5.3 Recommendations………...55
5.4 Suggestions for further research ...56
APPENDICES ...63
Appendix 1: Questionnaire for household heads ...63
Focus Group Discussion Guide ...68
Key Informant Interview Questions ...69
Appendix 2: Table on Sample Sizes ...70
viii
LIST OF TABLES
Table 3.1: Sampling Frame for the study... 19
Table 4.1: Cross-tabulation between the marital status of women and the reasons for
bee keeping ... 29
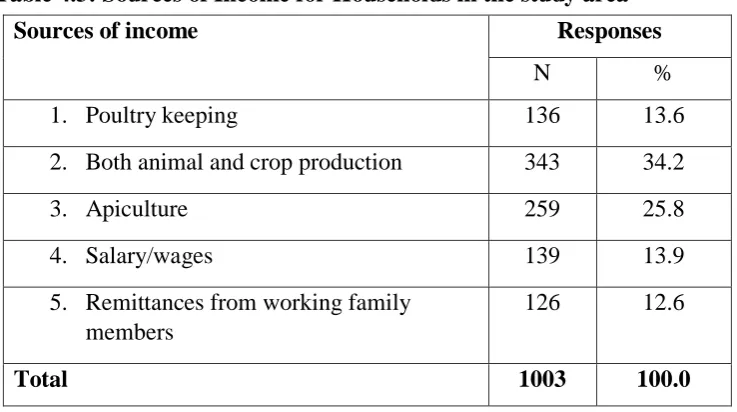
Table 4.3: Sources of Income for Households in the study area ... 32
Table 4.4: Yearly quantity of honey harvested, sold and the income generated ... 34
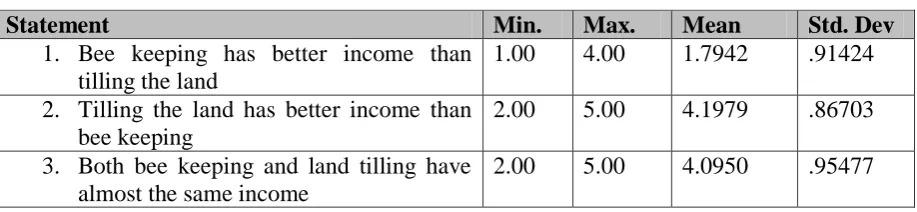
Table 4.5: Comparisons between bee keeping and land tilling as income sources …. 35
Table 4.6: Cross tabulation between sources of Household income and total monthly
earning... 36
Table 4.7: Reasons why farmers practice apiculture ... 37
Table 4.8: Challenges Facing Apiculture in Kathonzweni Division ... 39
Table 4.9: Strategies for improving Apiculture in Kathonzweni Division (N=379) ... 44
Table 4.10: Summarized results from qualitative analysis of ten honey samples ... 45
Table 4.11: Results of Physicochemical Analysis of Kathonzweni honey (N=10) ... 46
ix
LIST OF FIGURES
Figure 1.1 Food security conceptual framework………...…….…………5
Figure 3.1: Location of Study Area ... 18
Figure 4.1: Household Heads Distribution by gender and age bracket ... 28
Figure 4.2: level of education of household heads ... 29
Figure 4.3: Period of residency in the Division ... 31
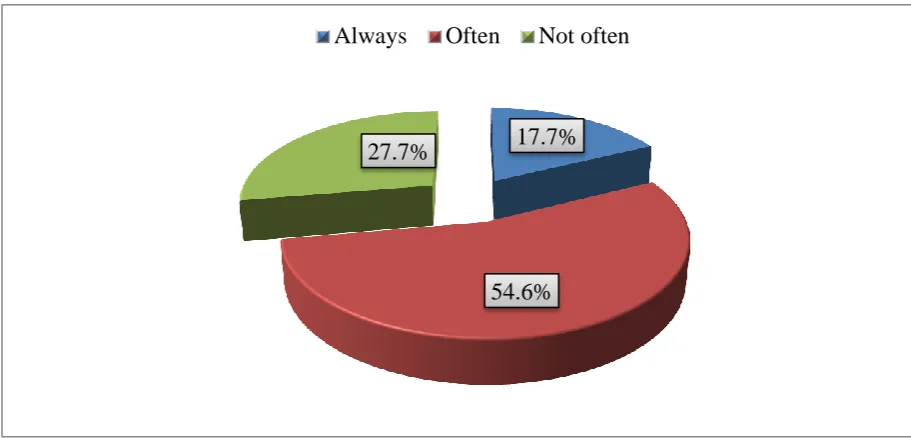
Figure 4.4: Frequency of Food Insecurity in Kathonzweni Division ... 34
Figure 4.5: Reasons why some farmers do not practice apiculture ... 41
Figure 4.6: Size of land (in hectares) owned by households ... 42
x
DEFINITION OF TERMS
Food security- exists when all people, at all times, have physical and economic
access to sufficient, safe and nutritious food that meets their dietary
needs and food preferences for an active and healthy life”
Environmental management- is organizing different environmental initiatives to
address various ecological issues that are affecting the
globe.
Biodiversity- is the variety of all living things; the different plants, animals and
microorganisms, the genetic information they contain and the
ecosystems they form.
A household- consists of one or more people who live in the same dwelling and also
share meals.
Dry lands- are characterized by a scarcity of water, which affects both natural and
managed ecosystems.
Deforestation-is the permanent destruction of forests in order to make the land
available for other uses.
Afforestation-the act or process of establishing a forest especially on land not
previously forested
Honey- is a sweet product made from flower nectar, combined with an enzyme
secreted by honey bees, then concentrated by reducing moisture in the
xi
ABBREVIATIONS AND ACRONYMS
AOAC Association of Analytical Communities
CBO Community Based Organisation
FAO Food and Agricultural Organization
FEWS NET Famine Early Warning Systems Network
IFAD International Fund for Agriculture Development
IHC International Honey Commission
KARI Kenya Agricultural Research Institute
KIHBS Kenya Integrated Household Budgetary Survey
KNBS Kenya National Bureau of Statistics
KSHS Kenya Shillings
NGO Non- Governmental Organization
PDNA Post Disaster Needs Assessment
SRA Short Rains Assessment
xii ABSTRACT
1
CHAPTER 1: INTRODUCTION
1.1 Background to the Study
The world produces adequate food to feed all the people with at least 2,720
kilocalories per day, which is above the Food and Agriculture Organization of the
United Nation‟s (FAO‟s) required minimum of 2250 kilocalories per day (FAO,
2003a). Ironically food shortage is globally common and severely high (FAO, 2006).
In 2003, the FAO estimated that there were 842 million underfed people globally: 798
million (95 %) in the third world, 10 million in industrialized countries and 34 million
in countries in transition. In sub-Saharan Africa, the number of underfed people has
been growing: from 169 million in 1992 to 206 million in 2003. Three-quarters of
those underfed stay in rural areas, those who have been displaced by civil war and
also those who earn their living from dry lands (FAO, 2003a; 2006).
Africa and the whole world are faced with two main challenges in the 21st century.
The first challenge is how to provide food to the increasing population and the second
is how to adjust to the changing climate (Seiler, 2013). In 2003, FAO estimated that
there were 842 million people worldwide face with acute food shortage: with 798
million (95%) in the third world, 10 million in industrialized countries and 34 million
in countries that are undergoing transition. In sub-Saharan Africa, the number of food
insecure people has been growing from 169 million in 1992 to 206 million in 2003.
Sub-Saharan Africa is the region with the highest occurrence of food shortage in the
world at 23.2% (FAO, 2015). The dry lands of Kenya make over 75% of the country‟s
land mass. These dry lands make the least developed parts of the country where
household food shortage is common and acute. It is therefore important to find
sustainable ways to solve the recurring food shortage problem in these dry lands.
The situation of food in Kenya is an issue of great concern with trends showing an
ever increasing demand for food accompanied by a less proportionate increase in food
supply. Whereas some regions do not commonly experience food shortage problems,
famine and food insecurity are common in other regions of the country. Agriculture is
the major economic activity which most of rural people depend on for agricultural
2
Food security cannot be achieved without stable income (Koirala and Thapa, 1997).
Apiculture is one of the good practices that have been known to better livelihood of
poor farming people without much cost (Baptist and Punchihewa, 1983). Apiculture is
possible in dry areas and other areas where food crop farming have not succeded
(Bradbear, 2002).
Apiculture is the science of bee keeping. Beekeeping contributes to food security,
poverty reduction, employment creation and income generation in not only in the arid
and semi-arid areas in Kenya but in majority of the sub-Sahara Africa rural areas
(Abellán, 2002). Apiculture in Kenya is majorly practiced in ecological areas where
chances for crop farming are limited and the natural vegetation is made up of many
plants varieties suitable for bees to collect nectar from (Nightingale, 1976). The areas
most affected are among the 80% arid and semi-arid lands which include
Kathonzweni division. Beekeeping offers direct and indirect benefits to the rural
people. Directly, beekeeping subsidizes household income from hive product sales,
provides food, safe medicines and raw materials for industries. These income benefits
have been reported to have high impact among marginalized and small income
earners such as women, orphans and other vulnerable groups within the society.
Indirectly, beekeeping contributes to water shed-management, forest conservation and
crop pollination. In their studies, Chaplin-Kramer, Dombeck (2011) found that bees
are responsible for one third of food crops planted and produced by humans.
Honeybee pollination improves quality, quantity and market value of food crops.
Maurice (2006) argues that beekeeping can help to conserve environment mainly in
three interconnected ways: increasing the number of honeybees in an area should
improve the pollination success of numerous flowering plant species; the income
generated from beekeeping can help to alleviate pressure on the local resource base;
and there is a potential to alter the way the people view their local environment. With
all the above benefits, it is believed that beekeeping can improve living standards of
3 1.2 Problem Statement and Justification
In recent times, Kenya has been having serious food shortage challenges, especially in
dryland areas. These are shown by a high number of the population not having
accessibility to food in the right quantity and quality (GoK, 2011). The food
insecurity problem cuts across to regional levels where agricultural potential is
lowered and leads to into famines in the dry land ecosystems. (Muyanga, 2004).
In an attempt to combat global food insecurity situation and ensure environmental
conservation, the United Nations General Assembly in 2015 made resolutions to
finish food shortage, have food security and better nutrition, encourage reliable
agriculture, take urgent action to combat climate change and its impacts and stop and
reclaim degraded land and stop the loss of biodiversity. The Kenyan government, in
its Vision 2030, also targets to transform Kenya into “a new industrialized middle
income country by providing a high quality of life to all its people in a clean and safe
environment”.
The achievement of these goals is largely pegged on the agricultural sector. The sector
contributes directly 24% of the Gross Domestic Product (GDP) and 27% of GDP
indirectly through manufacturing, distribution and other service similar sectors.
However, even with these realizations, the World Bank (2014) observes that, an
almost total dependence on crop and livestock farming in dryland environment makes
households not able to withstand any external shock like drought. There is therefore
need to identify and adopt sustainable and environmental friendly agricultural
practises, especially in dry lands of Kenya and elsewhere. Bee keeping with its
proven income viability, environmental conservation and nutritional cum medicinal
benefits are a sustainable alternative in Kathonzweni division with a range of drought
resistant trees and many annual crops that give honey flora all year round.
Kathonzweni division is a dryland in Kenya that experiences low food security due to
over dependence on crop farming and unreliable rainfall. Apiculture is a practice that
does not depend on rainfall and thus the households in the division may improve their
food security and improve the environment by practicing it. This study therefore
aimed at evaluating how adoption of apiculture could be increased for food security
4 1.3 Objectives of the Study
The overall objective of this study was to determine the measures of enhancing
adoption of apiculture given its potential and proven profitability in order to increase
food security and environmental management in Kathonzweni division of Makueni
County. The specific objectives were as stated below:
i. To assess the extent to which apiculture is practiced by households
ii. To determine the relative contribution of apiculture to food security and
environmental conservation
iii. To examine the challenges facing the adoption of apiculture
iv. To assess the measures that need to scale-up adoption and sustainance of
apiculture
1.4 Research Questions
From the research objectives above, the following research questions were
formulated:
i. To what extent is apiculture practised by households and individuals in
Kathonzweni division, Makueni County?
ii. Has apiculture contributed to improved food security and environmental
conservation in Kathonzweni division, Makueni County?
iii. What are some of the challenges facing the adoption of apiculture in
Kathonzweni division, Makueni County?
iv. How can adoption of apiculture be scaled-up in the study area?
1.5 Significance of the study
The findings of this study may assist the residents of Kathonzweni division to
diversify their livelihoods from crop farming that is regularly limited by adverse
climate to apiculture which requires less land and water as inputs. The reduced
pressure on land by not crop farming will lead to environmental recovery through
reduction in land degradation and conservation of biodiversity. Bee keeping
contributes to watershed management, forest management and crop pollination as it
requires planting of trees and minimal soil disturbance. Increased and predictable
5 1.6 Conceptual framework
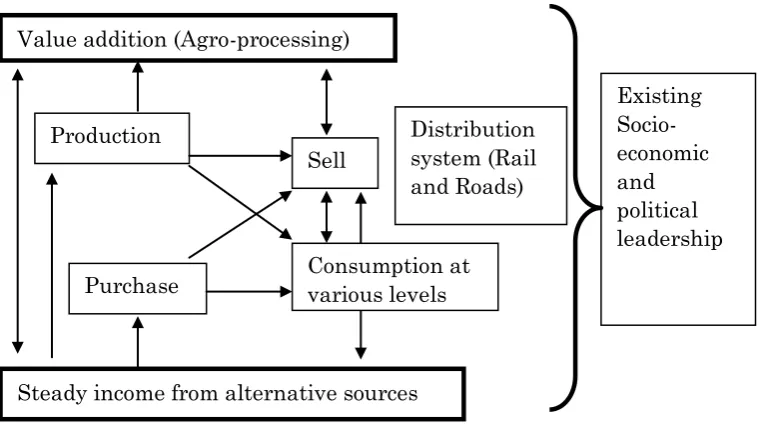
This work will be based on the framework described by Waswa et al (2014) but
specifically use apiculture to address the aspect of contributing to steady supply of
income from alternative non-tillage sources. In terms of improved environmental
conservation, apiculture is a remedy against land degradation, cutting down of trees
and loss of plant/animal variety among other challenges.
Figure 1.1 Food security conceptual framework Source; Adopted from (Waswa, 2014)
Having sufficient income from honey sales can contribute to food security by
purchasing food from elsewhere rather than forcing output under adverse climatic
condition that are typical for dry land ecosystems. Apiculture does not dependent on
rains unlike tillage farming. Production
Sell Value addition (Agro-processing)
Purchase
Distribution system (Rail and Roads)
Existing Socio-economic and political leadership Consumption at
various levels
6
CHAPTER 2: LITERATURE REVIEW
2.1 The emerging Issues on Food Security
The world produces adequate food to feed all the people with at least 2,720
kilocalories per day, which is above the Food and Agriculture Organization of the
United Nation‟s (FAO‟s) required minimum of 2250 kilocalories per day (FAO,
2003a). Ironically food shortage is globally common and severely high (FAO, 2006).
In 2003, the FAO estimated that there were 842 million underfed people globally: 798
million (95 %) in the third world, 10 million in industrialized countries and 34 million
in countries in transition. In sub-Saharan Africa, the number of underfed people has
been growing: from 169 million in 1992 to 206 million in 2003. Three-quarters of
those underfed stay in rural areas, those who have been displaced by civil war and
also those who earn their living from dry lands (FAO, 2003a; 2006). In recent years,
Kenya has been having acute food shortage challenges. These are shown by a high
number of people having no accessibility to food in the right quantities and quality
(GoK, 2011).
Current food shortage challenges can be as a result of many factors such as repeated
droughts in most parts of the country, high costs of producing household food,
displacement of many farmers especially those in fertile agricultural areas and high
worldwide food prices due to low buying power for much of the population as a result
of high due to high poverty levels. Thus, more than 10 million people face acute food
shortage (Republic of Kenya 2011; FAO 2011; Republic of Kenya 2008). Kenya‟s
2011 National Food & Nutrition Security Policy show that in the past 30 years, per
capita food availability had gone down by more than 10% (Republic of Kenya, 2011).
In Makueni County, the impact of the drought on agricultural production has been a
key factor in the escalating food insecurity. Consecutive failed rainy season‟s results
in failed harvests, thereby reducing local food production and disrupting local market
7
Africa ensures food supply through local food production and food import. West
Africa for example survive on 40% on imports in ensuring adequate rice supply with
Thailand as the major rice supplier (FAO, 2010).The net amount of cereal imports in
Africa was about 66 tons in 2010 (FAO, 2013a). This means that in the whole of
Africa, 39% of its cereals fed on in 2010 were bought overseas. Despite local food
production and import efforts, there were 239 million underfed people living in the
African continent in 2012 majority of them in Sub Saharan Africa (FAO, 2012). This
indicates that food shortage is now of increased importance. Sub Saharan Africa is the
area with the highest number of underfed people in the world at 23.2% (FAO, 2015).
Reducing food shortage and malnutrition is a major problem for most of the third
world countries. Kenya is one of the African countries where millions of people are
underfed (FAO, 2013).
The causes of food shortage are very many and interconnected, but poverty is the
major driver not only in Kenya, but globally. One way of decreasing food shortage is
by bettering the agriculture sector. Agriculture is the backbone of Kenya‟s economy
with over 80% of its people especially those staying in rural areas deriving their
means of living mainly from agricultural practises (KARI, 2013). According to FAO
Stat (2009), the average person in Kenya consumes 2155 kilocalories of food each
day. Of this, 1183 kilocalories (55%) are from staple foods which include maize,
wheat, beans, potatoes, plantains and rice. Kenya is classified by the Food and
Agriculture Organization as a low income and food deficit country (FAO, 2006). It is
among the one third of African countries whose availability of food is such that an
average daily caloric availability is below the recommended level of 2100 kilocalories
(FAO, 2006). The country has been having severe food shortage as a result of lowered
cereal production, livestock diseases, rising food prices and scarce rainfall.
The food shortage status was declared a national disaster in early January 2009 and
May 2011 indicating about 10 million people were suffering from serious food
shortage (GoK, 2009). The food shortage problems being faced by households in
Kenya‟s dry lands is as a result of poor weather conditions and institutional inability
8
Food availability is limited by lack of enough resources for production while access is
challenged by limited non-farm employment (Muyanga, 2004). Food security in
Kenya is closely tied to local agricultural production, the effect of poverty on access
to food and basic services, population dynamics, changing climatic patterns and
change in demographics (FEWS NET, 2013).
Agricultural production in Kenya is almost totally dependent on rainfall and many
farmers are vulnerable to unreliable rainfall and long spell of drought. With climatic
change, droughts are likely to occur more frequently and at a higher intensity (FEWS
NET, 2010). Drought is the major cause of food insecurity (GoK, 1986; Tiffens,
2002); in addition to inappropriate policies of the government (Kimenyi, 2002;
Nyangito et al., 2004) shown by institutional poor performance and economic
challenges. Aridity in Kenya has always been a problem to food production.
According to a government report (GoK, 1986), only 7% of Kenya has enough and
reliable rainfall, soil and topography good for crop production. An additional 5% can
sustain crops in years of adequate rainfall while the remaining (88%) makes the dry
lands.
2.2 Status of Food Security in Makueni County
The Makueni County in Kenya is found in the arid and semi-arid regions which are
characterized by erratic rainfall (ACF-USA, 2012). Makueni County has for most part
of the seasons been characterized as being in the emergency phase classification with
the availability of basic necessities such as food and water varying greatly as a result
of indeterminable changing climatic conditions, which have affected food security,
water availability and the livelihood coping options for majority of the vulnerable
households (Ombis, 2013). The patterns of food production in Makueni County are
characterized by considerable seasonal fluctuations which contribute to widespread
food shortages in most households. The overall rainfall performance in the county has
been erratic over the past several successive rainfall seasons, which in return affects
all livelihood zones, because the county and surrounding regions primarily rely on the
short rains season, which have previously been more reliable in terms of their amount
9
According to Ombis (2013), 86.1% of the households in Makueni County do not have
sufficient food during a drought, while 13.9% of the households do have food. In the
county, the factors affecting food security depend on both the agro climatic and
socio-economic conditions, the factors also include the ability to get food rather than the
production of food.
In Makueni County, the food contribution at the household level stands at Maize –
77%, Kales – 3% and Beans – 20%. The main sources of income at the household
level include French beans, kales and bananas, whereas in the mixed farming areas,
the main crops grown are maize and beans in order of importance. Tomatoes, kales
and onions are also grown under small scale horticulture type of irrigation farming.
The area under irrigation usually increases at the onset of a good projected rainfall
performance, because the expectation is the good season provides for an equally good
recharge of the natural water sources though this is not usually the case during a failed
season (Short Rains Assessment, 2013). Maize is the highest contributor to food in the
county at 77%, followed by beans at 20 percent and pigeon peas and mangoes at 3
percent each. Maize, mangoes and citrus fruits contribute 58%, 20% and 10% of
household cash income respectively. The major livestock types in Makueni County
are cattle, goats and sheep; whose production include meat, milk, hides, skins and
other by-products all of which contribute to the household income. This sector is
usually affected by water scarcity and poor forage conditions during dry seasons,
forcing communities to use crop residues as livestock feeds (Behnke and Muthami,
2011).
In Makueni County, the impact of the drought on agricultural production has been a
key factor in the escalating food insecurity. Consecutive failed rainy season‟s results
in failed harvests, thereby reducing local food production and disrupting local market
systems. Previously, farmers grew their own food and did not rely on the purchase of
staple food supplies in the market (David, 2006). This calls for alternative sources of
income which are less dependent on rainfall, and which contribute to the protection of
vegetation cover. Apiculture is a perfect example of such venture. Apiculture does not
require the use of soil directly and it can be a way of living for people with little or no
10
Moreover, it is viewed as one of the cheapest agricultural activities, and one that
offers employment easily (FAO, 1986). Consequently, apiculture is frequently
promoted as an income-generating activity for the poor because it is easily accessible
to marginalized people of local people. Policies and strategies therefore need to be
formulated and implemented on how apiculture can be promoted to safeguard food
security and environmental conversation.
2.3 Overview of Apiculture for Rural Development in Africa
Apiculture is the science of beer keeping and brings income and food security by
providing honey, beeswax and pollen as food and propolis, bees‟ venom and royal
jelly in medicine apart from pollination services. Honey is a natural sweet tasting
substance produced by bees from the nectar. Honey bees collect nectar, change it and
combine with their own specific substances, store and leave it in the honey combs to
mature (FAO, 2004; Codex Alimentarius Commission, 2001). Honey is the major and
basic product of bee-keeping both quantitatively and economically (FAO, 1996).
Bee-hive products have been used by human being for centuries as bee brood which is
traditionally taken as a high protein food while beeswax has been used in making of
candlewax. Beekeeping therefore is depended upon by millions of people in
Sub-Sahara Africa (Gidey and Mekonen, 2010). Bee keeping as a business has improved
the livelihoods of so many groups of people and individuals in the world. For
example, apiculture is a long practiced economic activity in the rural areas of Ethiopia
and is as old as history of the country (Ayalew and Gezahegn, 1991).
Apiculture is an ecologically friendly and a non-farm business activity that has very
high contribution to the economies of the society and to a national economy as well.
Beekeeping can be practiced together with other agricultural activities like crop
production, animal keeping, horticulture and natural resource conservation. The
contributions of apiculture to reduction of poverty, sustainable development and
conservation of natural resources have been well known and supported by the
government and non-governmental Organisation in Ethiopia. Ethiopia is a major
honey and beeswax producing country in the world. The collection and selling of
11
The country leads in production of honey and beeswax in Africa (Gezahegne, 2012).
Globally, Ethiopia is the fourth largest producer of beeswax and the 10th largest
producer of honey. Apiculture in south western Ethiopia provides its low income
population with an opportunity to supplement their income by selling of harvested bee
products like honey and beeswax at a good market (Gallmann and Thomas, 2012).
2.4 Adoption of Apiculture in Kenya
In Kenya, scientific studies on adoption of farm technology majorly investigated
crop, soil and water conservation and dairy technologies (Million and Belay, 2004)
with less regard to beekeeping technology adoption, (Melaku, 2005). Apiculture in
Kenya is majorly practiced in areas where chances for growing crops are limited and
the natural vegetation is made up of many types of plants good for bees to for bees to
suck nectar from (Nightingale, 1976). Honey production in Kenya is done mostly
through traditional ways like the use of log hive technology (Nightingale, 1976).
Apiculture can be practised very well in 80% of the country and is very suitable in
arid and semi-arid areas where crop farming is difficult unless under irrigation.
Traditional apiculture practice in Kenya has a long history with a variety of bee hives
being used in different parts (Nightingale and Crane, 1983). The hives are classified
12
However, many of bee farmers in Kenya still use traditional methods of bee keeping
which is majorly hollow log hives (Caroll, 2006). These hives make the highest
number of bee hives in the country at about 1,273,000 constituting 73% of all the bee
hives in the country (Muya, 2004). Apiculture with modern bee hives is quite new,
having been introduced in the 1950s by the colonial government and later promoted
by the Kenyan government and other development partner (Caroll and Kinsella,
2013). Traditional apiculture methods mainly involve the use of traditional log hives
that are hung high in trees and spread over extensive areas far away from people and
animals. This traditional method is practiced majorly in the dry lands of Kenya. Plate 1: Fixed comb hives: clay hives,
wall hives, log hives, bark hives and many others
Plate 2: Movable comb hives: top-bar hives, of which there are many styles
13
In the modern bee keeping methods, bees are kept majorly in top bar of the modern
hives in agriculturally productive parts of the country where many of people live
(Carroll and Kinsella, 2013). Apiculture is an important source of livelihood for
many farmers who are resource poor. However, despite the suitable natural
environment and the ability for establishing sustainable livelihoods in rural areas,
apiculture lacks the needed financial and technological support to fully exploit its high
potential in forests and natural ecosystems conservation. In comparison with other
agricultural activities, apiculture is a cheap economic activity with the ability to have
huge effect in bettering people‟s livelihoods and the national economy. However,
poor technologies, lack of adequate knowledge, environmental depletion and low
production are some of the major constraints that face the sub-sector (Jiwa, 2005;
Muga, 2011).
The effort to better Kenyan bee keeping began in 1967 through an Oxfam grant that
funded their first apiculture development project. In 1970 the government of Kenya,
together with financial and technical support from the government of Canada
established The National Beekeeping Station in the Kenyan Ministry of Agriculture.
This was to look into the development of Kenyan apiculture through extension
services, research development and the professional training of Kenyan beekeepers
(Kigatiira, 1976). Currently, apiculture development is focused on bettering of the
hive technology and professional. The main bee hive technology improvement is
interested in the Langthroth or the Kenya Top Bar Hive (KTBH).
Beekeepers in developing countries e.g. Kenya are also faced with the challenge of
poor honey quality due to inadequate information on suitable technologies on
harvesting, storage and processing. This in turn influences the rise and demand in
internal and external markets technologies for bee product diversity. In these
situations, development partners and the government need to come in and assist the
farmers improve traditional bee keeping methods or introduce new technologies in
new areas of apiculture (Jones, 1999). Although apiculture does not need high
technology in practice, constant training is required by beekeepers on improving bee
14
A study conducted by Tadesse (2011) in Addis Ababa, Ethiopia, revealed that
availability of information and knowledge about the related skills required for bee
farming are vital in the beekeeping adoption process.
2.5 Contribution of Apiculture to Food Security
The country‟s ability for apiculture development is close to over 100,000 metric tons
of honey and 10,000 metric tons of beeswax. However, at the moment only a fifth of
this ability is being realized (GoK, 2008). In Kenya, over 90% of bee farmers use
traditional ways of apiculture that leads to low honey quality (Mbae, 1999). Mbae
(2000) noted that the beekeepers‟ earned Kshs.7.2 Million from the sale of honey and
this compared favorably with Kshs.6.6 million from the livestock-rearing sector.
Apiculture alone contributes about 1.89% of this amount (Muya, 2004). Apiculture
needs very little money or labour input. It is a cheap and gender friendly venture
which does not need much resources like other agricultural activities. Apiculture is
possible in dryland areas and other places where crops have not succeeded (Bradbear,
2002).
In Africa, pollinator dependent crops include numerous indigenous vegetables, such
as African nightshades, amaranths, spiderplant, slenderleaf and Crotalaria brevidens),
African kale, jute mallow and African eggplant and Solanum gilo)
(Abukutsa-Onyango et al. 2010). Also important are nuts e.g. macadamia, (Johannsmeier, 2001)
and wild fruits harvested from natural and semi-natural areas such as shea nuts
(Vitellaria paradoxa). The vast majority of pollinators for these vitamin rich crops are
insects such as bees (Klein et al. 2007), underlying the importance of insects in
securing crop pollination services. Pollination services also contribute to other aspects
of crop production. For example, strawberry producers and pollination researchers in
Kenya demonstrated differences in their crop yields depending on whether the fields
were located near beehives. Increased insect pollination/visitation resulted in more
uniform and marketable strawberries (Asiko 2012); and runner bean with good
exposure to honeybees produced fewer “sickle shaped” pods that horticultural
exporters refuse to accept (Vaissière et al. 2010).. In the African continent, the area
with pollinator-dependent crops has increased by more than 300% in the past 50 years
15
Current trends linked to the increase in the horticultural sector show vastly greater
increases in pollinator-dependent crops in developing regions of the world than in
developed countries. Use of controlled honeybee colonies for pollination of crops has
been virtually the sole practice to increase levels of pollination service to agricultural
production e.g. apples in South Africa, (Johannsmeier, 2001). Honeybees can easily
be managed, and their populations increased and moved around to match flowering
periods (Radar et al.2009). However, they are not always the most optimal pollinators
(Westerkamp, 1991), and can be susceptible to disease and degradation of the natural
environment (Johannsmeier, 2001). Recent research has shown that interactions by
wild pollinators and managed honeybees may lead to more effective pollination than
either alone (Greenleaf and Kremen 2006; Carvalheiro et al. 2011). Moreover, the
overall economic importance of pollination services, the production value per unit
farming area of insect pollinated crops is four times that of crops that require no insect
pollination (Gallai et al. 2009).
Thus farmers can make more money and produce more nutritious foods if they
cultivate high-value, often pollinator-dependent, crops. Agricultural development
programmes aiming at poverty reduction need to recognize the crucial role sufficient
animal pollination plays in maintaining and increasing yields of horticultural crops
and thus in improving human nutrition and food security. Animal pollination is being
increasingly recognised as an essential ecosystem service, whose sufficient
provisioning leads to overall increased and stabilized crop production (Garibaldi et al.
2011), and therefore sustained income levels and food security. Crops like avocado
and mango benefit from insect pollination in terms of number of fruits produced
and/or weight of fruits or seeds. Around three-quarters of food crops in the whole
world depend on animal pollination (Klein et al. 2007), including primarily vitamin
and mineral rich crops such as fruits and vegetables.
16 2.6 Apiculture and environmental conservation
Beekeeping is possible in arid areas and places where crops or other enterprises have
failed; the roots of nectar-bearing trees may still be able to reach the water table far
below the surface in these areas. This makes beekeeping feasible in marginal
conditions, which is important for people who need to restore their livelihoods or
create new ones (Ellis, 2000). Bees provide many benefits to the natural environment
and are very important in its sustainability. Their function is not quite noticed even
though bees are required for the pollination of many cultivated crops and for
biodiversity maintenance. Normally, a honeybee can visit between 50 to1, 000
flowers in one trip. In Europe, a bee can make between 7 to 14 trips a day. A colony
with 25 000 forager bees, each making 10 trips a day, is able to pollinate 250 million
flowers (FAO, 2009). Beekeeping ensures the continuation of natural assets through
pollination of wild and cultivated plants. Flowering plants and bees are
interdependent: one cannot exist without the other. As bees visit flowers, they collect
food and their pollination activities ensure future generations of food plants, available
for future generations of bees and for people too. It is a perfect self-sustaining
activity. Pollination is difficult to quantify, but if it could be measured it would be the
most economically significant value of beekeeping (Hoshiba & Sasaki, 2008).
Bees are important agents of pollination and many ecological areas rely on the
pollination of bees for their survival and for improving their hybrid vigour. A
reduction in the number of bees and bee types could therefore affect the survival of
plant types that rely on the pollination by bees. About one third of all plants or plant
products eaten by humans depend on bees for their pollination (FAO, 2009). Crops
pollinated by bees give more outcome and better quality at no extra cost. Agricultural
systems, by design or by the nature of their development, may be relatively conducive
to sustaining biological processes. This is the case in much of Africa, where due to the
extensive nature of most farming systems and the relatively low use of inputs, such as
fertilizers, most farmers currently rely on natural pollination services, the presence of
natural enemies that control pests, and natural means of restoring soil fertility such as
through fallow (Styger and Fernandes, 2006). While yields are typically low, there are
17 2.7 Summary of Knowledge Gaps
Although very many studies have been done on the benefits and challenges of
beekeeping, a few have been conducted in Kenya. Furthermore, those done in Kenya
were conducted in other regions but not in the area of study for this project. The
current study intended to establish how apiculture can be used to improve food
security and environmental conservation, by assessing its level of adoption,
challenges facing its adoption and coming up with suggestions on how these
challenges can be overcome or minimized. The study therefore, through its findings
will add more knowledge to the existing body of knowledge on the bee keeping
18
CHAPTER 3: RESEARCH METHODOLOGY
3.1 Study Area
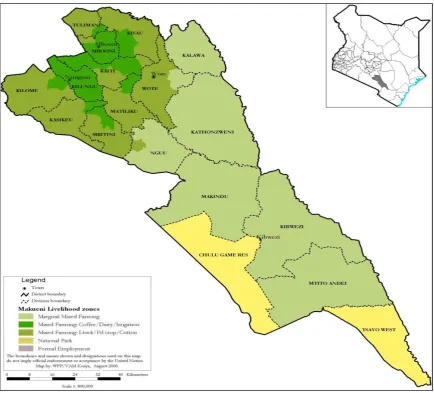
Kathonzweni division in Kathonzweni sub-county is located in Makueni County
(Figure 3.1) and occupies an area of 301 square kilometres with a population of about
31,277 people (KNBS, 2010). The study area is majorly a dryland and often
experiences droughts. The area gets low rainfall of about 300 mm to 400 mm per
annum (Amukono, 2016). The study area rarely supports the main food crops maize
and beans. Animal keeping therefore is the common sustainable economic activity
practised by the local residents.
19 3.2 Research Design
The study was done by use of survey research design, where engagement with
respondents through questionnaires and interviews played a crucial role. This design
was preferred because tacit knowledge, which is extracted through dialogue, can play
a critical role in understanding farmer behaviours and hence inform more pragmatic
policy for positive change. Since it leads itself to determining general trends (Bell,
1993), descriptive statistics complemented the research design in data analysis.
3.3 Sample Size and Sampling Procedures
The target population for this study included household heads, agricultural extension
officers and village elders in Kathonzweni division. Sampling involved identifying a
of a sub group within the population that represents a large group from whom they
were identified from (Kathuri et al, 1993). Sampled size should be optimum where
the requirements of efficiency, representativeness, reliability and flexibility are
fulfilled (Kothari, 2004). In this regard the researcher selected a sample size of 379
respondents using the table for determining sample size (Appendix 7.6) as suggested
by Darley and Robert (1970). The table is based on standardized figures of sample
sizes for different population (or proportion of it) at 95% confidence level. By use of a
standardized table, the researcher was 95% certain that the results obtained from the
sample would be representative enough for the entire population.
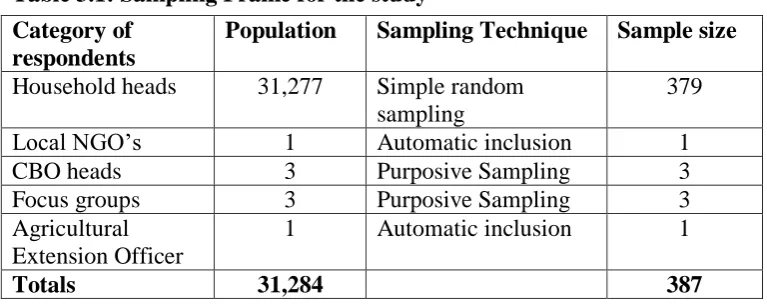
Table 3.1: Sampling Frame for the study Category of
respondents
Population Sampling Technique Sample size
Household heads 31,277 Simple random sampling
379
Local NGO‟s 1 Automatic inclusion 1
CBO heads 3 Purposive Sampling 3
Focus groups 3 Purposive Sampling 3
Agricultural
Extension Officer
1 Automatic inclusion 1
20
From table 3.1, the optimal (effective and valid) sample size for a population of 31277
households was 379. Local Non-Governmental Organizations and Agricultural
Extension Officers were automatically included in the study because they oversee
farming activities in the area hence they acted as key informants on issues concerning
the potential of apiculture in the area, the challenges faced by bee farmers, and policy
interventions for improvement. The CBO heads and focus group heads were
purposively picked because being in constant touch with the farmers, they held crucial
information about the reality on the ground; and which was of great interest to the
researcher.
3.4 Data Collection Methods
Quantitative data was gathered using household questionnaires (Appendix 7.1) while
qualitative data was gathered using qualitative tools or instruments such as;
participatory transect surveys (Transect walk), Focus Group Discussions (Appendix
7.2) and Key Informant interviews (Appendix 7.3) as detailed below.
3.4.1 Questionnaires
For purposes of this study, a household was categorized as a family unit dependent on
one head and a common livelihood. Questionnaires were formulated with questions
aimed at getting answers to the four research questions. They were given to 379
households to get information, opinions and perceptions about the study objectives at
the household level. Questions posed ranged from demographic, social, economic to
environmental. Administration of the questionnaire was done by the researcher with
the aid of one research assistant.
3.4.2 Key Informant Interviews
The study relied on Key Informant Interviews to give more and clear information
especially on the technical knowledge on about the study topic and area. The major
Key Informants included representatives of relevant Ministries at the local level and
21 3.4.3 Focus Group Discussions
Three focus group discussions were selected randomly in the area of study. The
semi-formal discussions were conducted at the chiefs‟ camps and nearby local churches
with the assistance of a moderator.
3.4.4 Participatory Transect Survey
It‟s an information gathering exercise where, the only knowledge needed is key
informant advice on finding out the transect line routes and a few selected local
analysts. This study made use of three transects walks. Each transect walk was done
with about 5-10 local analysts taking about 2 to 3 hours. The walk started from one
end of a define area and ended at the end of that administrative unit. The distribution
of bee farmers including the status of the hives was mapped and documented.
3.5 Data Analysis Methods
3.5.1 Questionnaire Data
Questionnaire data from all the 379 households was analyzed quantitatively for all
quantifiable data under research. This data was first coded and fed in Statistical
Package for Social Sciences (SPSS) Version 20 and Excel spread sheets. The outcome
was then analyzed through cross tabulations, rankings, percentages, frequency counts
mean, and standard deviations. The analyzed data was then presented in form of
tables, graphs and pie charts.
The rest of the data in this study was then analyzed qualitatively since it involved
measurements that would not be quantified. All data collected using qualitative
methods such as focus group discussions, key informant interviews and participatory
transect survey was analyzed qualitatively and presented in form of ranks and scores
of perception and descriptions. Cross-tabulations were also used to show trends,
22
3.5.2 Focus Group Discussion and Key Respondent Data
Data collected using qualitative methods such as focus group discussions and key
informant interviews was analyzed qualitatively and presented in form of ranks and
scores of perception and descriptions. Cross-tabulations were also used to show
trends, patterns and extent of influence of two variables on each other.
3.5.3 Participatory Transect Survey Data
This study made use of three transects walks. Each transect walk was done with about
5-10 local analysts taking about 2 to 3 hours. Each walk started from one end of a
define area (a road) and ended at the end of that administrative unit. All data collected
using qualitative methods such as participatory transect survey was analyzed
qualitatively and presented in form of a participatory transect diagram.
3.5.4 Sampling and Analyzing On Farm Honey Quality
A total of ten (10) samples of honey were randomly taken from 10 different farmers
in the study area of Kathonzweni division and taken to a reputable laboratory
(Egerton University) where they were carefully analyzed. The honey parameters
analyzed included; Hydroxy-Methyl Furfural (HMF), Sugar (Brix) Content, Moisture
Content, PH and Free Acidity. Each of the ten samples was tested three times per
honey quality parameter and an average value obtained. Below is the procedure for
determining each honey quality parameter;
i. Free Acidity
The free acidity of honey is the total number of free acids, given in
milliequivalents/kg honey. It was determined by the following procedure. A 10 g
sample of honey was added to 75 ml of distilled water in 250 ml beaker. The solution
was placed in calibrated pH/reference meter and stirred. The solution was then titrated
at pH 8.5 with 0.05M NaOH and results recorded. 10ml of 0.05M NaOH was added
to the resulting solution and back titrated at Ph 8.3 using 0.05M HCl from a second
burette and results recorded. A blank determination procedure of 75ml of distilled
water at Ph8.5 was run and results recorded. These measurements were taken in
23 Calculation
Free Acidity= [(ml of 0.05M NaOH used*NaOH Molarity)]-(ml of 0.05M NaOH
titrated blank)*NaOH Molarity*(1000/Sample weight).
ii. HMF (Hydroxymethylfurfural)
It is used to evaluate honey freshness. It was determined by the White Method (White,
1970, Bogdanov, 2002). This spectrophotometric method involves measurement of
UV absorbance of clarified aqueous honey solutions with and without sodium
metabisulphite.
Procedure
A quantity as close as possible to 5g of honey(Exactly weighted) was dissolved in
25ml of distilled water and transferred quantitatively into 50ml volumetric flask, then
proteins were precipitated by adding 0.5 ml of Carrez solution 1(15g of Potassium
Ferrocyanide in 100ml distilled water) and 0.5ml of Carrez 2(30g Zinc acetate in
100ml distilled water). The content was made up to 50ml with distilled water and the
solution was filtered through a filter paper. After rejecting the first 10ml of the filtrate,
aliquots of 5ml were put into two test tubes; 5ml of distilled water were added to one
test tube(sample solution); 5ml of fresh sodium metabisulphite solution of
0.2%(reference solution) were added to the second test tube. The absorbance of the
solutions at 284 and 336 nm was determined using spectrophotometer. Dilutions (D)
of both sample and reference solution was used if the absorbance at 284nm exceeded
a value of about 0.6. These measurements were taken in triplicates.
Calculation
HMF content in mg/1000g was calculated as
(A284-A336)*149.7*5*D/W.
Where:
A284- absorbance at 284nm
A336-absorbance at 336nm
24 W- Sample weight in g of the honey sample.
5- Theoretical nominal sample weight.
149.7-Constant
iii. Moisture Content
Honey moisture determines for how long honey remains stable and without being
spoilt by yeast through fermentation. The more the moisture, the more the chances
that the honey will be spoilt when stored (International Honey Commission, 2009).
Moisture determination in the honey samples was done using a refractometer.
Procedure
A sample of 20-50g of the honey is placed in a beaker and stirred with a plastic spoon.
2 drops of the honey were placed onto the prism area of the refractometer and the
daylight plate closed to spread the sample evenly over the prism surface. Looking
through the eyepiece of the refractometer, there was a boundary line where a blue and
a white colour met. The reading there is the Brix %. These measurements were taken
in triplicates. To obtain the value of moisture content in %;
100%- Brix content=% Moisture
iv. Acid Content (pH) of honey
The average PH of honey is 3.9. However, the Ph can be between 3.4 to 6.1. Honey
has many types of acids both organic and amino acids. These acids may be aromatic
or non-aromatic. The non-aromatic acids give the good taste of honey by interacting
with the flavor of other ingredients. Gluconic acid for example is good at improving
honey taste. The aromatic acids like malic acid mainly from the flowers add to the
aroma and taste of the honey (Standifier, 2007). The pH of honey was determined by
a pH meter, which had been calibrated using commercial buffer solutions of pH 4.0,
7.0 and 9.0. A 10 g of honey sample was taken and added to 75 ml of carbon free
distilled water in a 250 ml beaker, thoroughly stirred and its pH recorded at 20 ºC.
25 v. Sugar Content (Fructose/Glucose)
The Lane-Eynon hot titration method was used to measure the content of reducing
sugars (mainly glucose and fructose) (COVENIN, 1984a). A sample of 20-50g of the
honey is placed in a beaker and stirred with a plastic spoon. 2 drops of the honey
were placed onto the prism surface of the refractometer and the daylight plate closed
to spread the sample evenly over the prism surface. Looking through the eyepiece of
the refractometer, there was a boundary line where a blue and a white colour met.
These measurements were taken in triplicates. The reading there is the Brix %(
%fructose/glucose). These measurements were taken in triplicates.
3.6 Validity and Reliability of Instruments
Validity means the ability of a research tools to measures what it is designed to
measure (Gay, Mills & Airasian, 2009). To test the validity of the instruments the
researcher carried out a pilot study in two villages in the neighbouring sub County
(Nzaui sub County) with identical characteristics to the sample. The sample of the
pilot study comprised 20 household heads from each location. Through the pilot
study, the researcher was able to find out the complexity in the research questions.
The research questions that didn‟t measure the variables of interest were adjusted.
Reliability is a measure of the ability of a research tool to give same results after
repeated trials (Mugenda and Mugenda, 1999). To test how reliable the research tool
is, the researcher employed the test re-test in the pilot study. During the test, the
researcher gave the questionnaires to the pilot sample, and after one week, the
researcher conducted a re-test by the administering the same instruments to the same
respondents. The results of the test-retest method helped the researcher to perfect the
questionnaire concepts, ensure that wordings are clear, and that respondents
interpreted the questions in the same way. The researcher then used Pearson product
moment correlation formula to correlate the scores from both test periods to obtain the
correlation coefficient, Pearson‟s product moment Correlation Coefficient Formula is
26
Where, = Sum of the gross product of the values of each variables.
= Number of total items.
( = Product of sum of and the sum of
(Best & Kahn, 2006).
Pearson product moment correlation establishes the extent to which instruments are
consistent in eliciting the same responses every time the instrument is administered
(Jwan, 2010). For this study, a correlation coefficient of 0.89 was obtained; implying
that the instruments were highly reliable because statistically, a correlation coefficient
of 0.8 to 1 is considered enough to judge the instruments as reliable for a study.
3.7 Ethical Considerations
In adhering to the ethical issues, the research proposal had to be approved by the
school of Environmental Studies, Kenyatta University. The researcher sought
permission from the local administration before commencing the study. The
researcher also had to make sure that participants are informed of the nature and
requirements of the study. The researcher too guaranteed the respondents of the
confidentiality of the information given. Anonymity of the respondents was achieved
27
CHAPTER 4: RESULTS AND DISCUSSION 4.1 Introduction
This chapter looks into questionnaire return rate, demographic information, data
presentation, interpretation and discussion of research outcome. The presentations
and discussions were done based on the research questions, emerging trends in
findings and the reviewed literature so as to ensure that any knowledge gaps identified
are properly filled.
4.2 Questionnaire Return Rate
Questionnaire return rate is the number of the questionnaires that are brought back
after they have been answered by the respondents. All the questionnaires administered
to the respondents in this study were returned (100% return rate). This was possible
because, the researcher, together with the research assistants went from one household
to another soliciting response. This was necessary because some of the items in the
questionnaire required the researcher to read loudly to the respondents, clarify
ambiguities and make corrections on any misinterpretations. According to Mugenda
and Mugenda (2003), any questionnaire return rate above 90% in considered
representative enough for a study.
4.3 Demographic Information of Respondents
This part deals with the demographic information of the respondents like age, gender
and education level of respondents. It also looks at how these factors influence both
food security and the adoption of apiculture in the division.
4.3.1 Gender and Age Bracket of Household Heads
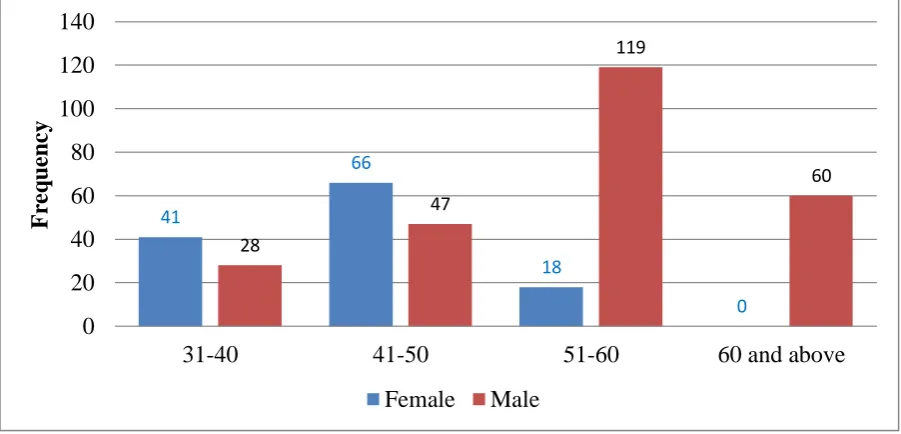
The study established that, up to 67% of the respondents were males while females
comprised 33%. The study also established that all the household heads were adults
above 30 years of age. Majority of them were in the age brackets of 51-60 years and
41-50 years, while those in the age bracket 31 and 40 years constituted a small
percentage. Those above 60 years of age were men only (Figure 4.1). The analysis
also showed that some household heads were below 60 years of age implying that age
28
The findings also show that bee keeping was not a preserve of a particular gender as it
was practiced by both men and women. This can be attributed to the fact that men are
under normal circumstances, the heads of the family and hence bear the responsibility
of fending food to their families. The small percentage of women practicing
apiculture could be those who were separated, divorced or widowed, and hence were
the sole breadwinners for their children.
Figure 4.1: Household Heads Distribution by gender and age bracket
To validate the above statement, a cross tabulation between the marital status and the
reasons for practicing bee keeping was done. Table 4.1 below summarizes the
responses obtained. 41
66
18
0 28
47
119
60
0 20 40 60 80 100 120 140
31-40 41-50 51-60 60 and above
F
re
q
u
en
cy
29
Table 4.1: Cross-tabulation between the marital status of women and the reasons for bee keeping
Marital
Status
Reason
Reasons for bee keeping
Total Is a source of income Is a source of food To supplement other farming activities Cheaper than tilling land Conserves the environment
Divorced 10 1 2 1 1 15
Separated 16 1 3 2 3 25
Widow 16 2 4 2 2 26
Majority of the women across the three marital status said that they practiced bee
keeping as a main source of income. Other reasons given were; to supplement other
farming activities, to conserves the environment, was cheaper than tilling land, and as
a source of food in that order.
4.3.2 Level of Education
Study findings revealed that less than half of the respondents had post- secondary
education while majority had fully or partially completed their secondary and primary
education respectively. This is shown in figure 4.2
Figure 4.2: Level of Education of Household heads Source; Fieldwork
0 5 10 15 20 25
No formal education primary incomplete primary complete secondary incomplete secondary complete Post- secondary incomplete post -secondary complete
30
The analysis in Fig. 4.2 above suggests that, the level of illiteracy among household
heads was low and this could boost the adoption of modern practices and technologies
of apiculture. However, the fact that a good number of them had attained secondary
and tertiary education means that, with little training and capacity building on aspects
relating beehive types, modern harvesting techniques, honeys processing, storage,
marketing and valuation, bee keeping could be up-scaled in Kathonzweni division.
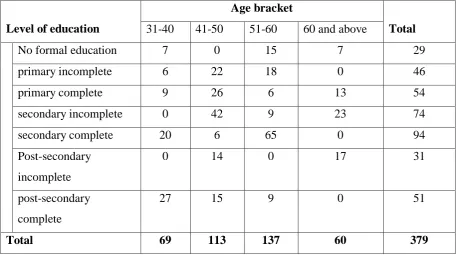
Cross- tabulation between the age of the respondents and their levels of education
showed that, majority of respondents with secondary education were between the ages
of 31-40 years (27) and 41-50 years (15). Likewise, majority of those with post-
secondary education (42) were below 50 years of age, while majority of those with
primary and incomplete secondary education were between 41-50 years of age. More
than three quarters of respondents with no formal education were above 50 years of
age. The results of the cross-tabulation are captured in table 4.2 below.
Table 4.2: Cross tabulation between the age and education of respondents
Level of education
Age bracket
Total 31-40 41-50 51-60 60 and above
No formal education 7 0 15 7 29
primary incomplete 6 22 18 0 46
primary complete 9 26 6 13 54
secondary incomplete 0 42 9 23 74
secondary complete 20 6 65 0 94
Post-secondary
incomplete
0 14 0 17 31
post-secondary
complete
27 15 9 0 51
31
The levels of education of farmers influence their level of adoption of apiculture and
up-take on new technologies. Most farmers had completed their secondary school
education (94%) with 65% of them aged 51-60 years. At the same time, 15% of the
50-60 year old bee farmers had no formal education. According to of Mujuni and
Natukunda (2008) more educated farmers were more likely to adopt beekeeping since
education stimulates their acceptance of new technologies. He attributed this to
increased knowledge, access to related information such as the right time for
harvesting and improved understanding of the related best management technologies.
Furthermore, Adgaba N, et al, (2014) noted that age and level of education positively
influenced adoption decision of beekeeping training. They argue that most farmers
who attend trainings are always young people below 35 years and have formal
education and are predominantly from rural backgrounds with agriculture as their
main occupation. However in the study area, apiculture is mainly practiced by the
people aged 51-60 years and therefore the young people need to be encouraged to
practice apiculture.
4.3.3 Length of residency in the Division
The study established that, 30.9% and 41.4% of the respondents had been residing in
the location for a period of 10-20years and 20 years and above respectively.
Only a small percentage (27.7%) had been there for a period less than ten years.
Figure 4.3 below summarizes the period of residency (in years) of the respondents.
Figure 4.3: Period of residency in the Division Source; Fieldwork
0 20 40 60
4-6 years 6-10 years 10-20 years 20 and above 12.9% 14.8%
30.9% 41.4%
P
er
ce
n
tage