Leaf Water Potential Trends in Three Grasses Native to
Semiarid Argentina
ROBERTO A. DISTEL AND OSVALDO A. FERNANDEZ
AbstrpCt
The natural grazing land of the zemiarid region of central Argen- thra is subject to long and intense periods of drought during the hot season.
The rhn of the present study was to analyze the pattern of leaf water status for the cool-season grasses PQ&&Wbun napostaen- se and Stipa tenuis and the warm-season grass Pappophonun subbuibosum, which are important forage species in this grazing area. Leaf water potential, soil water potential, and relative humid- ity were measured during 1983 and 1984. At soil water potentials above -0.5 MPa, the leaf water potential of the 3 species showed high values at 0800, after nocturnal rehydratation, and minimum values at 1400, coincident with maximum atmospheric water demand. P. subbulbosum showed a greater capacity to withstand the drop in water potential at 1400 than did the cool-season spde~. During periods of low soil water potential the range of daily variation in leaf water potential was reduced in the 3 species because of marked decreases in the maximum and minimum values. Leaf water potential in the cool-season species correlated better with the deficit of atmospheric vapor pressure than with soil water potential. Leaf water potential of P. subbulbosum on the other hand showed a higher correlation with soil water potential than with atmospheric vapor pressure deficit.
Key Words: Piptochaetium napos~nse @peg.) Hack., St@ teds Phil., Pappohorum subbulbosum Arech.
Piptochaetium napostaense @peg.) Hack, Stipa tenuis Phil. and Pappophorum subbulbosum Arech. are 3 prominent perennial forage grasses native to the rangeland of a semiarid phyto- geographic area of central Argentina known as the Calden District (Cabrera 1976). P. napostaense and S. tenuis are cool-season grasses (Distel and Pelaez, unpublished) that fix carbon dioxide via the Cs photosynthetic pathway, whereas P. subbulbosum is a warm-season C4 grass. With proper range management the 2 win- ter species form an extensive gramineous steppe that frequently accounts for more than 75% of the total herbaceous plant cover of the stand. The summer species on the other hand is less abundant and occurs in patches. The size and potential of the region in which these species are widespread make it one of the principal natural cattle-raising areas in the country.
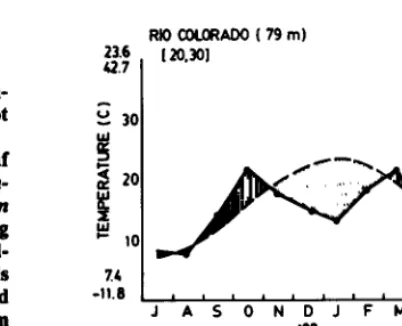
The climatic diagram in Figure 1 shows that drought occurs at various times of the year in the study area, but that those of greatest intensity occur in the summer (during November through Febru- ary). Such climatic pattern underscores the importance of water in pasture production.
Sala et al. (1981) found that cool-season grasses differ from warm-season grasses in their plant water potential response to drought conditions. The cool-season species they studied did not show the same capacity as the warm-season species in recovering the high leaf water potential level consistent with high physiologi- cal activity. Because many morphological characteristics are very sensitive to water stress (Turner and Begg 1978), the effects of drought are particularly important in forage species where leaf production is critical. It is thus important to know the particular
Authors are graduate research and professor, Centro de Recursos Naturales Renovables de la Zona SemiPrida and Departamento de Agronomia, Universidad National de1 Sur, 8000 Bahia Blanca, Argentina.
This research was supported by the Secretai de Ciencia y TCcnica and a Consejo National de lnvestigaciones Cientlticas y TCcnicas’ fellowship to R.A. Distel.
Manuscript accepted 25 September 1986.
RiOfXN.CRADO(79m) 63 344
23.6
42.7 120.301
x4
-11.6 I I 1
JASONDJFMAMJ IO
- PREClPlTAT@4 m DRY SEASON
- TEMPERATURE m WET SEASON
Fig. 1. Climate diagram of Rio Colorado (390 01’ S Lat. and 640 05’ W Long.) according to Walter’s instructions (Walter 1977). The annual mean temperature of a IO-year period is 15.3O C; the annual mean precipitation of a 30-year period is344 mm: the average temperature in January is 23.6” and the absolute maximum temperature is 42. P C; the average temperature in June is 7.4O C and the absolute minimum temperature is -11 .a0 C; the frost-free period is 188 days.
level of drought the plant is exposed to, and plant water potential is a good indicator of this level (Richter 1976).
The aim of the present study was to analyze the patterns of leaf water potential, soil water potential, and atmospheric water demand at different times of the year for P. napostaense, S. tenuis. and P. subbulbosum, with a view to evaluating the behavioral characteristics of these species with respect to water.
Site Description
The site where the study was conducted is located in the south- eastern zone of La Pampa province (38“45’ S Lat., 63’45’ W Long.) and comprises an area of 20 ha which has been closed to grazing for the last 12 years. The general characteristics of this region concerning climate, soil, and vegetation, have been des- cribed previously (INTA et al. 1980). It is a semiarid region with temperate climate and has an average temperature of 7.4’ C during the coldest month (June) and 23.6O C during the hottest month (January). The annual mean temperature is 75.3” C, and the absolute minimum and maximum temperatures are -12.8” C and 42.7’ C, respectively. There are an average of 188 frost-free days per year, with the first frost occurring about the middle of April and the last in the first week of October. The average monthly relative humidity ranges from a winter maximum of 76% in June to a summer minimum of 47% in January. The predominant winds are NW and SW with a mean annual velocity of 14 km/h, and the strongest winds occur in the spring. The average rainfall is 344 mm per year, concentrated mainly in spring and autumn, and the annual water deficit is approximately 400 mm.
The soil in the area is a Typic Paleorthid, well-drained, of medium to thick texture with a 0.5 to 1% slope. The soil profile is quite shallow with a petrocalcic horizon found at depths of 40 to 60 cm. The soils of the region have been classified as thermic and arid (Van Wambeke and Scoppa 1976).
The vegetation of the site is a gramineous steppe with isolated shrubs. The grasses P. napostaense and S. tenuis account for an average of 95% of the total perennial herbaceous biomass.
F’83MAMJ JASONDJ’84FMAMJJASONDm
MONTHS
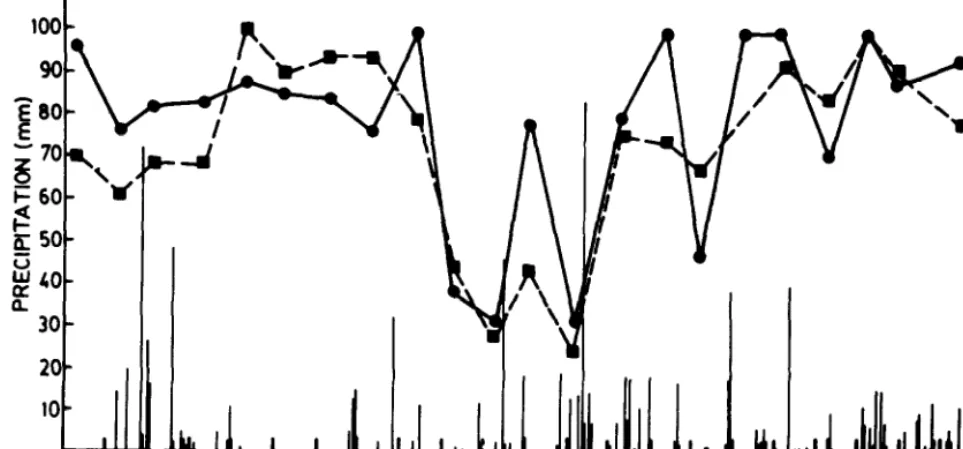
Fig. 2. Soil water potential at IO cm (- ) and 30 cm (----), and seasonal distribution of rainfall during the measurement period.
Materials and Methods
A monthly evaluation of soil, atmospheric, and plant water status was conducted throughout 1983 and 1984. Soil water poten- tial was measured with Wescor PCT-55 thermocouple psychrome- ters with ceramic cups. Individual calibration of each unit was achieved with sodium chloride (Na Cl) solutions of 0.1, 0.3, 0.5, 0.8, and 1.0 Molal (Wiebe et al. 1971). The microvolt output for each was measured with a Wescor HR 33-T microvoltimeter. A regression equation was calculated for each thermocouple psych- rometer, allowing conversion of the field recorded microvolt read- ings into water potential values expressed in MPa. The psychrome- ters were placed in the soil between grasses at depths of 10 cm and 30 cm, with 3 replications at each level. One reading was taken at 0800 on each sampling date.
Leaf water potential was estimated using the pressure chamber technique (Scholander et al. 1965). Measurements were made on expanded green leaves of 3 plants for each species at approximate intervals of 30 days. Measurements for the 2 cool-season grasses were taken throughout the year, while for P. subbulbosum no measurements were taken during the period of winter dormancy because of the lack of appropriate leaves. During 1983, leaf water potentials were determined 3 times a day: 0800, 1400, and 1800. During 1984, measurements were obtained only at 0800 and 1400. Relative humidity and air temperature measurements were obtained concomitantly with leaf water potentials, using a Taylor hygrometer. These data were used to calculate atmospheric vapor pressure deficit. Precipitation at the study site was measured with an automatic rain gauge.
The leaf water potential values were subjected to completely randomized design statistical analysis, and the comparison among species was performed by the Least Significant Difference test of Fisher; the minimum leaf water potential of each species at each sampling date was correlated (Snedecor and Cochran 1971) with the maximum soil water potential and with the maximum deficit of atmospheric vapor pressure.
Results
Figure 2 shows the seasonal distribution of precipitation and the course of soil water potential during the study period. In 1983 and 1984 precipitation totalled 532 mm and 632 mm, respectively; both of these amounts exceeded the long-term average. Summer rains
204
deviated the most from the mean distribution pattern. In 1983 summer rainfall totalled 265 mm, considerably more than the long-term average of 100 mm. Nevertheless, there were several periods of water deficit during the hot season as evidenced by the low soil water potentials for November and December 1983, Feb- ruary 1984, and January 1985. Soil water potentials of -2 MPa were measured at a depth of 10 cm and -3 MPa at a depth of 30 cm in December 1983 and February 1984. For most of the other dates soil water potentials stayed at or above -0.5 MPa.
The vapor pressure deficit followed a wavelike pattern of varia- tion with low values in winter, high values in summer, and inter- mediate values in spring and autumn. During the day, minimum values were recorded at 0800 and maximum values at 1400.
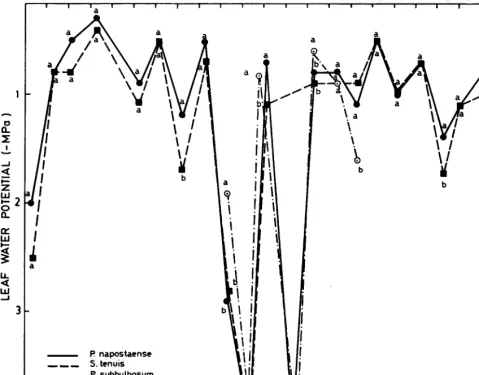
Figures 3 and 4 show the seasonal course of leaf water potential for the 3 species under study. The differences observed between winter species (P. napostaense and S. tenuis) were not significant (X0.05). On those dates having soil water potentials close to or greater than -0.5 MPa the daily leaf water potential followed the expected course with high values at 0800 (Fig. 3) after nocturnal rehydratation, bringing plant water potential into equilibrium with soil water potential. Minimum values for leaf water potential occurred at 1400 (Fig. 4), which coincided with maximum atmos- pheric water demand. Intermediate values of leaf water potential occurred at 1800. At times of water deficit the range of daily variation in plant water potential was reduced in both winter species because of marked decreases in the maximum and min- imum values.
With soil water potentials above -0.5 MPa, P. subbulbosum showed a greater capacity to withstand the drop in water potential during times of higher atmospheric water demand than did the winter species (Fig. 4). This difference was statistically significant (X0.05) and continued so in situations of less severe drought (November 1983 and January 1985). In periods of more severe drought, however, P. subbulbosum resembled the winter species in its reduced range of daily variation in leaf water potential, with low values even at 0800 (Fig. 3).
Table 1 showed the simple linear correlation COCffiCientS (7) between minimum leaf water potential (which always occurred at 1400) and maximum soil water potential (the highest values at depths of 10 and 30 cm) and maximum deficit of atmospheric
vapor pressure. In the case of the winter species, leaf water poten- tial correlated better with the deficit of atmospheric vapor Pressure
MONTHS
F’83M A M J J A S 0 N D J’84 F M A M J J A S 0 N D J’85
I? napostaense
___ S.tenuis
-._ F! subbulbosum
a
b
Fig. 3. kaf water potentials at 0800. For each date, values with the same letter are not significantly dif/erent (PCO.05).
than with soil water potential, although the correlation with both parameters was highly significant (JYO.01). Leaf water potential of P. subbulbosum on the other hand showed a higher correlation with soil water potential (highly significant, X0.01) than with atmospheric vapor pressure deficit.
Table 1. Correlation coeft%ients(r) relating minimum leaf water potential with maximum soil water potential and maximum vapor pressure deficit.
Environmental Parameters Maximum soil water Maximum vapor
Species potential pressure deficit
P. napostaense .630** .708**
S. tenuis .645** .746+’
P. subbulbosum .969** .713*
***Significant at the 0.05 and 0.01 levels, respectively.
Discussion
The correlation coefficients in Table 1 show that both soil water potential and atmospheric water demand are important modula- tors of plant water potential in all 3 species studied. Kramer (1969) points to these 2 variables as the principal determinants of plant water potential, though he does state that such potential also
JOURNAL OF RANGE MANAGEMENT 40(3), May 1987
depends on the intrinsic properties of each species. In the case of the winter species, the fact that soil water availability was not limited in the cool season accounts for the low correlation between leaf water potential and soil water potential.
Under conditions of water deficit the daily leaf water potential in P. napostaense and S. tenuis was low throughout the entire day. A similar pattern was observed for Agropyron smitii and Stipa comata (Barnes and Harrison 1982). Similar models have also been described by Sala et al. (198 1) for the winter species of a grazing area in the Depresion de1 Rio Salado, Argentina, and by Redman (1973) for Agropyron dasystachyum in Canada. The results of the present study indicate that P. napostaense and S. tenuis are not capable of daily recovering the high leaf water potential consistent with high physiological activity under drought conditions. This is further corroborated by the fact that these plants complete their entire growth cycle and senesce before commencement of the dry summer season. In summer months, the number of green leaves increases only after abundant rain. On the basis of this pattern, P. napostaense and S. tenuis would be classified as drought avoiders by Kramer (1980). These species have certain morphological and physiological characteristics that enable them to be “opportunis- tic” concerning their water use. One such characteristic is the distribution of their roots in the upper soil profile. At the study site where both species are dominant, 67% of total root biomass was in the top 20 cm of soil (Distel and Fernandez 1986). Redman (1973)
MONTHS ‘s~MAMJJASONO~&FMAMJJASONDJ~
I. 1 I, 1 I I, I1 I, I, 1, 1, 1
--_ S.tcnuis
-. _ P subbulbosum
Fib. 4. -Qaf water potentials at 1400. For each date. values with the same letter are not significantly dlLferent P~.OJ).
reported similar findings by R.T. Coupland for a natural grazing area in Canada dominated by perennial winter grasses, where 67% of the roots were in the top 15 cm of soil.
Williams and Markley (1973) reported that many species that grow in the cool season carry out photosynthesis via the Calvin cycle (Cs). Unpublished observations from our laboratory show that both P. napostaense and S, tenuis have a leaf anatomy typical of Cs plants (Esau 1977). According to Black (1971), the highest rates of photosynthesis in Cs plants occur at temperatures between 10 and 25O C. It has also been reported that grasses from temperate climates have a high rate of potential transpiration compared with grasses from tropical climates (Downes 1969). These characteris- tics permit rapid growth of P. napostaense and S. tenuis in the autumn and at the commencement of spring when the temperature is optimal and.when water is usually available in the soil.
The low leaf conductances of P. subbulbosum would account
for
its higher leaf water potentials than the cool-season species at 1400, when soil water potential was above -0.5 MPa. Barnes and Harri- son (1982) reported that the Cs grasses they studied showed higher maximum leaf conductances and hence higher transpiration rates and lower leaf water potentials than the Cd grasses they studied when soil moisture was abundant.The daily course of leaf water potential in P. subbulbosum under drought conditions differ from the pattern reported by Sala et al. (1981) who observed that Cd species in a natural rangeland of the Depresion de1 Rio Salado in Argentina did not reduce their range of daily variation in leaf water potential under conditions of water deficit, showing a capacity to revert daily to relatively high levels of leaf water potential. Barnes and Harrison (1982) underscored the importance of the ability of the roots of G Andropogon halliiand Calamovilfa longifolia to exploit the deeper soil layers for water,
206
which is sometimes the only available source of water during the hot season. In the present case, it is proposed that the shallowness of the soil profile (40-60 cm) affects the water relation of P. subbulbosum during the periods of more severe drought, not allowing the leaves of this species to revert daily to a situation of a relatively high water status; a strong correlation was observed between the leaf water potential and soil water potential at 10 and 30 cm depth.
Literature Cited
Ramez, P.W., and A. Tyrone Harrison. 1982. Species distribution and community organization in a Nebraska Sandhills Mixed Prairie as influ- enced by plant/soil water relationships. Oecologia (Bcrl) 52: 192-201. BIack, C.C. 1971. Ecological implications of dividing plants into groups
with distint photosynthetic production capacities. Adv. Ecol. Res. 787-l 14.
Cabrerz, A.L. 1976. Regiones fitogcograficas argcntinas. Enciclopedia Argentina de Agricultura y Jardincria. Tomo II. Fast. 1. Acme, Buenos Aires.
Distel, R.A., and O.A. Fcrnhdez. 19%. Productivity of Sfipa tenuis Phil. and Rptochaetium napostaense (Speg.) Hack. in semiarid Argentina. J. Arid Environ. (in press).
Downez, R.W. 1969. Differences in transpiration rates between tropical and temperate grasses under controlled conditions. Planta 88:261-273. Esau, K. 1977. Anatomy of seed plants (2nd cd.). John Wiley and Sons,
New York.
Kramer, P.J. 1969. Plant and soil water relationships-A modem synthc- sis. McGraw-Hill Book Co., New York.
Kramer, P.J. 1980. Drought, stress, and the origin of adaptations p. 7-20. In: N.C. Turner, and P.J. Kramer (eds.), Adaptation of plants to water and high temperature stress. John Wiley and Sons, New York.
Instituto Nadonal de Tecnologia Agropecuaria, Prov. de La Pampa y Univ. Nat. de La Pampa. 1980. Inventario integrado de 10s recursos naturales de la provincia de La Pampa. ISAG, Buenos Aires.
Redman, R.E. 1973. Plant water relationships. Univ. Saskatchewan, Mat- ador Project. Tech. Rep. No. 29.
Richter, H. 1976. The water status in the plant-Experimental evidence, p. 42-58. In: O.L. Lange, L. Kappen, and E.D. Schulze (eds.), Water and plant life. Springer-Verlag, New York.
Sala, O., A. Soriano, and S. Perelman. 1981. Relaciones hidricas de algu- nos componentes de un pastizal de la Depresion de1 Salado. Rev. Fat. Agr. 2:1-10.
Schokmder, P.F., H.T. Hammel, E.D. Bradstreet, and E.A. Hemmingsen. 1965. Sap pressure in vascular plants. Science 148339-346.
Snedecor, G.W., and W.G. Co&ran. 1971. Metcdos Estadisticos. Com- pafiia Editorial Continental, Mexico.
Turner, N.C., and J.E. Begg. 1978. Responses of pasture plants to water deficits, p. 50-66. In: J.R. Wilson (ed.), Plant relations in pastures. CSIRO, Melbourne.
Van Wambeke, A., nnd C.O. Scoppa. 1976. Las taxas climaticas de 10s suelos argentinos. Rev. Inv. Agrop. Serie 3:7-19.
Walter, H. 1977. Zonas de vegetation y clima. Omega, Barcelona. Wiebe, H.H., G.S. Campbell, W .H. Gardner, S.L. Rawlins, J.W. Gary, and
R.W. Brwn. 1971. Measurement of plant and soil water status. Bulletin 484. Utah Agr. Exp. Sta.