TABLE OF CONTENTS:
Vol. 41, No. 4, July 1988
ARTICLES Grazing Svstems 214
219
282
287
291
J&&cation for grazing fntensity experiments: Analysing and interpreting grazing data by D.I. Bransby, B.E. Conrad, H.M. Dicks, and J.W. Drane
Grazing, stocking, and production efficiencies in grazing research by David L. Scamecchia
Cattle, vegetation, and economic responses to grazing systems and grazing pressure by Richard H. Hart, Marilyn J. Samuel, Peter S. Test, and Michael A. Smith Vigor of needlenndthread and blue grama after short duration grazing by P.E. Reece, R.P. Bode, and S.S. Waller
Vegetation response to the Santa Rita grazing system by S. Clark Martin and Kieth E. Severson
296
303 307 309
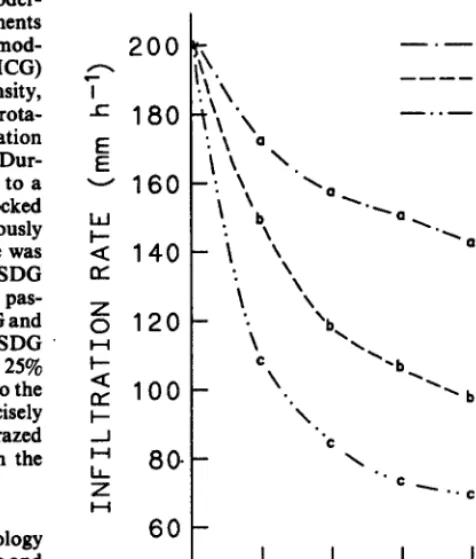
Infiltration and interrill erosion responses to selected livestock grazing strategies, Edwards Plateau, Texas by Thomas L. Thurow, Wilbert H. Blackburn, and Char- les A. Taylor, Jr.
Hydrologic impacts of sheep grazing on steep slopes in semiarid rangelands by Bradford P. Wilcox and M.K. Wood
Prediction of soil cover and soil rock for rangeland infiltration by Walter J. Rawls, Donald L. Brakensiek, J. Roger Simanton, and Clayton L. Hanson
Small-mammal mycophagy in rangelands of central and southeastern Oregon by Chris Maser, Zane Maser, and Randy Molina
Improvements
313 Herbicidal control of pricklypear cactus in western Texas by Joseph L. Petersen, Darrell N. Ueckert, and Robert L. Potter
317 Bionomics of patterned herbicide application for wildlife habitat enhancement by C.J. Scifres, W.T. Hamilton, B.H. Koerth, R.C. Flinn, and R.A. Crane
General Interest
322 Coyote and bobcat responses to integrated ranch management practices in south Texas by Lisa C. Bradley and Daniel B. Fagre
328 Association of the wheat stem sawfly with basin wildrye by Berta A. Youtie and James B. Johnson
Plant Physiology
332 Root growth of ArtemMa tridentata by Bruce L. Welch and Tracy L.C. Jacobson 335 Indian ricegrass seed damage and germination responses to mechanical treatments
by Larry W. Griffith and D. Terrance Booth Measurement
337 Cellulase vs rumen fluid for in vitro digestibility of mixed diets by Roy Lee Dickerson, Jr., Bill E. Dahl, and Gretchen Scott
Animal Ecology
340 Physical development of orphaned white-tailed deer fawns in southern Texas by Stephen Demarais, Robert E. Zaiglin, and Donald A. Bamett
Published bimonthly-January, March, May, July, September, November Copyright 1966 by thesociety for Range Management
INDIVIDUAL SUBSCRIPTION is by membership in the Society for Range Management.
LIBRARY or other INSTITUTIONAL SUBSCRIP- TIONS on a calendar year basis are $56.06 for the United States postpaid and $66.00 for other coun- tries, postpaid. Payment from outside the United States should be remitted in US dollars by interna- tional money order or draft on a New York bank. BUSINESSCORRESPONDENCE. concerning sub scriptions, advertising, reprints, back issues, and related matters, should be addressed to the Manag- ing Editor, 1639 York Street, Denver, Colorado 60206.
EDITORIALCORRESPONDENCE, concerning manu- scriptsorothereditorial matters, should beaddressed to the Editor, 1639 York Street. Denver, Colorado 60206.
INSTRUCTIONS FOR AUTHORS appear on the inside back cover of most issues. A Style Manual is also available from the Society for Range Manage ment at the above address @$2.00for single copies; $1.25 each for 2 or more.
THE JOURNAL OF RANGE MANAGEMENT (ISSN 0022-409X) is published six times yearly for $56.00 per year by the Society for Range Management, 1639 York Street, Denver, Colorado 60206. SECOND CLASS POSTAGE paid at Denver, Colorado. POSTMASTER: Return entllr Journal with l ddreu change-RETURN POSTAGE GUARANTEED-to Society for Range Management, 1639 York Street, Denver, Colorado 60206.
The Journal of Rango Management serves as a forum for the presentation and discussion of facts, ideas, and philosophies pertaining to the study, management, and use of rangelands and their several resources. Accordingly, all material published herein is signed and reflects the individ- ual views of the authors and is not necessarily an official position of the Society. Manuscripts from any source-nonmembers as well as members-are welcome and will be given every consideration by the editors. Submissions need not be of a technical nature, but should be germane to the broad field of range management. Editorial comment by an indi- vidual is also welcome and, subject to acceptance by the editor, will be published as a “Viewpoint.”
TECHNICAL NOTES
350 The grass spiklet formula: an aid in teaching and identification by Kelly W. Allred and J. Travis Columbus
351 Winterfat diaspore morphology by D. Terrance Booth
353 A quadrat frame for backcountry vegetation sampling by Donald L. Neal, Ray- mond D. Ratliff, and Stanley E. Westfall
355 A truck-mounted mobile screen for photodigital estimation of whole plant leaf area by R.J. Ansley, D.L. Price, B.K. Lawrence, and P.W. Jacoby
BOOK REVIEWS
359 Water Resource Management: A Casebook in Law and Public Policy. Third Edition. C.J. Meyers, A.D. Tarlock, J.N. Corbridge, Jr., and D.H. Getches; Inventory and Monitoring of Wildlife Habitat. Edited by Allen Y. Cooperrider, Raymond J. Boyd, and Hanson R. Stuart; Building Models for Conservation and Wildlife Management. by A.M. Starfield and A.L. Bleloch.
Managing Editor PETER V. JACKSON Ill
1639 York Street Denver, Colorado 80206 Editor
PATRICIA G. SMITH
Society for Range Management 1639 York Street
Denver, Colorado 60206 (303) 355-7070 Book Revbw Editor GRANT A. HARRIS
Forestry and Range Management Washington State University Pullman, Washington 99164-6410
ASSOCIATE EDITORS WILL BLACKBURN
N.W. Watershed Res. Center 270 South Orchard Boise, Idaho 63705 CARLTON BRITTON
Range &Wildlife Mgmt Texas Tech University Lubbock, Texas 79409 THOMAS A. HANLEY
Forestry Sciences Lab. Box 20909
Juneau, Alaska 99602 RICHARD H. HART
USDA-ARS 6406 Hildreth Rd. Cheyenne, Wyoming 62009
RODNEY HEITSCHMIDT Box 1656
Vernon, Texas 76364 N. THOMPSON HOBBS
Colorado Div. of Wildlife 317 W. Prospect
Fort Collins, Colorado 60526 PETE W. JACOBY, JR.
P.O. Box 1656 Vernon, Texas 76364 HOWARD MORTON
2000 E. Allen Road Tucson. Arizona 65719
BRUCE ROUNDY 325 Biological Sciences East Building, Univ. Arizona Tucson, Arizona 65721 PAUL TUELLER
Range Wildlife 8 Forestry UNR 1000 Valley Road Reno, Nevada 69512 RICHARD S. WHITE
KSU Extension Center Colby, Kansas 67701 STEVE WHISENANT
Justification for grazing intensity experiments: Analysing
and interpreting grazing data
D.I. BRANSBY, B.E. CONRAD, H.M. DICKS, AND J.W. DRANE
Abstract
Grazing trials in which treatments are compared at only 1 gru- ing intensity greatly outnumber those in which treatments are
compared at several grazing intensities. This suggests that, com- pared to other treatments and the need for replication in grazing trials, researchers consider grazing intensity lower in priority. In this study, a regression modeling approach for analyzing and interpreting data was developed to enhance the vahte of grazing intensity trials. As an example, results from 5 irrigated bermuda- grasses (Cynodon dkctylon (L.) Pen) (Caliie, Coastal, Brazes and experimental hybrids S-54 and S-16) which were continuously grazed without field replication by Santa Gertrudis steers at 4 grazing intensities were considered. The relationships between average daily gain (ADG) and stocking rate, ADG and herbage
present (ML/ha), and between stocking rate (animals/ha) and herbage present were well described by linear functions for all cultivars, with correlation coefficients(r) mostly above 0.9. CaM- cients of determination (R*) for linear regression models derived for ADG vs stocking rate, ADG vs herbage present, and stocking rate VI herbage present were 0.90**, 0.89++, and 0.87**, respec- tively. Significant cultivar X grazing intensity (as measured by stocking rate or herbage present) interactions (p10.01) were observed. Furthermore, estimated stocking rates which provided maximum gain/ha ranged from 6.6 to 9.4 animals/ha, and the range in herbage present which provided maximum gain/ha was 0.35 to 1.95 Ml/ha. Callie provided an estimated maximum gain/ha of 881 kg/ha/season, while maximum gain/ha for the other cultivars ranged from 613 to 687 kg/ha/season. Comparison between these 5 cuitivars at only 1 grazing intensity would have had very narrow application. The procedure described allowed statisti- cal comparison of cultivars without replication, and inferences
about the separate effects of forage quality and quantity on animal performance could be made. Herbage present and cultivu were descriptors of the pasture. Since there was a substantial range of values for herbage present and stocking rate, ail important
assumptions underlying linear regression were met and designs utilized in analysis of variance were not needed.
Key Words: average daily gain, gain/ha, stocking rate, herbage present, Cynodon dactylon
An increase in stocking rate on continuously grazed pastures (for clarity, only continuous grazing is considered in this discus- sion) leads to increased frequency of plant defoliation, decreased stubble height, and reduced mass of herbage present/ ha (herbage present). Collectively, these responses represent an increase in “grazing intensity,” a term which incorporates both stocking rate and its effects on the pasture, as well as concepts such as grazing pressure. Since grazing intensity can be manipulated by adjusting animal numbers, it is a fundamental variable under the control of the grazier. Additionally, it has a pronounced effect on animal production and profit. Grazing intensity is therefore of very great importance to both producers and researchers.
Authors are associate professor, Dep. of Agronomy and Soils, Alabama Agr. Exp. Sta., Auburn University, Alabama 36849; associate professor, Dep. of Soil and Crop Sciences, Texas A L M University, College Station, TX 77843; lecturer, Dep. of Statistics and Biometry, University of Natal, Pictcrmaritzburg, South Africa; and professor, Dep. Research Data Analysis, Ala. Agr. Exp. Sta.. Auburn, University, Alabama 36849.
Auurovcd bv the Director. Alabama Apr. EXD. %a.. as AAES Journal No.
3-87%44. ’ _ s
Manuscript accepted 14 March 1988.
Brown and Wailer (1986) have emphasized the undisputed value of replication in grazing studies. However, due to logistical and cost limitations, replication in grazing trials usually excludes graz- ing intensity or treatments other than grazing intensity. For exam- ple, most comparisons between replicated grazing treatments have included only one grazing intensity per treatment. Alternatively, grazing intensity trials have usually excluded other treatment comparisons. In other words, grazing intensity trials have usually been concerned mainly with the effects of grazing intensity per se, rather than the interaction of grazing intensity with other treat- ments: seldom has a number of treatments been compared at several grazing intensities. Consequently it appears that, with the exception of only a few researchers, inclusion of grazing intensity in grazing trials is considered lower in priority than additional treatments and the need for replication. Bums et al. (1970) emphas- ized some advantages of a multiple grazing intensity strategy, while Hart (1972) suggested that in certain cases it might be preferable to forfeit replication in favor of grazing each treatment at several grazing intensities. On the other hand, Walker and Richardson (1986) contend that despite the difficulties experienced with repli- cation in grazing experiments, “the nonreplicated experiment should be considered the design of last resort.” Disagreement therefore exists concerning the experimental design and approach which will optimize the value of data from grazing studies.
Riewe (1961) proposed a nonreplicated stocking rate design for grazing trials, but considered only 2 treatments each grazed at 3 stocking rates. However, his proposal received little subsequent support. The objectives of this paper are to justify wider use of grazing intensity experiments by (a) extending the approach of Riewe (1961) to include more than 2 treatments, and (b) developing an interpretive procedure that will enhance the value of grazing intensity trials which may or may not be replicated. As an example, previously published data (Conrad et al. 1981, Guerrero et al. 1984) from a nonreplicated grazing trial on 5 bermudagrasses (Cynodon dactylon (L.) Pers) each grazed at 4 grazing intensities are considered.
Procedure Data Collection
Details of data collection have been abbreviated here because they have been published fully elsewhere (Conrad et al. 1981, Guerrero et al. 1984) and because the emphasis here is on analysis, interpretation, and modeling, rather than on the results of a partic- ular field trial. The data presented, therefore, serve only as an example in pursuit of the objectives stated above.
Tabk 1. Rtyadon com4anta and correhtion ~caeffkknts (r) for 3 nhtiomtdpa (equationa 1, 2 md 3) determined nqmmtely for data from 5 bermudagrasmm.
ADG vs stocking rate
Regressions
ADG vs herbage present Stocking rate vs herbage present
cultivar Coastal callie S-54 Brazes S-16
General equations
ADG = bg + blS (1) ADG = bo’ + b/H (2) S = bo” + bl”H (3)
bo br rs+ M bi r++ bo” br” r+*
0.93 -0.050 -0.95 0.27 0.14 0.95 13.28 -2.73 -0.99
1.32 -0.075 -0.99 0.37 0.15 0.99 12.65 -2.02 -0.99
1.23 -0.093 -0.96 0.35 0.15 0.99 9.20 -1.49 -0.94
1.13 -0.070 -0.93 0.35 0.17 0.88 10.93 -2.35 -0.91
1.24 -0.086 -0.99 0.56 0.10 0.92 7.81 -1.14 -0.89
**A0 I vslucs aignifiint (#%0.01,10 df).
Supplementary irrigation was provided to maintain active growth. Herbage present was estimated at 28day intervals, and a mean of these for the whole season was used in the analysis. In 1977 and
1979 it was visually rated and in 1978 it was estimated by harvesting 5 randomly located 0.9 X 3-m strips from each pasture using a flail-type harvester. A 0.18-m* sample was harvested by hand to ground level in each mower strip and stubble mass was included in the estimate of herbage present. Clipped samples of herbage pres- ent were analyzed for in vitro digestible dry matter.
AnalYds
Regression Relationships
The parameters /30 and /31 measure the intercept and slope, respec- tively, of the line for the “control”cultivar (arbitrarily chosen), and /30j and gij the differences in intercept and slope between cultivar j and the control cultivar. The dummy coefficients j take on values 0 for the control and 1 for the jth subsequent cultivar.
Supplementary irrigation ensured low year-to-year variation in results. Analysis was therefore conducted on the 3-year mean stocking rate (!I), average daily gain (ADG), and herbage present (H) for each grazing intensity on the 5 cultivars. The average stocking rate for each grazing intensity was calculated by dividing total animal grazing days/ha by the number of days in the grazing season. Previous grazing intensity studies have concentrated mostly on relating production/animal and/ha to stocking rate (Riewe 1961, Riewe et al. 1963, Jones and Sandland 1974, Bransby
1984). However, this essentially means that animal performance is related to animal numbers, thus providing little information on the pasture.
In terms of this model, a test of the null hypothesis pi1 = 0 is equivalent to testing whether the lines for cultivar j and the control are parallel. If any such test is not significant, that term pi1 may be set to zero, which reduces the model by 1 term and recognizes that the control and jth lines are parallel. If, after accepting the null hypothesis 811 =O, a test is made forflq = 0 and this is also accepted, the control and jth line are in effect reduced to one co-incident line. In each case, the error term used was the pooled residual or error sum of squared deviations from regression. A procedure of this nature was followed, testing for parallelism and co-incidence until the model was reduced to its simplest form. Similarly, the relations between ADG and herbage present (equation 2) and between stocking rate and herbage present (equation 3) were also considered.
Derived Relationships
Although ADG has been related to grazing pressure (kg fora- ge/animal/ day) or forage allowance (kg forage/animal) (Peterson et al. 1965, Hart 1972, Adjei et al. 1980, Guerrero et al. 1984), this has more relevance for rotational grazing. The responses of gain/- animal and /ha to average herbage present over the season would appear to have more relevance for continuous grazing, but these have seldom been examined. Neither has the relation between stocking rate and herbage present been carefully considered. Without this information it is difficult to determine whether pas- ture quality or quantity causes differences between treatments, and the level of herbage present that yields maximum gain/ ha cannot be determined. Consequently, separate linear regressions were used initially to relate ADG to stocking rate, ADG to herbage present and stocking rate to herbage present for each cultivar. Although it is recognized that in reality these relationships may not be linear over the full range in grazing intensity, it has commonly been found that linear functions provide good approximations over a limited range in grazing intensity (Riewe 1961, Riewe et al. 1963, Cowlishaw 1969, Hart 1972, Jones and Sandland 1974, Hart 1978, Bransby 1984). Hence, based on this assumption,
The relationship between seasonal gain/ ha(G) and stocking rate can be derived from equation (1):
G q S X ADG X 151 = S(bc, + brS) X 151 = (b& + blS) X 151 [4]
where 151 is the number of days in the grazing season. Two methods can be used to derive a relationship between gain/ ha and herbage present. Method 1 involves substituting equa- tion 3 into equation 4:
G = bo (ba + bFH) + br (b6 + bPH)2 X 151 [51 In method 2, the product of equations 2 and 3 is multiplied by 15 1:
G=(M+bfH)(b”o+brH)XlSl
161
These mathematical links between grazing variables are illustrated diagramatically in Figure 1.
Estimating Maximum Gain/ha
The stocking rate at which maximum gain/ha occurred (S max) was estimated by equating the first derivative of equation 4 to 0 and solving for S. The level of herbage present which resulted in maxi- mum gain/ ha (H max) was estimated by substituting any of these 3 values back into the original equations.
Results and Discussion
ADG q b. + blS
111
ADG = b’, + b’lH
121
and S q b”., + b”lH c31
Considering equation 1, the regression lines for the 5 cultivars were compared by using dummy variables (Draper and Smith 1966). A model was set up as follows:
4 4
ADG = PO +,?l aj Boj + /31 S + 3 ~~jj91jS J=l
Regression Relationships
Linear regressions provided good approximations for these grazing intensity data, thus corroborating the findings of others at least in respect of the ADG vs stocking rate relationship (Riewe 1961, Riewe et al. 1963, Cowlishaw 1969, Hart 1972, Jones and Sandland 1974, Hart 1973, Bransby 1984). Correlation coefficients (r) for linear regression relationships determined separately for
GAIN
i
2
:
.
I-
IA-‘(G)
1
G,
RATE (S)
PRESENT
(HI
Fig. 1. Maihematical links between grazing variables.
2 0.8 V (3 s
0.4
-$-
-z
COASTAL7
lCALLIE
and COASTAL- 0 0 CALLIE
14
BRAZOS+ BRAZOS, S-16, and S-54
12
*
4 8 12
STOCKING RATE (animals/ha)
Fig. 2. A linear regression model relating ADG to stocking rate for 5 bermudagrasses. (b@ations: Coastal, y = 0.93 - 0.050x; Collie, y = 1.36 - 0.079x; Brazes, S-16 and S-54, y = 1.18 - 0.079x)
each cultivar were mostly above 0.90 (Table 1). Coefficients of determination (fl) for the regression models established were 0.90 for ADG vs stocking rate (Fig. 2), 0.89 for ADG vs herbage present (Fig. 3) and 0.87 for stocking rate vs herbage present (Fig. 4). All these values were significant (P50.01). Here it should be emphas- ized that Rz indicated the percent variation in all the data (5
5
3
0.6
x
a
0.4
0.2
. CALLIE, BRAZOS
l and S-54>-a+’
COASTAL
0’
.
0
1
2
3
4
5
HERBAGE
PRESENT
(Mg/ha)
Fig. 3. A linear regression model relating ADG to herbage present for 5 bermudagrasses. (Equations: S-16, y = 0.56 + 0.101x; Callie, Brazes and S-54, y = 0.37 + 0.154x; Coastal, y = 0.24 + 0.154x).
O- 0
8
5
4
2
1
2
3
4
5
HERBAGE
PRESENT W/ha)
cultivars by 4 intensities) accounted for by the models, and each of the 3 models consisted of 3 regression lines, 2 of which were parallel. Consequently, each R2 value was based on 14 residual degrees of freedom. Furthermore, equations describing the linear functions presented in the models, and which appear with the appropriate figures, differ slightly from those in Table 1 as a result of eliminating all differences between individual regression coefti- cients which were not statistically significant.
Steers grazing Callie gained at a higher rate (KO.01) than those grazing Brazos, S-54 and S-16 at equivalent stocking rates (Fig. 2). However, due to the general decline in ADG as stocking rate increased, the relative advantage of Callie was greater at high stocking rates; e.g., at 6 steers/ha ADG on Callie was 25% higher than on Brazos, S-54 and S-16, while at 10 steers/ ha the difference was 58%. Furthermore, as stocking rate increased, animals grazing Coastal showed a lower rate of change in ADG than the other cultivars (pSO.Ol), indicating a stocking rate X cultivar interac- tion. Stocking rate affected ADG through its effect on quantity and quality of herbage. The ADG vs stocking rate response conse- quently represents the combined effect of these 2 variables on animal performance. Hence, for more detailed interpretation of results it is necessary to study separately the response of ADG and stocking rate to herbage present.
Assuming that herbage intake and ADG are influenced by her- bage quality and herbage present only, then any difference among cultivars in ADG at a given level of herbage present will be due to quality differences. Higher ADG (m.01) was observed on Callie, S-54 and Brazos than on Coastal at equivalent levels of herbage present (Fig. 3). As herbage present increased, S-16 showed a lower rate of change in ADG than the other cultivars, indicating a herbage present X cultivar interaction. However, the model sug- gests that below 2 Mg/ ha of herbage present the ADG on S-16 was higher than on the other cultivars. To a certain extent, these results were supported by digestibility data; average in vitro digestible dry matter of herbage present was 52.3% for Coastal, 60.6%, 56.1%, and 57.1% for Callie, S-54, and Brazos respectively, and 58.5% for S-16. At 1.5 Mg/ ha of herbage present, estimated ADG from the common regression for Callie, S-54, and Brazos and from the single regression for S-16 was 28% and 51% higher, respectively, than for Coastal. This response became relatively more pro- nounced as herbage present decreased, and is interpreted as a combination of the direct effect of quality on ADG and its indirect effect via its influence on intake. Extrapolation of the ADG vs herbage present regressions (Fig. 3) suggests that appreciable gain is possible at 0 herbage present. Firstly, such extrapolation is not valid since 0 herbage present is beyond the limits of the data. Secondly, the remarkably high ADG’s observed at very low levels of herbage present may be explained by the high resistence of bermudagrass to heavy grazing: the sod-forming nature of these cultivars allowed dry matter to be produced under heavy utiliza- tion and this was removed on a daily basis by animals, resulting in little accumulated herbage present at any one time. Finally, the quality of forage consumed under heavy stocking is likely to be high due to low contamination with mature, accumulated herbage present compared to lightly stocked pastures.
The relationships between herbage present and stocking rate reflect the changes in carrying capacity of cultivars with grazing intensity. Callie and Coastal carried more animals (KO.01) than Brazos at equal levels of herbage present. In addition, as herbage present increased, stocking rate decreased at a higher rate (KO.05) for these 3 cultivars than for S-54 and S-16, again indicating an interaction between herbage present and cultivars (Fig. 4). The implication here is that Callie and Coastal can carry more animals than the other cultivars at a given level of herbage present. This is extremely pronounced at levels of herbage present below 2.5 Mg/ha. At 1.5 Mg/ ha of herbage present, the estimated stocking rate for Callie and Coastal was 26% higher than for Brazos, and 43% higher than that on S-54 and S-16. The latter cultivars can
therefore be considered to have a low carrying capacity. An alter- native interpretation is that, at medium to high stocking rates in particular, their capacity to maintain herbage present is low rela- tive to Callie and Coastal.
Simultaneous examination of figures 2, 3 and 4 facilitates further interpretation. The inferred low quality of Coastal (Fig. 3) suggests that herbage intake by each animal was lower on this cultivar than on the others. Coastal should therefore be able to carry more animals, and this is confirmed by the higher stocking rates shown for Coastal in Fig. 4. The net result is that, on average, animals on Coastal perform no better than those grazing the other cultivars. However, due to its inferred low quality and consequent high carry capacity, relative to the other cultivars it had an increased ability to produce ADG’s as stocking rate increased (Fig. 2).
Conversely, due to the inferred high quality (as indicated by ADG) of S-16 (Fig. 3), herbage intake on this cultivar is likely to be high. This resulted in a relatively low carrying capacity (Fig. 4) and, over a wide range in stocking rates, similar gains to all other cultivars except Callie (Fig. 2). However, the inferred medium quality of Callie (Fig. 3) and its high carrying capacity (Fig 4) resulted in the highest gains within the limits of the stocking rate data (Fig 2). These results are in agreement with those of Riewe et al. (1963) who showed that more animals could be carried on tall fescue, which had low quality (or perhaps an antiquality factor) compared to annual ryegrass, which had high quality. However, gains on tall fescue were lower than those on ryegrass.
While it is recognized that averaging over years resulted in a loss in information, the possibility of examining between-year varia- tion within treatments in a similar comparison to that between treatments described above should not be overlooked. Further- more, in several cases data presented in figures would have been described better by nonlinear functions. However, the aim was not to maximize the ZP value (this would probably be achieved by fitting separate functions to the data from each cultivar), but rather to eliminate all insignificant differences from the model while retaining an adequate description of the data. In this sense compar- isons among the “average slopes” and “vertical separation” of linear regression lines for different cultivars appeared to success- fully serve the purpose.
In the broadest sense, research is aimed at explaining variation in experimental data. Statistical differences are indicated when variance which can be explained is relatively large compared to variance which cannot be explained (experimental error). The non-replicated, multiple grazing intensity approach described above made use of this general principle, but was unable to isolate inherent variation among pastures. However, neither is analysis of variance capable of isolating this variance, since it assumes additiv- ity and no treatment X replication interaction. Snedecor and Cochran (1967) indicate that there is no assurance that this assumptionapplies. Inaddition, inherent variationamong pasture-herd
units has plant and animal sources of variation confounded. Since plant variation is likely to be expressed mainly as differences in forage yield, the regression of ADG on herbage present in this study represents an attempt to separate these sources of variance in a strategy similar to analysis of covariance (with herbage present as a covariate) in a replicated experiment.
Derived Relationships
Relationships describing changes in gain/ ha with stocking rate and herbage present were derived for each cultivar from the initial linear regression equations (Table 1). In all cases the range in stocking rates applied included Smax, thus meeting an important specification prescribed by Connolly (1976) for this procedure (Fig. 5). Although cultivars differed considerably in Smax, there was a wide range in stocking rate within which gain/ ha changes by a relatively small amount. For example, between 6.1 and 11.6 animals/ ha, gain/ ha was within 9% of maximum for Callie. This relative insensitivity of gain/ ha to grazing intensity is even more
YC’
L . t4
8
12
16
STOCKING RATE
(animabiha)
Fig. 5. Derived relationships (equation 4) between gain/ha and stocking
rate for 5 bermullagrasses. (Equations: Coastal, y = 0.93~ - 0.050~2; Caliie, y q 1.32~ - 0.75~s: Brazes. y q 1.13.x - 0.070~s; S-54, y q 1.23x -
0.093~s: S-16, y q 1.24x - 0.086x*).
evident when examined in relation to herbage present (Fig. 6). In terms of gain/ ha, therefore, grazing systems on bermudagrass appear to be well buffered against changes in grazing intensity in the region of Smax and Hmax. Additionally, these results emphas- ize the dependence of relative differences among cultivars in gain/ ha on level of herbage present.
a
1.0E
f
O-8 /
,---1,
i
i
I
\
\
__
d
f
a . ‘v) 0 1
2
3 4 5HERBAGE PRESENT
(Mg/ha)
Fig. 6. Derived relationships (equation 5) between gain/ha and herbage
present for Collie. S-16 and S-54. (Equations: CalIt& y = 4.68 + 1.15x - 0.30x? S-54, y = 3.22 + 0.86x - 0.22~2: S-16, y q 4.37 + 0.14.x - 0.1 Ix’).
The estimated Hmax differed relatively more among cultivars than Smax (Table 2) and differed slightly, depending on which equations were used in their derivation. However, this had little effect on the ranking of cultivars. The relatively high Smax and Hmax for Callie suggests a high carrying capacity, as does the high Smax for Coastal. The low Smax and Hmax values for S-16 are indicative of a low carrying capacity.
Estimation of Gmax by means of 3 different equations showed little variation in estimates and did not alter ranking of cultivars (Table 2). The high and low Gmax for Callie and Coastal, respec- tively, resulted mainly from the difference between these cultivars in ADG (Fig. 3). Despite low carrying capacity, Gmax for S-l 6 was
Table 2. The stocking rate (Smax) and level of herbage present (Hmax) wbicb result In maximum beef galn/ba and maximum gain/ha (Gmax)
aUnsated from 3 dlffermt cqm&na for 5 bum&gmmm.
(~ua~otts:(4)G=(b~S+b~W)X151;(5)G=bg(bf’+b,H)+bl~“+ bt”H)1 X 151 and (6) G = (be’ + bl’H)(bo” + bl”H) X 151.
smax
Estimated HIllax
from Equations used for Gmax
equation estimate: Equations used for estimate:
Cultivar (4) (5) (6) (4) (5) (6)
a,,i,.n& ha-’ -_Mg ha-‘-.- ---_kg ha-‘---
Coastal Callie S-54 Brazes S-16
9.41 1.41 1.45 663 655 662
8.85 1.89 1.91
R
881 882
6.60 1.75 1.95 613 619
8.05 1.22 1.30 687 686 687
7.22 0.35 0.64 676 673 672
marginally higher than that for Coastal as a result of its apparent
high quality.
Conclusions
Logistical and financial constraints usually force a compromise between treatments and replication in grazing studies. If the trial described in this study had been replicated twice, it would have required 40 fenced paddocks, 120 tester animals, and about 60 filler or grazer animals. A possible compromise would have been to graze the 5 cultivars at 3 intensities with 2 replications, but even this would have increased the scale of the experiment by one half. Testing for differences among different grazing intensities on the same cultivar and for linearity requires replication. However, compared to testing differences between grazing intensity regres- sions for different cultivars, such issues may be considered less important.
The regression modeling approach and interpretive procedure described in this study had the following advantages: (a) statistical comparisons of several treatments could be made without field replication provided each treatment is applied at several grazing intensities; (b) inferences could be made about the separate effects of forage quality and quantity on animal performance; (c) cultivars could be compared at any given grazing intensity or alternatively, in terms of their maximum gain/ ha, even though this occurred at different grazing intensities, and (d) the production functions deve- loped facilitate a functional approach to economic analysis. It is clear that a comparison of cultivars considered in this study but using only 1 grazing intensity would have had narrow application. There could be no estimate of Smax, for example. Furthermore, since it is quite possible that many treatment X grazing intensity interactions may exist in grazing systems, results from other graz- ing trials which employed only 1 grazing intensity may apply only to that grazing intensity used. Many questions, however, remain unanswered: e.g., would partial replication have been a useful compromise, how successful would the nonreplicated approach be if the experimental site had been less uniform and if the trial had been conducted under rain fed conditions, and does the procedure have application for both continuous and rotational grazing?
Literature Cited
Adjei, M.B., P. Misievy,md C.Y. Ward. 1980. Response of tropical grasses to stocking rate. Agron. J. 72863-868.
Bra&y, D.I. 1984. A model for predicting livemass gain from stocking rate and annual rainfall. J. Grassl. Sot. Sth. Afr. 1:22-26.
Brown, M.A., and S.S. Walk. 1986. The impact of experimental design on the application of graxing research results-an exposition. J. Range Manage. 39: 197-200.
Bums, J.C., R.D. Mochrie, H.D. Gross, H.L. Lucas, and R. Teichman. 1970. Comparison of set-stocked and put-and-take systems with growing heifers g&zing Coastal bermudagra& (Cynodon dhcrylon L. Pers). p 904909. In: M.J.T. Norman led.) Proc. 11th Int. Grassl. Conar. Univ. . I
Queensland Press, Brisbane,
Burton, G.W., R.H. Hart, and R.S. Lowrey. 1967. Improving forage quality in bermudagrass by breeding. Crop Sci. 7:329-332.
Cowllshaw, S.J. 1969. The carrying capacity of pastures. J. Brit. Grassl. Sot. 24:207-214.
Draper, M.R., and H. Smith. 1966. Applied regression analysis. John Wiley & Sons, Inc., New York.
ConnoIIy, J. 1976. Some comments on the shape of the gain-stocking rate curve. J. Agr. Sci. 86: 103-109.
Conrad, B.E., E.C. Holt, and W.C. Ellis. 1981. Steer performance on Coastal, Callieand other hybrid bermudagrasses. J. Anim. Sci. 53: 1188-l 192. Guemro, J.N., B.E. Conrad, E.C. Holt, end H. Wu. 1984. Prediction of
animal performance on bermudagrass pasture from available forage. Agron. J. 76577-580.
Hart, R.H. 1972. Forage yield, stocking rate, and beef gains on pasture. Herb. Abstr. 42:345-353.
Hart, R.H. 19711. Stocking rate theory and its application to grazing on rangelands. Proc. 1st Mt. Rangeland Congr. 547-550.
Jones, R.J., and R.L. Sandleod. 1974. The relation between animal gain and stocking rate. J. Agr. Sci. Camb. 83606-611.
Mott, G.O. 1960. Grazing pressure and the measurement of pasture pro- duction. Proc. 8th Int. Grassl. Congr., Reading, England: 606-611. Peterson, R.G., H.L. Lucas, end G.O. Mott. 1965. Relationship between
rate of stocking and per animal and per acre performance on pasture. Agron. J. 57:27-30.
Riewe, M.E. 1961. Use of the relationship of stocking rate to gain of cattle in an experimental design for graxing trials. Agron. J. 53:309-313. Riewe, M.E., J.C. Smith, J.H. Jones, and E.C. Holt. 1963. Grazing produc-
tion curves. I. Comparison of steer gains on Gulf ryegrass and tall fescue. Agron. J. 55:367-372.
Snedecor, G.W., and W.G. Cochran. 1967. Statistical Methods. Iowa State University Press, Ames, Iowa.
Grazing, stocking, and production efficiencies in grazing
research
DAVID L. SCARNECCHIA
The term ~urvcst efficicncv has been used with increasing fre- quency to describe results of intensive grazing management. A concept of lmrvest efficiency for grazed systems, i.e., a grazing efficiency concept compatible with the dynamics of herbage growth and disappearance is needed. This paper (1) describes variables and objectives needed in constructing a concept of gru- ing efficiency, (2) offers a formal definition of the term, (3) defines 2 other efficiencies related to grazing efficiency, and (4) discusses the interpretation and use of grazing efficiency and the other efficien- cies in grazing research. More effective application of the efficiency concepts will require improved methods of measuring or modeiing herbrge growth and disappearance.
Key Words: grazing systems, grazing management, harvest effi- ciency, herbage dynamics, standing crop
In recent years, several authors (Stuth et al. 198 1, Heitschmidt et al. 1982, Heitschmidt 1984, Walker 1984, Heitschmidt et al. 1987) have used the terms harvest efficiency or defoliation efficiency to evaluate and describe results of grazing trials. During this time, the explicit and implicit definition of harvest efjiciency has both evolved and varied, leaving a need for an improved conceptualiza-
Author is associate professor, Department of Forestry and Range Management, Washington State Unwenity, Pullman 991644410. The author thanks Drs. C.T. Gaskins and M.M. Kothmann for their helpful comments on the manuscript. Approved by the director, Washington State University College of Agriculture and Home Economics Research Center as Scientific Paper 7835, Project 0617.
Manuscript accepted 29 February 1988.
tion and definition of harvest efficiency for grazed systems, i.e., a grazing efficiency. This paper (1) briefly describes the variables and objectives needed in constructing a concept of grazing efficiency, (2) offers a formal definition of the term, (3) defines 2 other efficiencies related to grazing efficiency, and (4) discusses the inter- pretation and use of grazing efficiency and the other efficiencies in grazing research.
Constructing II Concept of Grazing Efficiency
Certainly some of the variation in the definition of grazing efficiency has resulted from efforts to construct a concept to fit available data, rather than obtaining data to fit an appropriate concept. The latter procedure is preferred and Figure 1 shows the 3 rate variables which add to or substract from standing crop (SC), and are important in defining grazing efficiency. The standing crop is dynamic, with both new herbage being added and existing her- bage disappearing at most times.
RATE OF DISAPPEARANCE
OTHER THAN INTAKE
HERBAGE GROWTH
RATE
STANDING CROP
RATE OF INTAKE
Fig. 1. A model of dynamics of herbage growth and disappearance, with standing crop and rate variables important in formulating a concept of grazing efficiency. Rate of disappearance = rate of intake + rate of disappearance other than intake.
A mathematical formulation of grazing efficiency which meets Stocking Level and Grazing Efficiency
these criteria is The methods of Stuth et al. (1981) and Heitschmidt et al. (1987) use stocking level (animal-unitdays(AUD)/ ha) in the calculation of grazing efficiency. There are some sound conceptual reasons not to do these without a direct, independent estimate of intake per animal-unit stocked. For example, Heitschmidt et al. (1987) esti- mated intake from the calculation [AUD/ ha]* [kg/ AUDI, where [AUD/ ha] is the stocking level and [kg/AUDI is a standardized intake/AUD conversion of 11.8 kg/AUD (Society for Range Management 1974). In that example, not only is the animal-unit being inappropriately used as a unit of intake (Scarnecchia 1985, Scarnecchia and Gaskins 1987), but without an independent esti- mate of intake, the calculated grazing efficiency becomes a direct and exclusive function of stocking level; i.e., double the stocking level, double the efficiency. Grazing efficiency should not be exclu- sively a function of animal numbers, animal-units, or stocking level, but should be sensitive to changes in total intake and cumula- tive herbage growth in Equation 1.
Equation 1 grazing
efficiency = total intake (t_b)
(during time Xl@N,
t-b) A X [cumulative herbage growth (1-b) + S&l
where the grazing efficiency (%) is calculated over a discrete period of time t-b, total intake [t-b) is the herbage intake during t-to of animals whose grazing efficiency is being calculated, cumulative herbage growth (CHG) (Scamecchia and Kothmann 1986) is the amount of new herbage growth per unit area during t-to, SC, is the standing crop (kg herbage per unit area) in the SC compartment (Fig. 1) at time b, and A is the area of land grazed.
As can be seen in Figure 1, grazing efficiency may also be calculated as:
Equation 2 Brazing efficiency = (during time t-b)
total intake (+b)
A X [cumulative herbage disappearance(t+ + SCt]
Xlow60,
where cumulative herbage disappearance (CHD) (Scamecchia and Kothmann 1986) is the amount of herbage per unit area leaving the standing crop during time t-b, including the amount of livestock intake and grazing by other herbivores.
The grazing efficiency calculated in equations 1 and 2 can refer to the efficiency of grazing of livestock alone and/ or other herbi- vores. Whatever intake is described in the numerators, Equations 1 or 2 wiil calculate the grazing efficiency for the appropriate animal or animals. In range livestock research, the grazing efficiency of livestock, calculated using the total herbage intake of livestock alone will most often be of interest. In any case, all intake contrib- utes to cumulative herbage disappearance in Equation 2.
The approach shown in Equations 1 and 2 has distinct concep- tual advantages over other recently published approaches. It differs from the method of Stuth et al. (1981) in which the denomi- nator in Equation 1 is replaced by a cumulative herbage disappear- ance (Scamecchia and Kothmann 1986) excluding intake, in that (1) grazing efficiency cannot be greater than lOO%, and (2) grazing efficiency represents the efficiency of harvest of both the standing crop at the beginning of grazing and the cumulative herbage growth during grazing.
Parallel Concepts
Animal-unitdays may be properly used in calculating a rela- tionship which is here termed stocking efficiency. The relationship of animal demand over a period of time t-to to both the standing crop at the beginning of grazing and the cumulative herbage growth during that time may be expressed as
Equation 3 stocking
efficiency q total animal demand (t_tnl
(during time \~ -,
t-b) A X [cumulative herhage growth (t-b) + SC&j ’ where total animal demand is expressed in AUD. Like grazing efficiency, stocking efficiency is defined over a period of time, but whereas grazing efficiency is an intake/supply relationship, stock- ing efficiency is a demand/ supply relationship. Stocking efficiency is not a unitless percentage as is grazing efficiency and has units of AUD/ kg. Also stocking efficiency does not have mathematical limits on its value, although in real systems its value is limited by realistic levels of animal demand and herbage. Analogous to graz- ing efficiency, stocking efficiency can also be described by the equation
Equation 4 stocking
efficiency q total animal demand (t-b)
(during time
t-b) disappearance(t-b) + A X [cumulative herbage
SGI
Also analogous to grazing efficiency, stocking efficiency may be calculated for any animal or animals whose units of demand may be modeled and summed for the numerators of Equations 3 and 4.
It may be considered a special variation of cumulative grazing pressure or grazing pressure index (Scarnecchnia and Kothmann
1982) one calculated using initial or final standing crops and cumulative herbage growth or disappearance, respectively.
Another parallel concept is derived by replacing the numerator of Equations 3 or 4 by a unit of animal production, so that
Equation 5 production eff=iency q
(during time
animal production (appropriate unit$o+)
t-to) A X [cumulative herbage growth(,+,) + SCr ]
Any appropriate unit (kg body weight, kg milk, kg wool, etc.) will serve in describing animal production, and the resulting efficiency describes the amount of animal production relative to both the standing crop at the beginning of grazing and the herbage growth during grazing. A production efficiency is described in (units of animal production/ units of herbage), and is a production/ supply relationship parallel to stocking efficiency. There are no mathe- matical limits on its value; it may be negative if animal production is negative. Analogous to both other efficiencies, it may be altema- tively defined as
Equation 6 production efficiency = (during time
animal production(appropriate units)(r+ .
t-to) A X [cumulative herbage disappearance+b) + SC,]
Like the other efficiencies, production efficiency may be calculated for any animal or animals whose units of production may be measured or modeled and summed for the numerators of Equa- tions 5 and 6.
Interpretation and Use and Grazing, Stocking and Production Efficiencies
The 3 efficiencies (Equations l-6) would usually be calculated on an herbage dry matter basis, but if advantageous for specific objec- tives, they may also be calculated on a wet basis. The 3 efficiencies may be calculated for animals grazing different forages, animals grazing at different stocking densities, different kinds or classes of animals grazing the same.forages, or any of the many comparisons possible in case studies of livestock grazing (Scamecchia 1988). If periods of grazing are 1 or 2 days, and rates of herbage growth and non-intake disappearance are slow, they may be assumed to be insignificant, and pre-harvest and post-harvest clipping, along with a direct independent estimate of intake may give reasonably accurate calculations of grazing efficiency. If herbage growth or non-intake disappearance is rapid, or if t-to exceeds a few days,
accurate estimates of either CHG or CHD will be needed so that values of harvest efficiency and the other efficiencies are not over- whelmed by propagated error. Clean, simple methods of estimat- ing CHG and CHD await development. Most existing methods are of questionable accuracy and are time consuming (Davies 1981). Empirically based simulation methods may be the best prospects.
Grazing efficiency or the other 2 efficiencies should not be maximized independent of other considerations. As defined in this paper, they are derived variables relating intake, animal demand, and animal production, respectively, to a dynamic description of aboveground herbage. They should be used along with approp- riately chosen stocking variables and herbage characteristics to scientifically describe and fine-tune grazing to meet the objectives of management.
Literature Cited
Davies, A. 1981. Tissue turnover in the sward. Chapter 9. In: J. Hodgson, R.D. Baker, A. Davies, A.S. Laidlaw, and J.D. Leaver, eds. Sward measurement handbook. British Grassl. Society, Berkshire, U.K.
Heitschmidt, R.K., J.R. Frasure, D.H. Price, and L.R. Rittenhouse. 1982.
Short duration grazing at the Texas Experimental Ranch: weight gains of growing heifers. J. Range Manage. 35:375-379.
Heitschmidt, R.K. 1984. The ecological efficiency of grazing management.
p. 378-385. In: Proc. Forage and Grassland Conference, Houston, Texas,
January 23-26.
Heitsehmidt, R.K., S.H. Dowhower, and J.W. Walker. 1987. l4- vs. 42 paddock rotational grazing: aboveground biomass dynamics, forage production, and harvest efficiency. J. Range Manage. 40:216-223. Hodgson, J. 1979. Nomenclature and definitions in grazing studies. Grass
and Forage Science 34: 1 I-18.
Scarnecehia, D.L., and M.M. Kothmann. 1982. A dynamic approach to
grazing management terminology. J. Range Manage. 35262-264. ScarnaeeMa, D.L. 1985. The animal-unit and animal-unitcquivalent con-
cepts in range science. J. Range Manage. 38:346-349.
Scarnecchia, D.L., and M.M. Kothmann. 1986. Observations on herbage
growth, disappearance and accumulation under livestock grazing. J. Range Manage. 3986-87.
Scameechia,D.L., and C.T. Gaskim. 1987. Modeling animal-unit-equivalents
for beef cattle. Agricultural Systems 23:19-26.
Scamecchia, D.L. (1988). Minimizing confounding in case studies of agri- cultural systems. Agricultural Systems. 2689-97.
Society for Range Management. 1974. A glossary of terms used in range management. Sot. Range Manage., Denver, Colo.
Stuth, J.W., D.R. Kirby, and R.E. Chmiekwski. 1981. Effect of herbage allowance on the efficiency of defoliation by the grazing animal. Grass and Forage Science 36:9-15.
Waker, J.W. 1984. Grazing management theories and their application to short duration grazing. p. 176-179. In: Proc. Forage and Grassland Conference, Houston, Texas, January 23-26.
FOR SALE: Range Management Journals 150+ vol., 1965-87.
Cattle, vegetation, and economic responses to grazing sys-
tems and grazing pressure
RICHARD H. HART, MARILYN J. SAMUEL, PETER S. TEST, AND MICHAEL A. SMITH
Abstract
Manipulating stocking rate and duration of grazing is funda- mental to range management. It has been claimed that rotation grazing systems wiil increase stocking capadty of range whiie maintaining or improving anhnal gains, range condition, and for-
age production. To test these claims, we compared continuous,
Qpasture rotationally de&r&, and &paddock short-duration rotation grazing on mixed-grass range near Cheyenne, Wyo. from 1982 through 1987. Grazing pmsures ranged from 19 to 81 steer- days per tonne of forage dry matter produced. Steers were weighed biweekly; forage production, utilization, and botanical composi- tion were estimated by clipping; and basai cover was estimated by inclined point frame. Basal cover of litter and bare ground responded to stocking rate or grazing systems, but basal cover of vegetation was affected only by years. Steer average daily gain decreased as grazing pressure increased (r’ = 0.66); systems had no significant effect. The most profitable stocking rate at 1986-87 costs and prices was approximately 60 to 80% above SCS recom- mendations, but the increase in return was small and range condi- tions and forage production probably could not be maintained a1 this rate.
Key Words: continuous grazing, rotationaiiy deferred grazing, short-duration rotation grazing, Savory Grazing Method, range condition
Shortduration rotation grazing is a form of rotational grazing, in which the time grazing animals spend in each pasture and the time each pasture is rested vary with growth rate of the forage and the amount of forage in the pasture (Kothmann 1984). When grass is growing fast, animals spend fewer days in each pasture and rest intervals are shorter. Animals should be moved to another pasture before they graze new regrowth and before gains are seriously reduced by a shortage of forage. It has been claimed that short- duration rotation grazing, under the name of the Savory Grazing Method, will permit a doubling of the recommended stocking rate without a decrease in animal gain/ ha, and at the same time will improve range condition and forage production (Savory 1983).
Pioneer research in the United States in the use of short-duration rotation grazing began in the South and Southwest (Pieper 1980, Dahll986, Heitschmidt 1986). Short-duration rotation research in the northern United States started more recently (Kirby et al. 1986, Lewis et al. 1982, Marlow and Whitman 1983, Malechek and Dwyer 1983, Reece 1986).
This paper describes and summarizes the results of the first 6 years, 1982-1987, of a planned 1Zyear grazing system and stock- ing rate study. This project was designed to quantify yearling steer performance and vegetation response to 3 grazing systems at a range of stocking rates, and to determine the optimum or most profitable stocking rate for all systems.
Study Area
Study Area and Methods
Experiments were initiated in 1982 on the High Plains Grass- lands Research Station, approximately 7 km northwest of Cheyenne,
Authors are range scientist and botanist, USDA, Agricultural Rascarch Service, Cheyenne, Wyo. 8u)o9; and former research assistant and associate professor, Div. of Range Management, Univ. of Wyomin Laramie 82071.
Manuscript accepted 11 February 19 Q 8.
282 JOURNAL OF RANGE MANAGEMENT 41(4), July 1988
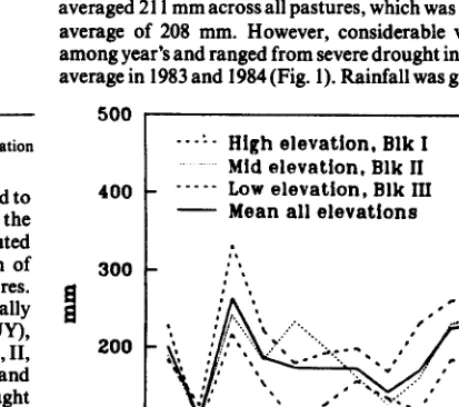
Wyoming. Climate of the area is semiarid with a wide temperature range seasonally as well as daily. Average growing season is 127 days. Wind is predominantly from the west and down slope from the Laramie Range (Stevenson et al. 1984). Average (1871-1986) annual precipitation at Cheyenne is 338 mm, with maximum pre- cipitation in May and early June and approximately 70% of the precipitation falling between 1 April and 30 September (NOAA 1987).
The area consists of rolling hills of mixed grass prairie at eleva- tion of 1,910 to 1,950 m. Prevalent soils are Ascalon and Altvan loams (mixed, mesic, Aridic Argiustolls), Cascajo gravelly loam (a mixed, mesic, Aridic Calciorthid), and Larim Variant gravelly loam (a mixed, mesic, Ustollic Haplargid).
Dominant cool-season grasses are western wheatgrass [Agro- pyron smithii Rydb.] and needleandthread [Stipa comata Trin. and Rupr.]. Blue grama [Bouteloua gracilis (H.B.K.) Griffiths] is the dominant warm-season grass. Blue grama is an increaser and western wheatgrass and needleandthread are decreasen at this location. These grasses provide the majority of livestock forage (Samuel and Howard 1982).
The area has heen grazed very lightly by various forms of live- stock and wildlife in the past. A survey of plant composition in the summers of 1981,1982, and 1983 indicated that the range sites of the area were in high good condition.
Grazing Management and Cattle Gains
The grazing systems compared in this study were:
(I) Season-long or continuous with no pasture subdivisions (C).
(2) Rotationally deferred with a different quarter of the area deferred each year until 1 September; then all 4 pastures were grazed the rest of the season (R).
(3) Short duration rotation with each of the 8 pasture subdi- visions or paddocks grazed in rotation (S).
All systems were stocked with yearling steers at 2 stocking rates: moderate (M, 4 steers/ 12 ha) and heavy (H, 4 steers/9 ha) in 1982 through 1984. The moderate stocking rate (SR) was approximately the SCS recommended rate for the condition of the sites, 1.2 steer-months/ha, the heavy SR was approximately 33% higher (SCS 1986). In 1985 through 1987, each moderate or heavy pasture was stocked with 5 steers. Grazing seasons are given in Table 1. Steers were of Hereford-Angus-Simmental or Hereford-Angus- Charolais breeding. Initial weights were 298, 292, 245, 249, 295, and 219 kg in 1982 through 1987, respectively.
Each system by stocking rate combination had 2 replicates. The experimental design, therefore, was a randomized block design with 2 blocks. The blocking factor was topography (Fig. 1). The first block was on a steeper, predominately north slope (O-15%) while the second block was on a more nearly level (O-6%) southern exposure.
A lightly stocked continuous treatment was begun on an 81-ha pasture in 1982, but cattle weights from this treatment were not included in this analysis until 1983. The light stocking rate was approximately 1 steer/5 ha, about 35%below the SCS-recommended stocking rate. This unreplicated treatment was stocked such that forage supply would not limit steer gains.
Table 1. Grazing seasons, precipitation, forage production, and stocking rate, 19821985.
Precip.. % of Forage prod., steers/ pasture Steer-days/ ha
Grazing season nonnaP 41 ha Light Mod. Hf=y Light Mod. H=Y
24 June-19 Get 1982 107 1180 -_ 4 4 28.5 51.4
16June-27Ckt 1983 151 1670 16 4 4 2;5 43.7 58.3
12June- 2Gct 1984 131 1140 18 4 4 24.2 36.8 49.2
29 May -16 Ckt 1985 94 1040 14 5 5 23.5 57.6 76.8
lOJune- 8Ckt 1986 113 1140 I5 5 5 21.5 50.0 66.7
3 June- 8 Ckt 1987 138 870 14 5 5 21.3 52.9 70.6
*In I2 months (September-August) before forage clipping; based on 1871-1986 averages.
each paddock for 3 days at the beginning of the grazing season; length of grazing period was increased gradually to 7 days by the end of the season. In 1984 through 1987 each grazing period on each paddock was determined by growth rate and forage supply; grazing periods ranged from 2 to 11 days.
All steers were weighed on the first day of the grazing period and bi-weeklv thereafter until the last dav. The steers were shrunk for
15 to 16 hours (no water or feed) prior to weighing.
1 500 m
Fig. 1. Mop of grazing systems ondstocking rates study, showing replico- lions, treatments, ondposture design.
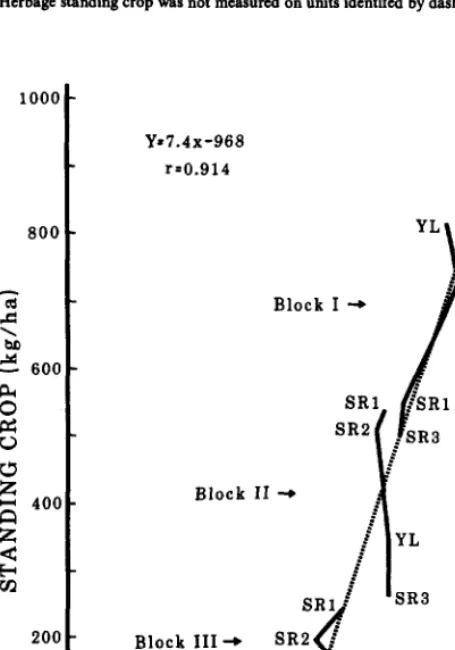
Herbage Production, Botanical Composition, and Bisrl Cover Peak standing crop of herbage in each pasture was estimated by total harvest of herbage from two 0.18-mr quadrats within each of four 1.5-m* permanent exclosures in 1982 and 1983. In 1984 through 1987, total forage on both quadrats was estimated by capacitance meter; then 1 quadrat was clipped and the data used to develop a regression equation to estimated standing crop on the unclipped quadrats. Correlation between standing crop and capac- itance meter readings was acceptable: rr q 0.63 to 0.82, n = 12 to 24. Exclosures were stratified on loamy or gravelly loamy sites depend- ing on the relative abundance of each site in a pasture. The exclo- sures were clipped in late summer when standing crop was near maximum. Herbage was hand clipped to ground level in each quadrat. The samples were oven dried at 60” C for 24 hours and then weighed to the nearest 0.001 g. From 1982 through 1985, the samples from each quadrat were divided into (I) western wheat- grass, (2) blue grama, (3) other graminoids which included mostly cool-season perennial grasses, sedges [Curex spp.], and annual grasses, and (4) forbs. Scarlet globemallow [Sphaer&eu coccineu (Pursh) Rydb.] was the major forb and fringed sagewort [Arfemi-
sio frigidu Willd.] the major half-shrub. Most dead material was removed in the field by hand; remaining dead material in blue grama samples was removed in the laboratory after drying.
Utilization or herbage disappearance was estimated using the difference between peak standing crop inside the permanent exclo- sures and standing crop remaining near the exclosures after graz- ing was completed. In 1982 and 1983, two 0. B-m2 quadrats were clipped outside each exclosure. In 1982 utilization was estimated only in the continuous and rotationally deferred pastures of 1 replication before a heavy snowfall stopped field work for the year. In 1984 through 1987, capacitance meter readings were taken in 5 quadrats outside each exclosure, and 1 of the 5 was clipped to calculate the regression of yield on meter reading. Utilization was equal to the difference expressed in percent of standing crop pro- duction in the exclosure.
Basal cover was estimated on 2 transects (1 on a slope and 1 on a nearly flat area) in each of the heavy use pastures. For comparison, 4 transects were established in the continuous light pasture: 2 on the north side of the ridge to correspond to block 1, and 2 on the south side to correspond to block 2. Data were collected in July of each year. A 50-m tape was stretched along the transect and basal cover was measured with a point frequency (Mueller-Dombois and Ellenberg 1974) frame with 10 pins approaching the ground at a 6O-degree angle. The point frame was put down at each meter mark. Categories recorded were: bare ground, litter, and all plants by species.
Data Analysis
Vegetation data were analyzed using standard analysis of var- iance procedures, and means were separated with Tukey’s HSD procedure. Response of ADG to grazing pressure (steer-days per tonne of forage dry matter produced) was evaluated by regression and optimum stocking rate estimated according to the model of Hart (1978). Differences between regressions were tested by methods outlined by Steel and Torrie (1980).
Results and Discussion Vegetation
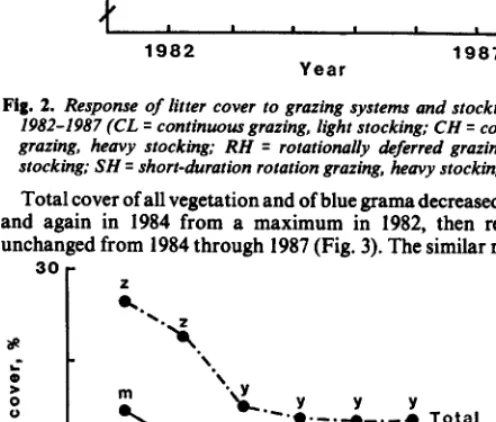
There were no significant differences in total herbage produc- tion, as measured by peak standing crop, among grazing systems or stocking rates in any year. Differences in production among years (Table 1) were largely a result of differences in amount and timing of precipitation (Hart and Samuel 1985).
No significant difference in utilization between moderate and heavy stocking rates was detected in 1982 or 1983 but the heavier rate tended to have greater utilization (Table 2). In 1984 through 1987 utilization was significantly greater on heavy than on moder- ate stocking rate. Utilization did not differ significantly among systems within stocking rates in any year.