STATISTICAL MODELS FOR ESTIMATING FATIGUE LIVES OF
AUSTENITIC STAINLESS STEELS IN LIGHT WATER REACTOR
ENVIRONMENTS
Paul Wilhelm1, Paul Steinmann2, and Jürgen Rudolph3
1
Ph.D. Student, University of Erlangen–Nuremberg, Germany 2
Professor, University of Erlangen–Nuremberg, Chair of Applied Mechanics, Germany 3
Senior Expert, AREVA GmbH, Germany
ABSTRACT
Research efforts have focused on determining the fatigue behaviour of austenitic stainless steels (SSs) used for pressure boundary components in light water reactor (LWR) environments. In this study, over 1450 fatigue strain versus life data developed at various research laboratories worldwide have been compiled (air and water environments). But, only 137 test results in LWR medium could have been used in this study—fatigue data from tube specimens, bending tests, and loading waveforms other than triangle or trapezoidal were not included in the final evaluations. Two statistical models have been developed, one for pressurized water reactor (PWR) environments and one for boiling water reactor (BWR) environments, to take into account the difference in water chemistry between PWR and BWR medium.
For both models a fatigue ε–N curve in water at defined conditions (reference curve) was determined. The effects of the coolant environments on fatigue life were expressed in terms of correction factors, which were defined as the ratio of life in water at reference conditions to that in water at service temperature. Correction factors were derived for the effects of key parameters, such as temperature and strain rate. The statistical models are recommended for PWR and BWR medium for predicting fatigue lives <105 and <104cycles, respectively. The estimated uncertainty in fatigue life is less than 2%.
INTRODUCTION
Components in power plants are critical from a safety viewpoint. They are designed carefully to cope with the operating temperature and pressure. In addition they are also subject to mechanical loads and the influence of the water environment. Especially the effects of the water reactor environment on the fatigue lives have been studied extensively during the last decades. The work on the assessment of environmentally assisted fatigue (EAF) for LWR medium, edited by Chopra and Shack (2014) includes encyclopaedic coverage of many parameters, like temperature or strain rate. Other EAF models were proposed by Leax (1997), Xiao et al. (2012) and Hasegawa (2011).
This paper presents statistical models for austenitic SSs for predicting the effect of LWR environments on fatigue life. Some of the significant features of the prediction models are:
· Definition of fatigue life correction factors as the ratio of life in BWR or PWR water at reference conditions to that in water at service conditions, and
· Reliable prediction of failure.
DATABASE
database was compiled and discussed for types 304, 304L, 316, 316NG, 321, 347, and 348 stainless steels. Here, fatigue life was defined as the number of cycles necessary for tensile stress to drop 25 % from its peak value, and data obtained from sensitized material, castings and weldments, tube specimens, aged or contaminated specimens, sinusoidal or spectrum test signals and air or vacuum environment were excluded from the database. The remaining fatigue data included 86 and 51 failure points in PWR and BWR environment, respectively.
LWR ENVIRONMENT
Separate correlations were developed for PWR and BWR medium, since the corrosion system differs from PWR to BWR environment. Additionally, fatigue life correction factors were defined as the ratio of life in BWR or PWR water at reference conditions to that in water at service conditions to consider the effect of strain amplitude in water environment.
Reference Curve
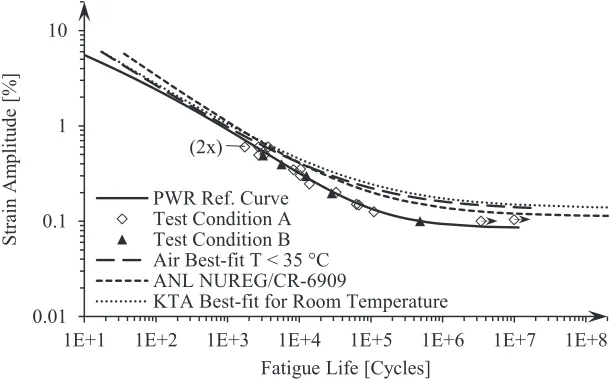
In PWR medium, the fatigue data for type 304L tested under strain control with a triangle signal (strain rate εሶ = ±0.4 %/s) were selected as reference test condition (Test Condition A: dissolved oxygen concentration DO < 10 ppb, T = 300 °C). The data points are best represented by the Bastenaire (1971) equation
N
Ref
PWR= 10൫4.18-lgൣεa-0.085൧-1.35ൣεa-0.085൧൯0.35
(1) where NRefPWR is the fatigue life in PWR medium at reference conditions [cycles]
εa is the strain amplitude [%].
The S-shape curve of the Bastenaire equation fits the failure data better than the Langer (1962) curve does. Figure 1 shows that fatigue life is not increased or decreased when DO content is increased from < 10 ppb to <100 ppb—the later represents Test Condition B (type 304L, εሶ = ±0.4 %/s, T = 300 °C, DO < 100 ppb). Therefore the influence of DO content in the range of 10–100 ppb is not considered by a correction factor. The effects of DO content on the fatigue life are considered indirectly in the reference curve.
Figure 1. Reference curve for PWR environment. 0.01
0.1 1 10
1E+1 1E+2 1E+3 1E+4 1E+5 1E+6 1E+7 1E+8
Stra
in
A
m
p
litu
d
e
[%]
Fatigue Life [Cycles] PWR Ref. Curve
Test Condition A Test Condition B Air Best-fit T < 35 °C ANL NUREG/CR-6909
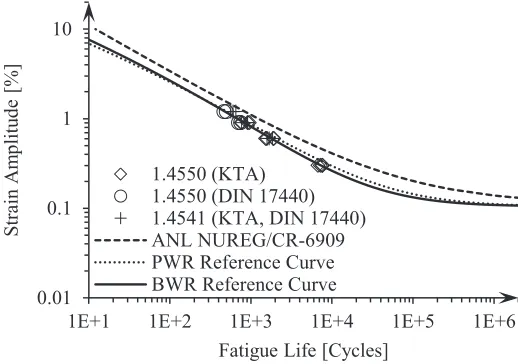
In BWR medium, the fatigue data for type 321 and 347 tested under strain control with a triangle signal (tensile and compression strain rate εሶ = ±0.Ͳͳ %/s) were selected as reference test condition (T = 240 °C, DO = 400 ppb). The 25 data points are best represented, again, by the Bastenaire (1971) equation, see Figure 2:
NRefBWR= 10൫3.80-lgൣεa-0.105൧-1.05ൣεa-0.105൧൯ 0.3
(2) where N
Ref
BWR is the fatigue life in BWR medium at reference conditions [cycles].
Figure 2. Reference curve for BWR environment.
Effect Of Strain Rate
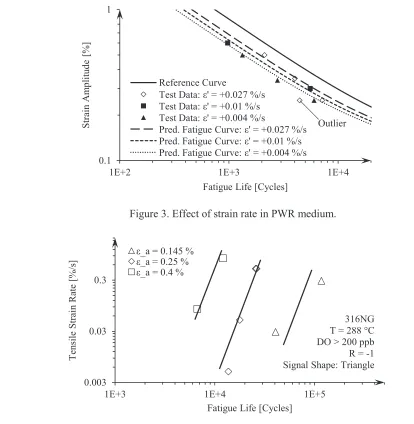
An analysis of the experimental data suggested that the fatigue life decreases with decreasing tensile strain rate and that the reduction of fatigue life is the same for different strain amplitudes. The compiled data were too sparse to define a saturation strain rate for austenitic SSs.
Fatigue tests with different tensile strain rates but with the same compressive strain rate of -0.4 %/s were compiled on type 304L in PWR medium, see Figure 3. The predicted fatigue curves were expressed in terms of the Bastenaire equation and only the constant 4.18 of Eq. (1) varies with strain rate. The strain rate reduction factor gets 1.00 at reference condition and is best represented by
FεPWRሶ = ቂεሶ
0.4ቃ 0.18
(3)
where FεPWRሶ is the strain rate correction factor for the PWR model [-].
Figure 4 shows a plot of tensile strain rate as a function of fatigue life of type 316NG in BWR medium. The few data points confirm the proposed strain rate exponent of 0.18 of the above PWR model. Therefore the expression of the PWR strain rate correction factor was adapted as follows:
FεBWRሶ = ቂ εሶ
0.01ቃ 0.18
(4)
where F
εሶ
BWR is the strain rate correction factor for the BWR model [-]. 0.01
0.1 1 10
1E+1 1E+2 1E+3 1E+4 1E+5 1E+6
Stra
in
A
m
p
litu
d
e
[%]
Fatigue Life [Cycles] 1.4550 (KTA)
Figure 3. Effect of strain rate in PWR medium.
Figure 4. Dependence of tensile strain rate on fatigue life in BWR medium.
Effect Of Strain Rate And Material
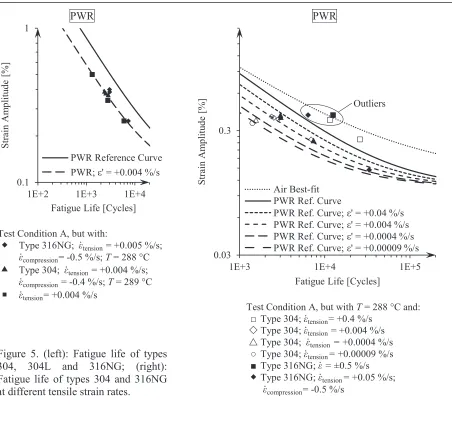
Failure data of types 304, 304L and 316NG with test temperature of about 300 °C is illustrated in Figure 5 (left). The results indicate that in PWR environment, the fatigue lives of types 304 and 316NG are comparable to those of type 304L. In Figure 5 (right), for tensile strain rate levels between 0.04 and 0.00009 %/s, predicted fatigue lives according to Eq. 1 and 3 show good agreement with the experimental values. Note that a saturation strain rate could not be defined here. Chopra and Shack (2014) state a tensile strain rate of 0.0004 %/s, below which environmental effects on fatigue lives are not increasing further. A detailed characterization of the oxide film formed on types 304 and 316 SS in 288 °C water was published by Kim (1995) and Kim (1999), respectively.
0.1 1
1E+2 1E+3 1E+4
Stra
in
A
m
p
litu
d
e
[%]
Fatigue Life [Cycles] Reference Curve
Test Data: ε' = +0.027 %/s Test Data: ε' = +0.01 %/s Test Data: ε' = +0.004 %/s
Pred. Fatigue Curve: ε' = +0.027 %/s Pred. Fatigue Curve: ε' = +0.01 %/s Pred. Fatigue Curve: ε' = +0.004 %/s
Outlier
0.003 0.03 0.3
1E+3 1E+4 1E+5
T
en
sile
Stra
in
R
ate
[%/s
]
Fatigue Life [Cycles]
ε_a = 0.145 %
ε_a = 0.25 %
ε_a = 0.4 %
PWR
Figure 5. (left): Fatigue life of types 304, 304L and 316NG; (right): Fatigue life of types 304 and 316NG at different tensile strain rates.
PWR
Effect Of Temperature
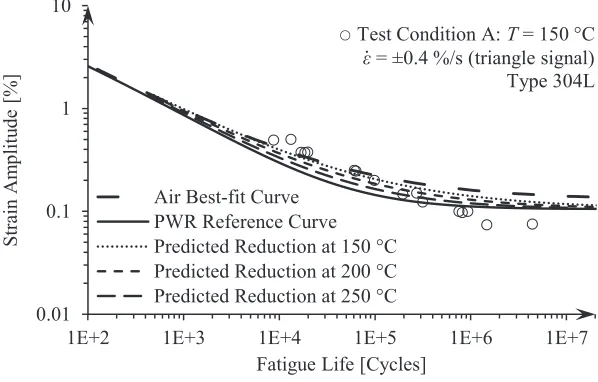
The change in fatigue life of type 304L in PWR medium is illustrated in Figure 6, along with the PWR reference curve and best-fit curve in air, which is used here as an upper boundary curve. (The air best-fit curve best represents the compiled austenitic SSs data in air, see Wilhelm (2014a).) The plotted data vary only in temperature, however, the results indicate that significant scatter is apparent. Since the developed model is recommended for predicting fatigue lives that are 103–105 cycles, the high cycle fatigue data were not considered here. The functional form for the temperature correction factor was based on data trends:
ܨୖ ൌ ቂఌିǤଵହǤଶ଼ ͳቃ ቀయబబషభఱబ ቁ
(5)
where FPWR is the temperature correction factor for the PWR model[-] T is the temperature [°C].
The available BWR data were too sparse to establish a functional form. So, the above proposed temperature correction factor (Eq. 5) of the PWR model was adapted to the BWR reference curve and defined as follows:
0.1 1
1E+2 1E+3 1E+4
Stra in A m p litu d e [%]
Fatigue Life [Cycles] PWR Reference Curve PWR; ε' = +0.004 %/s
0.03 0.3
1E+3 1E+4 1E+5
Stra in A m p litu d e [%]
Fatigue Life [Cycles] Air Best-fit
PWR Ref. Curve
PWR Ref. Curve; ε' = +0.04 %/s PWR Ref. Curve; ε' = +0.004 %/s PWR Ref. Curve; ε' = +0.0004 %/s PWR Ref. Curve; ε' = +0.00009 %/s
Outliers
Test Condition A, but with: ® Type 316NG; εሶ
tension = +0.005 %/s; εሶ
compression= -0.5 %/s; T = 288 °C Type 304; εሶ
tension= +0.004 %/s; εሶ
compression = -0.4 %/s; T = 289 °C ¡ εሶ
tension= +0.004 %/s
Test Condition A, but with T = 288 °C and:
□ Type 304; εሶ
tension= +0.4 %/s ¯ Type 304; εሶ
tension = +0.004 %/s r Type 304; εሶ
tension = +0.0004 %/s
○ Type 304; εሶ
tension= +0.00009 %/s
■ Type 316NG; εሶ = ±0.5 %/s
® Type 316NG; εሶ
tension= +0.05 %/s;
εሶ
ܨୖ ൌ ቂఌିǤଵହǤଶ଼ ͳቃ ቀమరబషభఱబ ቁ
(6)
where F
BWR is the temperature correction factor for the BWR model[-].
Figure 6 shows exemplarily for the PWR model the proposed reduction curves at 150, 200, 250 and 300 °C.
Figure 6. Fatigue life of type 304 at 150 °C in PWR medium.
Agreement Between Model Estimates and Test Data
The actual allowable number of cycles for a given load cycle with a given strain amplitude εa at a specific location on a specific component can be obtained by multiplying the fatigue life of the reference curve by the above correction factors:
N25=NRefWR∙FεPWRሶ ∙FTPWR (7)
where N25 is the fatigue life [cycles]
and for BWR environment
N25=N
Ref BWR∙F
εሶ BWR∙F
T
BWR. (8)
The PWR model is recommended for predicted fatigue lives between 103–105 cycles. Equations 1, 3 and 5 should be used for types 304L and 316NG and of heat 30956 of type 304.
The BWR model is recommended for predicted fatigue lives between 102–104 cycles. Equations 2, 4 and 6 should be used for types 321, 347, 316NG and of heat 30856 of type 304.
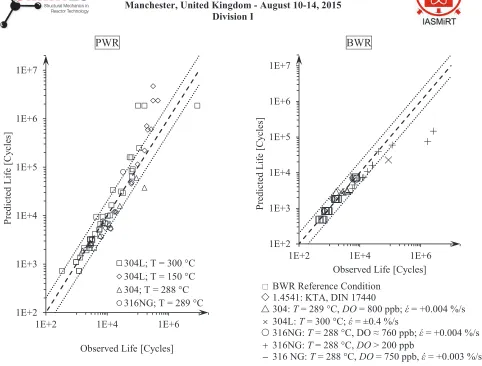
A plot comparing the observed and predicted fatigue lives in PWR and BWR environment is shown in Figure 7 left and right, respectively. Predicted lives were within a factor of two of the measured fatigue life.
0.01 0.1 1 10
1E+2 1E+3 1E+4 1E+5 1E+6 1E+7
Stra
in
A
m
p
litu
d
e
[%]
Fatigue Life [Cycles] Air Best-fit Curve
PWR Reference Curve
Predicted Reduction at 150 °C (302 °F) Predicted Reduction at 200 °C (392 °F) Predicted Reduction at 250 °C (482 °F)
Test Condition A: T = 150 °C εሶ= ±0.4 %/s (triangle signal)
PWR BWR
Figure 7. Experimental and predicted values of fatigue lives. (left): PWR medium; (right): BWR medium.
REFERENCES
Bastenaire, F. A. (1971). “New Method for the Statistical Evaluation of Constant Stress Amplitude Fatigue-Test Result,” Symposium of Probabilistic Aspects of Fatigue, ASTM Annual Meeting, Atlantic City, NY, U. S., ASTM STP511.
Chopra, O. K. and Shack, W. J. (2007). Effect of LWR Coolant Environments on the Fatigue Life of Reactor Materials, Argonne National Laboratory, Argonne, IL, U. S. NUREG/CR–6909.
Chopra, O. K. and Stevens, L. (2014). Effect of LWR Coolant Environments on the Fatigue Life of Reactor Materials, Argonne National Laboratory, Argonne, IL, U. S. NUREG/CR–6909, Rev. 1. Hasegawa, H. (2011). Nuclear Power Generation Facilities—Environmental Fatigue Evaluation Method
for Nuclear Power Plants, JNES, Minato-ku, Japan, SS-1005.
Kim, Y. J. (1995). “Characterization of the Oxide Film Formed on Type 316 Stainless Steel in 288 °C
Water in Cyclic Normal and Hydrogen Water Chemistries,” Corrosion, 51(11), pp. 849–860.
Kim, Y. J. (1999). “Analysis of Oxide Film Formed on Type 304 Stainless Steel in 288 °C Water
Containing Oxygen, Hydrogen, and Hydrogen Peroxide,” Corrosion, 55(1), pp. 81–88.
Langer, B. F. (1962). “Design of Pressure Vessels for Low-Cycle Fatigue,” J. Basic Eng., 84(3), pp. 389–
399.
Leax, T. R. (1997). Statistical Models of Mean Stress and Water Environment Effects on the Fatigue Behavior of 304 Stainless Steel, Bechtel Bettis, West Mifflin, PA, U. S., DE–AC11–98PN38206. Wilhelm, P., Steinmann, P., Rudolph, J. (2014a). “Compilation of Fatigue Data for Austenitic Stainless
Steels,”Proc., Annual Meeting on Nuclear Technology, Frankfurt, Germany. 1E+2
1E+3 1E+4 1E+5 1E+6 1E+7
1E+2 1E+4 1E+6
P
red
icted
L
if
e
[C
y
cles]
Observed Life [Cycles] 304L; T = 300 °C 304L; T = 150 °C 304; T = 288 °C 316NG; T = 289 °C
1E+2 1E+3 1E+4 1E+5 1E+6 1E+7
1E+2 1E+4 1E+6
P
red
icted
L
if
e
[C
y
cles]
Observed Life [Cycles] * BWR Reference Condition
¯ 1.4541: KTA, DIN 17440
r 304: T = 289 °C, DO = 800 ppb; έ = +0.004 %/s
´ 304L: T = 300 °C; έ = ±0.4 %/s
316NG: T = 288 °C, DO ≈ 760 ppb; έ = +0.004 %/s
+ 316NG: T = 288 °C, DO > 200 ppb
Wilhelm, P., Steinmann, P., Rudolph, J. (2014b). “Discussion of Fatigue Data for Austenitic Stainless Steels,”Proc., ASME PVP Conference, Anaheim, CA, U. S., 28066.
Xiao, J., Qiu, S. Y., Chen, Y. and Xu, Q. (2012). “Prediction Model for Corrosion Fatigue Lives of