Polymorphism and Balancing Selection
at
Major Histocompatibility
Complex Loci
Naoyuki Takahata,*
Yoko
Satta* and Jan Kleint
*Department ofPopulation Genetics, National Institute of Genetics, Mishima 41 1, Japan, and tMax-Planck-Instatutfiir Biologie, Abteilung Immungenetik, Corrensstr. 42, W-7400 Tubingen, Germany, and Department of Microbiology and Immunology,
University of Miami School of Medicine, Miami, Florida 33101 Manuscript received September 5 , 199 1
Accepted for publication December 13, 199 1
ABSTRACT
Amino acid replacements in the peptide-binding region (PBR) of the functional major histocom- patibility complex (Mhc) genes appear to be driven by balancing selection. Of the various types of balancing selection, we have examined a model equivalent to overdominance that confers heterozygote advantage. As discussed by A. Robertson, overdominance selection tends to maintain alleles that have more or less the same degree of heterozygote advantage. Because of this symmetry, the model makes various testable predictions about the genealogical relationships among different alleles and provides ways of analyzing DNA sequences of Mhc alleles. In this paper, we analyze DNA sequences of 85 alleles at the HLA-A, 43, -C, - D M 1 and -DQBl loci with respect to the number of alleles and extent of nucleotide differences at the PBR, as well as at the synonymous (presumably neutral) sites. Theory suggests that the number of alleles that differ at the sites targeted by selection (presumably the nonsynonymous sites in the PBR) should be equal to the mean number of nucleotide substitutions among pairs of alleles. We also demonstrate that the nucleotide substitution rate at the targeted sites relative to that of neutral sites may be much larger than 1 . The predictions of the presented model are in surprisingly good agreement with the actual data and thus provide means for inferring certain population parameters. For overdominance selection in a finite population at equilibrium, the product of selection intensity (s) against homozygotes and the effective population size ( N ) is estimated to be
350-3000, being largest at the B locus and smallest at the C locus. We argue that N is of the order of lo5 and s is several percent at most, if the mutation rate per site per generation is lo-'.
T
HE functional major histocompatibility complex (Mhc) genes, or more specifically the parts cod- ing for the peptide (antigen)-binding region (PBR) of the molecule, are believed to be subjected to balancing selection (DOHERTY and ZINKERNAGEL 1975; HUGHES and NEI 1988, 1989). T h e fundamental observations that led to this conclusion are (1) that there exist a large number of alleles at functional Mhc loci (KLEIN1986); (2) allele frequencies are distributed more or less evenly (HEDRICK and THOMSON 1983); (3) alleles often differ at a number of nucleotide sites (KLEIN
1986); (4) certain alleles of one species are generally more similar to certain alleles of another species than they are to other alleles of the first species (the so- called trans-species mode of polymorphism in KLEIN
1980; FIGUEROA, GUNTHER and KLEIN 1988; LAWLOR et al. 1988; MAYER et al. 1988; MCCONNELL et al.
1988); (5) the rate of nonsynonymous substitutions at the PBR is higher than that of the synonymous sub- stitutions (HUGHES and NEI 1988, 1989); and (6) many alleles are in strong linkage disequilibrium (KLITZ and THOMSON 1987). There are some other observations which are suggestive of balancing selection, but are controversial. These include deficiency of Mhc homo-
Genetics 1 3 0 925-938 (April, 1992)
zygotes (DEGOS et al. 1974; BLACK and SALZANO 198 1 ; RITTE et al. 1991) and association of certain Mhc
alleles with diseases (KLEIN 1986, 1990; TIWARI and
TERASAKI 1985; THOMSON 1988; HILL et al. 1991). By balancing selection population geneticists mean either overdominance (heterozygote superiority in fit- ness), frequency-dependent selection, or diversifying selection that favors different genotypes in different environments (DOBZHANSKY 1970). Although the three forms of balancing selection are biologically distinguishable in some cases (NEI and HUGHES 199 l), there are types of frequency-dependent and diversi- fying selection that are theoretically equivalent to overdominance (TAKAHATA and NEI 1990; DENNIS- TON and CROW 1990). These forms may be collec- tively referred to as the overdominance-type selection. Heterozygote superiority of Mhc genes has thus far not been proven experimentally (but see RITTE et al.
926 N . Takahata. Y. Satta and J. Klein
inance selection, although homozygote lethality is not necessarily assumed in the latter. It was remarked that overdominance selection is an inefficient mechanism for maintaining a large number of alleles at a locus
(LEWONTIN 1985). LEWONTIN, GINZBURG and TUL-
JAPURKAR (1 978) studied stable, feasible equilibria under heterosis or overdominance selection and con- cluded that the proportion of fitness arrays leading to such equilibria of more than 6 or 7 alleles is vanish- ingly small. However, this conclusion changes when new mutations are taken into account. Indeed, the authors themselves have argued that “As new muta- tions occur, they will be lost to the population if their fitnesses in homozygous and heterozygous condition d o not lie in the appropriate region, while the new alleles will be maintained in the population if they have the appropriate fitnesses. Thus, although few new mutations may have the appropriate fitnesses, those that do will be accumulated, and it is these that we see in nature.” This point was actually made by ROBERTSON (1 962) and it was supported by computer
simulations (MARUYAMA and NEI 1981; TAKAHATA
and NEI 1990; SPENCER and MARKS 1988 for the deterministic case). Hence, even when new mutations have asymmetric fitnesses, overdominance selection tends to maintain only a particular set of alleles so
that those alleles that we observe will have symmetric fitness arrays. Moreover, the number of such alleles needs not be small if one assumes a continuous muta- tion pressure (KIMURA and CROW 1964; Table 14.3 in WRIGHT 1969), and this assumption is essential in studying the long-term evolution of balanced alleles which could persist in a population for tens of million
years (KLEIN 1980; FIGUEROA, GUNTHER and KLEIN
1988; LAWLOR et al. 1988; MAYER et al. 1988). There-
fore the symmetric overdominance-type model can
potentially be compatible with Mhc data comprised by
DNA sequences of many alleles (e.g., MARSH and
BODMER 199 1 ; ZEMMOUR and PARHAM 199 1). T o interpret the currently available DNA sequence data, it is essential to understand the allelic relation- ships (allelic genealogy). One way of studying the
allelic genealogy was suggested by TAKAHATA and
NEI (1990) and TAKAHATA (1990) who based their
arguments on KIMURA and CROW’S (1964) model of
infinitely many-allele mutations. This model is more appropriate than for example, the classical two-allele
mutation scheme used by HUDSON and KAPLAN (1 988)
with the purpose of applying the coalescent process to neutral sites partially linked to a selected site. In this
paper, we examine DNA sequences of human Mhc
alleles using the theory of allelic genealogy under symmetric overdominance-type selection and the model of infinitely many alleles. T h e allelic genealogy has a mathematically simple structure, in particular about the relationship between the number of segre-
gating alleles and the number of nucleotide differ- ences between alleles. T h e simplicity results from random extinction of existing alleles and the assump- tion that mutations always produce new allelic lines of descent.
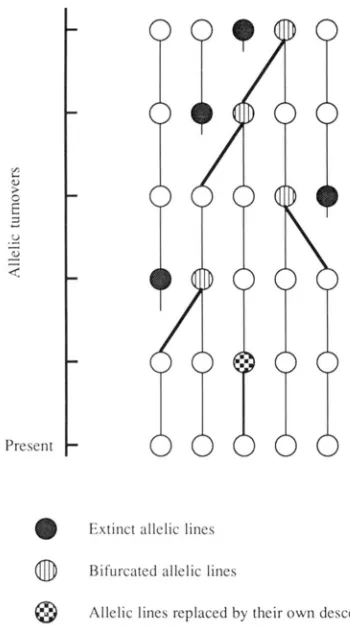
ALLELIC GENEALOGY
If we are not concerned about the time scale of allelic genealogy, the following consideration is suffi- cient to construct the allelic relationships at a given locus. Under symmetric overdominance-type selec- tion, the allele frequencies tend to be evenly distrib- uted and different alleles are equivalent in their fate. When a new descendant allele
(DA)
is produced from one of the parental alleles(PA)
and is incorporated into a population, theDA
becomesPA
and one of the previousPAS
becomes extinct (allelic turnover). T h e extinct line can be the parent itself that producedDA.
In a population at equilibrium, the incorporation ofDA
and the extinction ofPA
alleles are in balance and the number of different alleles ( n ) remains more or less constant. Because everyPA
has an equal proba- bility of extinction, l/n, the genealogical relationships among alleles (allelic genealogy) are simple (TAKA-HATA 1990) (Figure I), and are similar to those of
randomly sampled neutral genes (KINGMAN 1982; TA-
V A R ~ 1984; WATTERSON 1984). If the parental allele
of
DA
becomes extinct, there is no way of learning anything about the bifurcation ofPA
and DA. Only when bothPA
andDA
or their direct lines of descent survive and are present in a sample, can we make inferences about their divergence or coalescence. T h eDA
is always one mutational step away from thePA
under the infinitely many-allele model. In what fol- lows, allelic genealogy analysis will focus on the diver- gence of alleles at target sites of selection only. Such allele divergences are due to amino acid replacements in the PBR of Mhc molecules (nonsynonymous substi- tutions at the corresponding parts of the Mhc genes).Suppose that we have sampled i different alleles from n existing alleles (i 5 n ) and have determined their sequences, whereby by dgeerent we mean alleles that differ at the nonsynonymous sites in the PBR. We restrict our sequence analyses to pairwise compar- isons that do not require precise knowledge of the ancestral relationships among the different alleles. We compute the number ( K N ) of nonsynonymous changes in the PBR between any pair of alleles. For i sampled alleles, there are z(i
-
1)/2 values of K N from whichWe can also derive the expected relationship between
K'N (Kk) and the corresponding synonymous changes
KC ( K t ) among Mhc genes. (Furthermore, the same relationship can be derived for the nonsynonymous changes outside the PBR if they are selectively neu- tral.) Assume that the linkage between the synony- mous sites and PBR within a gene is complete and that the total rate of synonymous changes is v per gene per generation. To relate KC (Kk) to KC (Kir), we must define our model more precisely and know how rapidly nonsynonymous changes occur relative to syn- onymous changes. We base our considerations on the
model of symmetric overdominance-type selection
studied by WRIGHT (1939), KIMURA and CROW
(1964), MARUYAMA and NEI ( 1 98 l ) , TAKAHATA
( 1 990) and others. Applying this selection model to a finite population, KIMURA and CROW ( 1 964) derived an approximate formula for the number of alleles ( n ) . For our purpose, the formula may be written as
Present
0
Extinct allelic lines@
Bifurcated allelic lines@
Allelic lines replaced by their own descendantsFIGURE 1 .-Allelic genealogy. In this figure, there are five alleles which are equivalent in terms o f reproduction. In each allelic turnover, one of five parental alleles (PA) produces a descendant allele ( D A ) and one P A goes to extinction. T h e allelic turnover rate is not specified here, but the waiting time for each allelic turnover is exponentially distributed with the mean o f a/n generations where n is the number of alleles in a population (TAKAHATA 1990).
effectively the infinite site model without recombina- tion (WATTERSON 1975) and makes no correction for multiple hits. T h e correction is made to the data if at
a l l .
T h e expected values of K g and K i are independent of the topology of allelic genealogy and are given by
the formulas
E{KTr] = n ( 1 )
and
i 2
E { K k ) = 2n
(
1-
Ti)
-
7j=B J
=
2n 1(
-
9
for large nin which E { X j stands for the expectation of random variable X taken by its distribution (see APPENDIX). T h a t is, the expected number of nonsynonymous changes in the PBR is the same as the number of different alleles in a population and the largest differ- ence between a pair of alleles in the sample roughly equals 2(1
-
l/i) times the number of alleles n or EIK$j.in which
S
= 2Ns and M = Nu where N is the number of breeding individuals in the population, s the selec- tive disadvantage of homozygotes in the overdomi- nance selection model, and u the nonsynonymousmutation rate per PBR per generation. TAKAHATA
(1990) demonstrated that the divergence time of a
pair of alleles is exponentially distributed with mean
n3
2 &us a=-
in units of generations. During this divergence time,
a pair of alleles accumulates n nonsynonymous
changes on average (see APPENDIX and Equation I),
whereas the synonymous sites accumulate 2av
changes. For a given divergence time of alleles, the distribution of the number of both changes is approx- imately Poisson [see APPENDIX, also WATTERSON
(1975) for the neutral case]. Similarly to the diver- gence time between a pair of alleles, there are 2 4 1
-
l / i ) generations between the two most distantly re-
lated alleles in the i sampled alleles. T h u s w e have
E{KCj = 2av and E { K i j = 4av
For convenience, w e define
8 = 2av. (6)
If u and v are proportional to the number of nonsy- nonymous ( L N ) and synonymous ( L S ) sites and the per- site mutation rate ( p ) is the same for L,v and L.7, 8 can
928 N. Takahata, Y. Satta and J. Klein
Equations 1 , 2 and 5, the ratio of nonsynonymous to synonymous changes is
where superscript Y stands for either P or L. If the synonymous and nonsynonymous changes per site are defined by
and
E(K;I
k& =
-
LN 'respectively, the ratio (y) of k; to
k;
becomes4 s
n2
y =
-.
We may rewrite the above equation as
If n is the observed number of alleles or estimated from Equation 1 or 2 and if
k;
andk;
are computed from sequence data, Equation 8 gives an estimator of S = 2Ns. An estimate of M = Nu can then be obtained from Equation 3.From intraspecies variation of the Mhc, HUGHES
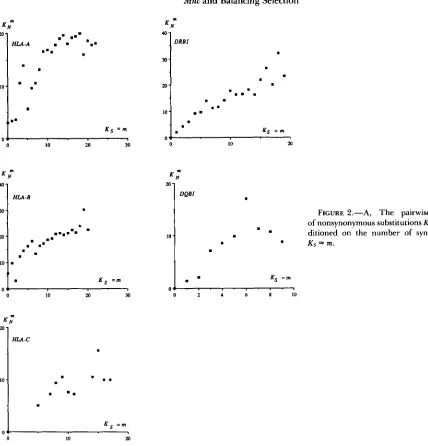
and NEI (1 988) estimated the ratio of the nonsynon- ymous rate in the PBR to the synonymous rate to be about 3. T h e ratio is equivalent to y. Here we consider the possibility that calculating y on the basis of all pairwise comparisons may lead to an underestimate because of a difficulty in inferring extensive nonsy- nonymous changes in the PBR that have accumulated trans-specifically. An alternative method we propose here is based on the fact that young alleles do not differ much in terms of K s . For pairs of such alleles, the K N can be expected to be relatively small and multiple hits to be rare so that errors in the multiple hit correction can be minimized.
Suppose that we have identified allelic pairs with small values of K s = m and that we also know their
K N . For these pairs, we obtain KN = j and K s = m ( j = 1 ,
2,
3,. . .
and m = 0, 1 , 2,. .
.).
Our task is to find the conditional probability of K N when K s = m, andwe denote this probability as P(KE = j ) . Under sym- metric overdominance-type selection the conditional
probability becomes a negative binomial distribution
P ( K E = j ) = (9)
( j
+
m)!{
1+
8 >,+I{
n>i
j!m! 1
+
n+
% l + n + % (see APPENDIX). T h e conditional mean of K;I: is then given byE ( K Z ) = n(l
+
m ) 1 + % 'from which we have
and hence another estimator of n. For instance, if we happen to find pairs of alleles that are identical at the synonymous sites, we set m = 0 in Equation 1 1 , and we have n = E ( K $ ) ( l
+
19). Alternatively and more desirable statistically, we may use pairs of alleles whose synonymous differences are in a certain range of K s .For pairs of alleles with 0 I K s 5
k,
we haveE ( K N
I
0 d K S I k ) n =( k
+
lMk+' (12)1 -
(1
+
e y + 2-
( 1+
e)@"
(see APPENDIX).
As K s becomes large, the actual number of nonsy- nonymous changes may not increase in such a way that Equation 10 predicts. T h e leveling-off signifies that, since alleles with large values of K s diverged long ago, nonsynonymous differences in their PBR may be saturated. For this reason, we use Equation 12 with small values of K s to estimate n.
APPLICATION TO HLA LOCI
All pairwise comparisons: We have applied the above theoretical results to the sequence data obtained for the human HLA-A, -B, -C, - D m 1 and -DQBl loci. T h e numbers of alleles examined at these loci are 19,
26, 6, 19 and 15, respectively, giving a total number of 85. T o estimate the actual number of synonymous
and nonsynonymous substitutions, we used the JUKES
and CANTOR (1969) method. In general the synony- mous differences were small so that no substantial correction was made. T h e correction for nonsynony- mous differences in the PBR was a different matter and requires caution. For instance, in HLA-B, K;I: does not increase linearly but levels off at about 20 as K S =
20
-
HLA -A m
.=
..-
..-
D’m
.
IO
-
8.
., m 9
K s = m
0 I
0 10 20 30
K t ?
HLA-B
IO]
.
. m
K S = m
u -
0 IO m
1
FIGURE 2.-A, T h e pairwise mean numberI
.
of nonsynonymous substitutions K N in the PBR con-
K s = m. 8
.
ditioned on the numberof synonymous changes
.
.
and others no substitutions. In order to examine this
possibility, we carried out a maximum parsimony
analysis of the phylogeny of the HLA alleles by DNA-
PARS (in PHYLIP, version 3.3, provided by J. FEL-
SENSTEIN). It turns out that the number of nonsynon-
ymous substitutions varies greatly from site to site, ranging from 0 to
7,
and that these substitutions at various sites are not distributed according to the Pois- son distribution [see UZZELL and CORBIN (1 97 1) for a similar finding). Since the Poisson (including JUKESand CANTOR’S) method failed to provide the necessary correction for multiple hit substitutions, discrepancies among estimates of n based on Equations 1, 1 1 or 12 could be expected. To avoid these discrepancies, we could estimate K N by a non-Poisson correction method (JIN and NEI 1990; TAKAHATA 199 1 b). Alternatively, we could use a set of relatively young alleles for which both Poisson and non-Poisson methods are expected to make similar estimates for the actual number of
substitutions per PBR (TAKAHATA 199 1 b).
Disregarding the possibility that both K i and K g
may be underestimated (see the next subsection), we first examined whether the ratio of these two values is close to 2(1
-
l/i) for i sampled alleles. If we could sample all existing alleles, the sample size would be n.and the ratio would become equal to twice the ex- pected heterozygosity ( H ) generated by nonsynony- mous changes in the PBR. This is because under strong symmetric overdominance-type selection n is equivalent to the effective number of alleles (KIMURA
and CROW 1964), so that l/n becomes the expected
homozygosity ( F ) . For class I loci, the ratio is 1.8 to 1.9 so that H g 90-95%. These H values are very
close to those estimated from allele frequencies (see Table 8.10-12 in KLEIN 1986). For class I1 loci, on
the other hand, the ratio is somewhat larger than 2,
suggesting some abnormalities in nonsynonymous substitutions in the putative PBR or simply reflecting large sampling errors (the ratio of
Kh
and K g is shownto have a skewed distribution; SATTA 1992). Nonethe-
less, for both class I and I1 loci, the estimated ratio of
930 N. Takahata, Y. Satta and J. Klein
n
30- DRBl
m
20-
.
.
.
.
.
. m m-..
.
9 . IO-
n
"1
n
20
1
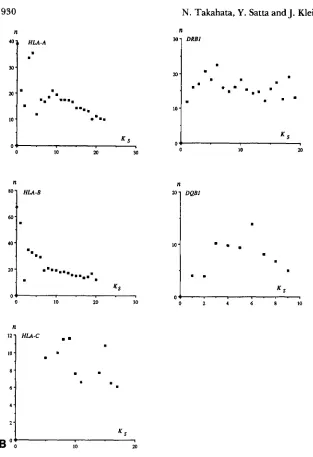
DQBlFIGURE 2.-B, Estimates of n based on Equation
Table 2. Since the estimates decrease as Ks = m
.
11. The value of 0 for each locus used is given in, . ~
Ifs
~ I O ~ ; ; , ; - , , ; ;increases, we used pairs of young alleles whose Ks values are no greater than k. The k value ranges from 6 to 10, depending on the locus (Table 3).
20
....
..=...=
.
K S
0 0
0 10 20 30 0 2 4 6 8 1 0
n
"1
.
.
. =
K S
10 20
expected value (Table 1). In other words, the actual allelic genealogy is similar to that expected from the model used to derive Equations 1 and 2. This may in turn suggest that nonsynonymous changes in the class I1 PBR are somewhat evolutionarily different from those in the class I PBR (NEI and HUGHES 1991) due presumably to the differences in their definition and
structure (KLEIN 1986; BJORKMAN et al. 1987a,b;
BROWN et al. 1988).
The estimated value of n based on KC is slightly larger than the number of different alleles at the C locus. At the D R B l locus, the estimated n from
KC
values is about 16 although there are actually morethan 25 different alleles (KLEIN, GUTKNECHT and
FISCHER 1990). The estimate of n is 16 at the A and
18 at the B loci, while the number of electrophoreti- cally or serologically detected alleles is 19 and 37,
respectively (Tables 8.10-1 1 in KLEIN 1986). These discordances may be caused by the following factors: First, since the values of K s and
KN
for a given allelic pair are geometrically distributed (APPENDIX), theirvariances can be quite large. Second, KN may be underestimated for the reason mentioned above. Third, in contrast to the class 1 loci, at the class I1 loci
K N is subjected to larger sampling errors because of the relatively small number of nonsynonymous sites
(LN = 39). Moreover, the class I1 PBR is putative and there is a possibility that other sites may be subjected to balancing selection or that nonselected sites have been included in the putative PBR. A failure to in- clude all selected sites would lead to an underestimate of the number of alleles. This has apparently hap- pened to the DQBl alleles for which only 10 of the 16
putative PBR codons were present in the partial se- quences shown.
Conditional pairwise comparisons: In order to test whether K N is really underestimated, we examined Equations 1 1 and 12. Figure 2B shows that, except at the D R B l locus, the n estimated from Equation 1 1
TABLE 1
The pairwise mean and largest changes at the HLA loci
Sample A B c DRBI DQB I
Nonsynonymous changes in PBR
Sample size i 19 26 6 19 15
?(l
-
l/i) 1.89 1.92 1.67 1.89 1.87KG 15.8 f 2.5 18.3 f 2.7 8.6 f 2.0 15.6 f 4.1 9.0 f 3.5
I& 30.1 f 6.2 34.2 f 6.7 15.6 k 4.2 39.4 f 12.2 22.9 f 8.5 (1 4.4)
(36.6)
Ratio" 1.91 1.87 1.81 2.53 2.54
Synonymous changes in the whole coding regions
kc 11.7 f 2.1 10.3 f 1.6 10.0 f 2.1 10.3 f 2.0 4.7 f 1.4
&
22.2 f 4.9 19.8 f 4.6 16.7 f 4.2 18.7 f 4.6 9.3 f 3.5Ratio" 1.90 1.92 1.67 1.82 1.98
Each sample consists of alleles that differ at least by one nonsynonymous change in the PBR (a required condition to apply the theory of
allelic genealogy). The sequences of DQBl-cover only 10 out of the 16 exon 2 PBR codons, so that the K N value is small (an extrapolation to
the whole PBR is in parentheses). Symbol
-
indicates an estimate.a The ratio is defined as K L divided by K p . The (maximum) sampling errors (f) were computed from TAKAHATA and TAJIMA (1991).
synonymous sites in the PBR. For instance, for the value of Ks at a class I locus to be 10, 10/(2v) = 5/
( L s p ) generations would be required on average since the two alleles diverged from each other. Recently, SATTA et al. (1 991) estimated p as 1.5 X 1 O-* per site per generation assuming the generation time of pri- mates to be 15 years. If we use this estimate of p, we can compute the above allele divergence time as 1.3
x 1 O6 generations or 20 million years (MY). This time period would be long enough for a number of non- synonymous substitutions to occur in the PBR of these alleles, so that it might be difficult to estimate K N by the usual correction methods (NEI 1987). We there- fore used pairs of alleles whose K s values were rela- tively small. We chose the values of
k
in Equation 12 as 6 to 10 because for higher values the conditional pairwise mean of K N started to decrease at all class I loci. We did not choose lower values because they would result in a small number of pairs compared and thus large sampling errors.The n thus estimated at each locus (Table 2) be- comes about twice as large as that in Table l . Also, it
is close to or larger than the number of known alleles:
a large difference occurs at the C locus at which the frequency of unidentified (blank) alleles is highest
among class I loci (KLEIN 1986). KLEIN, GUTKNECHT
and FISCHER (1 990) listed more alleles that are distin- guishable by T cell typing. However, alleles identified by serology or T cell typing do not always differ from each other at the nonsynonymous sites in the PBR. For instance, DRBl*O701 and 0 7 0 2 listed in KLEIN, GUTKNECHT and FISCHER (1 990) are different by the typing but they do not have any change at the nonsy- nonymous sites in the PBR. Considering many other uncertainties about the number of alleles detected by
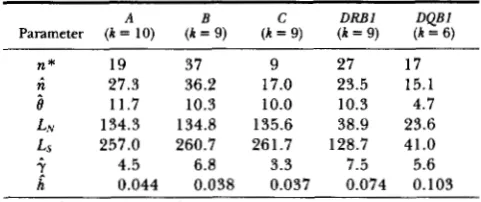
TABLE 2
Estimates of n based on allele pairs with KS 5 k and the ratio ( 7 )
of the nonsynonymous substitution rate to the synonymous rate
A B C DRBl DQBl
Parameter (k = 10) (k = 9) (k = 9) (k = 9) ( k = 6)
n* 19 37 9 27 17
I
27.3 11.7 36.2 10.3 17.0 10.0 23.5 10.3 15.1 4.7L N 134.3 134.8 135.6 38.9 23.6
Ls 257.0 260.7 261.7 128.7 41.0
i.
h^
4.5 6.8 3.3 7.5 5.6 0.044 0.038 0.037 0.074 0.103 The i? is the same as
kc
in Table 1. n*,
the observed number of alleles taken after KLEIN (1 986) for class I (Unidentified alleles are counted as one), KLEIN, GUTKNECHT and FISCHER (1990) for DRBland M A R ~ H and B ~ D M E R (1991) for D Q B l . Note that the values of
i. = kN/ks =-6L,/0LN are larger than those of HUGHIS and NEI ( 1 988). The h corresponds to Equation 13. The sampling error for this n cannot be obtained by usual methods. Roughly speaking, however, it is of the order of square root of 6 under the Poisson approximation and this assumption is valid for a small number of
nucleotide differences (TAKAHATA 1991 b).
different methods, the agreement between the num- ber of alleles and that of the nonsynonymous substi- tutions is impressive.
The ratio (7) of KN to ks was more than 6 for B and
DRBI, about 5 for A and D Q B l , and about 3 for C
(Table 2). These values are much larger than those obtained by HUGHES and NEI (1988, 1989) who used all allelic pairs in smaller samples. For the overdomi- nance-type selection to be compatible with the ob- served large number of alleles, the value of
S
must befairly large (WRIGHT 1939; KIMURA and CROW 1964;
YOKOYAMA and NEI 1979; MARUYAMA and NEI 198 1 ;
932 N. Takahata, Y. Satta and J. Klein
TABLE 3
Estimates of population parameters S
=
2Ns and M=
Nu in the symmetric overdominance-type modelParameter A B C DRBl DQBl
s
2371 6301 674 2929 2320M 0.29 0.09 0.36 0.04 0.13
A 1.5 X lo5 4.5 X lo4 1.8 x
io5
6.9 x lo4 2.2 X lo5 The u is the per-generation mutation rate of nonsynonymous changes in the PBR; in the case of class I, u = = 1 3 5 ~ . If our previous estimate of p is used (SATTA et al. 199 1) and one generation apounts to 15 years, then u=
1 O-’ X 15 X 135 = 2.0 X 1 O-6. ForM to be about 0.4, N must he as large as 1
-
2 X lo5. If N = lo5, sranges from 0.4% to 3.2%. The theory then predicts that the longest allelic divergence in the sample could he as much as 2a =
1-3 X lo6 generations which amounts to 20-60 million years.
to be much higher than the synonymous substitution
rate (TAKAHATA 1990, 1991b). Therefore the large
value of y is consistent with the overdominance-type model.
The values of were used in Equation 8 to estimate the value of S for each locus. T h e selection intensity is different at different loci, being strongest at the B
locus ( S X SOOO), intermediate at the A , DQBl and DRBl loci ( S
=
2000-3000), and weakest at the C locus ( S=
700). These figures correlate well with the extents of polymorphism at the loci. T h e M estimated from Equation 3 ranges from 0.04 to 0.36 (Table 3). If we knew the nonsynonymous mutation rate (u)at the PBR, we could estimate N and s from the estimated values of
M
and S (Table 3). If p = 1.5 X(vide supra) and therefore u = pLN is 2 X 10“j at the class I PBR and 6 X 10” at the class I1 PBR, the mean value of N becomes approximately
lo5
(e.g.,KLEIN, GUTKNECHT and FISCHER 1990; TAKAHATA
1990) and s becomes 0.4% to 3.2%, depending on the locus. T h e estimate of N is about 10 times larger than
that based on other protein polymorphisms (NEI
1987). TAKAHATA (1 99 la) discussed this discrepancy on the basis that Mhc polymorphism has lasted for tens of million years while other protein polymor- phism (which is largely neutral) is a reflection of the relatively recent history of human populations.
We can also examine the length of time alleles persist and hence whether most alleles are trans-spe- cific. T h e mean divergence time between two alleles
(CY) is about 1 O6 generations. If we again take 15 years as the generation time of primates, one million gen- erations amount to 15 MY. T h e mean time until i
alleles coalesce to j ancestors can be computed by
(TAKAHATA 1990) which amounts to 30(l/j
-
l/i)MY. Hence, several alleles could have predated the human-chimpanzee splitting, which is consistent with
the concept of trans-species polymorphism of HLA
alleles (KLEIN 1980; FIGUEROA, GUNTHER and KLEIN
1988; LAWLOR et al. 1988; MAYER et al. 1988). Of course, these estimates depend on the assumption that the population has been at equilibrium for a suffi- ciently long time. Whether or not this assumption is valid will be considered elsewhere (SATTA 1992).
FURTHER ANALYSES AND COMPUTER SIMULATION
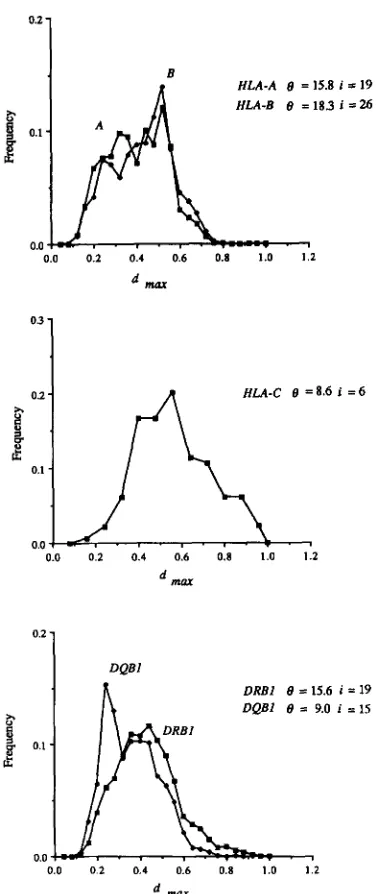
In the previous section we were concerned with the expected pairwise mean distances (the number of nu- cleotide substitutions) at the selected sites in the PBR and synonymous (presumably neutral) sites. In this section, we study the distribution of the distances by computer simulation. Such a pairwise distribution does not have the usual probabilistic meaning unless it is applied to pairs of alleles sampled from unlinked, independent loci; the pairwise distances computed for a single locus are not independent and are necessarily correlated in their ancestry. Nevertheless, we may use this distribution to examine the internal consistency of the proposed model.
Following the simulation method of TAKAHATA (1 990), we generated 1 O4 independent genealogies for a sample of alleles. T o determine the rate of allelic turnover, we used an estimated pairwise mean dis- tance at the nonsynonymous sites in the PBR of each
HLA gene. In each replicate, we computed the largest
difference (dm,,) between the observed and computer- generated distributions of pairwise distances using a statistical method similar to the Kolmogorov-Smirnov test (LEDERMANN 1984). These 1 O4 dm,, values were divided into 25 classes, each 0.04 wide, and a histo- gram was drawn. T h e distribution of
dm,,
is broad, with the highest peak in the interval (0.44, 0.48). In this case, because the critical value of dm,, at a 95% confidence level is approximately 1.36/5 = 0.272 (Figure 3; see also LEDERMANN 1984, pp. 194), it is concluded that the observed distributions for all loci are compatible with the model of symmetric overdom- inance-type selection.As mentioned earlier, Mhc alleles differ greatly not only at the nonsynonymous sites in the PBR but also at the synonymous sites. In fact, some pairs of alleles differ at as many as 22 synonymous sites. This is a large number compared to that observed at other loci. T h e fact that there is only one synonymous change between the human and gorilla @-globin genes (SA-
VATIER et al. 1987) underscores this point. T o dem-
onstrate the correlation between synonymous and
0.0 0.2 0.4 0.6 0.8 1.0 1.7. d,,
0 3
-
t
0.2
-
E
0.1 -
0.0
0.0 0.2 0.4 0.6 0.8 1.0 1.2
d m ( u
0.2 1
DRBl B = 15.6 i = 19 DQBl B = 9.0 i = 15
d m
FIGURE 3.-Frequency spectrum of dm,, obtained from IO4 re- peated simulations. The average number of pairwise nucleotide differences (e) is set as the estimated number; 15.8 for A , 18.3 for E , 8.6 for C, 15.6 for DREZ, and 9.0 for DQEZ alleles. The value of i indicates the number of alleles sampled from each locus (Table 1).
between them. To show that such a correlation is in part due to linkage between synonymous and nonsy- nonymous sites, we generated an allelic genealogy, superimposed on it two types of mutation, synony- mous and nonsynonymous, and computed the corre- lation coefficient R . Repeating this process 1 O4 times, we obtained the distribution of R which we could then compare to the observed values. Figure 4 shows that in the case of complete linkage the value of R ranges mostly from 0.5 to 1 .O. By contrast, in the case of free recombination the value of R is concentrated in the range of (0, 0.3). Therefore a high value of R (0.744 in the case D R B l , for example) cannot be fortuitous,
't i3
8
0.1 l% nccmbmtion
0.0
0.0 0.2 0.4 0.6 0.8 1.0 1.2
Correlation coefficient
FIGURE 4.-Histograms obtained by computer simulation and showing the correlation between the pairwise differences at the nonsynonymous sites in the PBR and those at the synonymous sites. These two types of sites were assumed either to be in complete linkage or to recombine freely. The mean pairwise differences were chosen as 12.1 or 10.5, depending on synonymous or nonsynony- mous changes. Each histogram was obtained by lo4 repeats.
and balancing selection at nonsynonymous sites in the PBR also has an effect on the synonymous sites.
If linkage has such substantial effects on the accu- mulation of nucleotide changes at the synonymous sites, we can expect that heterozygosity ( h ) per nu- cleotide or amino acid site in regions near the PBR will be higher than that in the more remote regions capable of recombining with the PBR [see HUDSON, KREITMAN and A G U A D ~ (1 987) and HUDSON and KA-
PLAN (1988) for a related problem). However, since the mutation rate per synonymous site ( p ) is as low as
per generation (HAYASHIDA and MIYATA 1983;
LI, Luo and Wu 1985; SATTA et al. 1991), h may not be very large. Quantitatively, in the absence of recom- bination the expected h is given by
E ( h J = 2 w
1
+
2ap(TAKAHATA 1991a), and the E ( h J ranges from 3.7% to l o % , depending on the locus (Table 2). Table 3 in HEDRICK et al. (1 99 1) shows that the h values for HLA- A and -B loci averaged for the non-PBR sites are lower than those for the PBR sites, but that the observed h value in the non-PBR is 10-25 times higher than the
0.2-0.4% h value of human insulin, P-globin, growth
hormone, and mitochondrial DNA (NEI 1987). Hence the h at HLA-A and -B loci is substantially increased in comparison to non-HLA loci and is in good agreement with Equation 13. T h e variance of h is, however, so
934 N. Takahata, Y. Satta and J. Klein
DISCUSSION AND CONCLUSION
We have shown that the nonsynonymous substitu- tion rate in the PBR may be at least twice as fast as that estimated by HUGHES and NEI (1988, 1989) and therefore much faster than the synonymous substitu- tion rate (Table 3). T h e previous underestimates of the nonsynonymous substitution rate in the PBR are likely due to the difficulty in correcting extensive multiple hits at this site. T h e present results reinforce HUGHES and NEI'S conclusion: the fact that the non- synonymous substitution rate is higher than the syn- onymous rate provides strong evidence for balancing
selection on Mhc polymorphism.
SERJEANTSON (1 989) argues that the Mhc polymor- phism can be accounted for by the neutral theory [see KIMURA (1968) and (1983) for review] and disassor- tative mating. As noted in CROW and KIMURA (1 970), however, it is difficult to imagine strongly disassorta- tive mating without selection. This is exemplified by self-sterility alleles (e.g., CLARK and KAO 199 1). Selec- tion against homo-allelic pollination is the cause of disassortative mating despite no preference in prefer- tilization. T h e recent demonstration of female disas- sortative mating preference in mice (POTTS, MANNING
and WAKELAND 1991) may be accounted for as a
consequence of avoiding deleterious effects of in- breeding. However, assortative or disassortative mat- ing causes less increase in homozygosity than inbreed- ing. Furthermore any mating preference based on a similar or dissimilar phenotype affects only segregat- ing loci related directly to that trait (CROW and KI-
MURA 1970). Therefore the Mhc itself is likely to be the genomic locus whose heterozygosity is of principal evolutionary concern (HOWARD 1991). In this view, selection is the primary cause of Mhc polymorphism rather than secondarily developed mating preference. In any case, disassortative mating responsible for a particular set of trans-specific alleles must also be trans-specific; it would have to last for as long as 10- 20 MY because some pairs of alleles are this old.
HILL et al. (1 99 1) have provided evidence that HLA- Bw53 allele and DRBl*1302-DQB1*0501 haplotype are independently associated with protection from severe malaria. Like mating preference, however, if coevolution between Mhc alleles and pathogens is the main cause of Mhc polymorphism, it must have been
transmitted through many speciation events (KLEIN
199 1). Unfortunately the association of HLA-Bw53
allele and DRBl*1302-DQB1*0501 haplotype with
malaria was estimated to be no more than 10,000 years old so that it does not account for the trans-
species mode of Mhc polymorphism.
We have ignored the nonsynonymous changes out- side the PBR against which purifying selection is thought to operate (HUGHES and NEI 1988, 1989). If the degree of selective constraint against alleles has
not changed throughout the course of evolution, the rate of nonsynonymous substitutions can be expected to correlate with the synonymous rate. In fact the number of synonymous substitutions and that of non- synonymous substitutions outside the PBR are nearly the same in many pairs of alleles, implying that the nonsynonymous sites in the non-PBR are conserved as in other loci (KIMURA 1983) and that the degree of selective constraint has been 1/3 for a long time. This is because there are about 2.7 times more nonsynon- ymous than synonymous sites per locus. For example, when A 3 at the HLA-A locus is compared to A24, there are about 10 synonymous and 9 nonsynonymous sub- stitutions (in addition to 21 nonsynonymous substitu- tions in the PBR). Thus, the ratio of nonsynonymous to synonymous changes per site is about 1/3. How- ever, there are some exceptional pairs in which the nonsynonymous substitutions are significantly larger or lower than the synonymous substitutions: in com- parison of A 3 ( A 2 ) and A 3 2 ( A 2 8 ) , there are about 10
(7)
synonymous substitutions, but there are 20 (1) nonsynonymous substitutions outside the PBR. From a view of the neutral theory (KIMURA 1983), these deviations may be caused by changes in the degree of selective constraint. Further analysis of PBR-linked nonsynonymous changes will be made elsewhere.Under the overdominance-type hypothesis, there
may be deficiency of homozygotes (deviation from Hardy-Weinberg proportion) and there may exist sub-
stantial segregation load, Lg (CROW and KIMURA
1970). This load can be expressed by Lg = SF and becomes
in which equation the right hand side can be derived from KIMURA and CROW (1964). If we use the ob- served number of alleles for n, then Lg
=
0.05s for both D R B l and DQBl. Even when selection is as strong as s = 0.1, the L, is no greater than one percent at either of these loci and the total genetic load fork
such loci with Lg = 0.01 becomes 1-
(1-
L,)k = 1-
0.9gk. Therefore, once such unparalleled polymor- phic loci as Mhc have evolved, constant segregation of homozygotes does not produce any substantial genetic load. It was noted long ago by CROW (1958) that the population can reduce L, by increasing the number of alleles that are maintained under overdominance se- lection.We have assumed that individuals in a population mate at random. However, since any natural popula- tion is to some extent structured geographically, we must consider the effects of population subdivision. If
generation, the whole population can be regarded as randomly mating and there is little local genetic dif- ferentiation
(WRIGHT
193 1). For balanced alleles, the ancestry is elongated by the factor$ = 4 2 N ) relativeto the neutral one so that there is a high probability that allelic lineages migrated over various subpopula- tions since they diverged from a common ancestor. In effect, operation of overdominance-type selection is equivalent to increasing N by$ (TAKAHATA 1990) so
that the condition for random mating would be 4N$m
>
1. Since$ can be much larger than 1, the extent oflocal genetic differentiation at balanced loci becomes relatively low even if the value of 4Nm does not greatly exceed 1. Compilation of gene frequency data (ROY-
CHOUDHURY and NEI 1988) shows a relatively small
extent of geographic differentiation at HLA loci among human populations, although this does not necessarily deny the possibility of subdivided popula- tion structure in the early history of hominids.
All of these considerations lead to the conclusion that the overdominance-type model, which is also appropriate to the case of disassortative mating (KAR-
LIN and FELDMAN 1968; POTTS, MANNING and WAKE-
LAND 1991), is consistent with the main features of
Mhc polymorphism and that currently there is no reason to reject it. As noted by DOHERTY and ZINK-
ERNAGEL (1975) and KLEIN (1986), the biological
cause of selection at the Mhc loci must be related to the fact that the T cells have dual specificity and that they simultaneously recognize viral (as well as other) antigens (nonself) and Mhc molecules of the stimulat- ing and target cells (self).
We thank two anonymous reviewers and the corresponding editor for valuable suggestions. This work was supported by a grant from the Ministry of Education, Science and Culture, Japan, and grant R01 AI23667 from the National Institutes of Health, Be- thesda, Maryland.
LITERATURE CITED
BLACK, F. E., and F. M. SALZANO, 1981 Evidence for heterosis in the HLA system. Am. J. Hum. Genet. 33: 894-899.
BJORKMAN, P. J., M. A. SAPER, B. SAMRAOUI, W. S. BENNET, J. L. STROMINGER and D. C. WILEY, 1987a Structure of the human class I histocompatibility antigen, HLA-A2. Nature 329 506-5 12.
BJORKMAN, P. J., M. A. SAPER, B. SAMRAOUI, W. S. BENNET, J. L. STROMINGER and D. C. WILEY, 1987b The foreign antigen binding site and T cell recognition regions of class I histocom- patibility antigens. Nature 329: 512-518.
BROWN, J. H., T. JARDETZKY, M. A. SAPER, B. SAMRAOUI, P. J. BJORKMAN and D. C. WILEY, 1988 A hypothetical model of the foreign antigen binding site of class I1 histocompatibility molecules. Nature 332: 845-850.
CLARK, A. G., and T.-H. KAO, 1991 Excess nonsynonymous sub- stitution at shared polymorphic sites among self-incompatibility alleles of Solanaceae. Proc. Natl. Acad. Sci. USA 88: 9823- 9827.
tensities in man. Hum. Biol. 3 0 1-13.
CkOW, J. F., 1958 Some possibilities for measuring selection in-
CROW, J. F., and M. KIMURA, 1970 An Introduction to Population Genetics Theory. Harper & Row, New York.
DEGOS, L., J. COLOMBANI, A. CHAVENTRE, B. BENGTSON and A.
JACQUARD, 1974 Selective pressure on HLA-A polymor- phism. Nature 249: 62-63.
DENNISTON, C., and J. F. CROW, 1990 Alternative fitness models with the same allele frequency dynamics. Genetics 125: 201- 205.
DOBZHANSKY, TH., 1970 Genetics of the Evolutionary Process. Co-
lumbia University Press, New York.
DOHERTY, P. C., and R. M. ZINKERNAGEL, 1975 Enhanced im- munological surveillance in mice heterozygous at the H-2 gene complex. Nature 256: 50-52.
FIGUEROA, F., E. GUNTHER and J. KLEIN, 1988 MHC polymor- phism pre-dating speciation. Nature 335 265-267.
HAYASHIDA, H., and T . MIYATA, 1983 Unusual evolutionary con- servation and frequent DNA segment exchange in class I genes of the major histocompatibility complex. Proc. Natl. Acad. Sci.
HEDRICK, P. W., and G. THOMSON, 1983 Evidence for balancing selection at HLA. Genetics 104 449-456.
HEDRICK, P. W., W. KLITZ, W. P. ROBINSON, M. K. KUHNER and G. THOMSON, 1991 Population genetics of HLA, pp. 248- 271 in Evolution at the Molecular Level, edited by R. K. SELAN-
DER, A. G. CLARK and T. S. WHITTAM. Sinauer Associates,
Sunderland, Mass.
HILL, S. A,, C. E. M. ALLSOPP, D. KWIATKOWSKI, N. M. ANSTEY,
P. TWUMASI, P. A. ROWE, S. BENNETT, D. BREWSTER, A. J.
MCMICHAEL and B. M. GREEWOOD, 1991 Common West African HLA antigens are associated with protection from severe malaria. Nature 352: 595-600.
HOWARD, J. C., 1991 Disease and evolution. Nature 352: 565- 567.
HUDSON, R. R., and N. L. KAPLAN, 1988 The coalescent process in models with selection and recombination. Genetics 120:
HUDSON, R. R., M. KREITMAN and M. A G U A D ~ , 1987 A test of neutral molecular evolution based on nucleotide data. Genetics 116: 153-159.
HUGHES, A. L., and M. NEI, 1988 Pattern of nucleotide substitu- tion at major histocompatibility complex class I loci reveals overdominant selection. Nature 335: 167-1 70.
HUGHES, A. L., and M. NEI, 1989 Nucleotide substitution at major histocompatibility complex class I1 loci: evidence for overdom- inant selection. Proc. Natl. Acad. Sci. USA 8 6 958-962.
JIN, L., and M. NEI, 1990 Limitations of the evolutionary parsi-
mony method of phylogenetic analysis. Mol. Biol. Evol. 7: 82-
102.
JUKES, T. H., and C. R. CANTOR, 1969 Evolution of protein molecules, pp. 21-32 in Mammalian Protein Metabolism, edited by H. N. MUNRO. Academic Press, New York.
KARLIN, S., and M. W. FELDMAN, 1968 Further analysis of nega- tive assortative mating. Genetics 59: 1 17-1 36.
KIMURA, M., 1968 Evolutionary rate at the molecular level. Na- ture 217: 624-626.
KIMURA, M., 1983 The Neutral Theory of Molecular Evolution.
Cambridge University Press, Cambridge.
KIMURA, M., and J. F. CROW, 1964 The number of alleles that can be maintained in a finite population. Genetics 4 9 725- 738.
KINGMAN, J. F. C., 1982 On the genealogy of large populations. J. Appl. Probab. 19A: 27-43.
KLEIN, J., 1980 Generation of diversity at MHC loci: implications for T cell receptor repertories, pp. 239-253 in Immunology 80,
edited by M. FOUGEREAU and J. DAUSSET. Academic, London. KLEIN, J., 1986 Natural History of the Major Histocompatibility Com-
plex. John Wiley & Sons, New York.
USA 8 0 2671-2675.
936 N. Takahata, Y. Satta and J. Klein
KLEIN, J., 1990 Immunology. Blackwell Scientific Publications, Ox- ford.
KLEIN, J., 1991 Of HLA, tryps, and selection: an essay on coevo- lution of MHC and parasites. Hum. Immunol. 3 0 247-258. KLEIN, J., J. GUTKNECHT and N. FISCHER, 1990 The major histo-
compatibility complex and human evolution. Trends Genet. 6: 7-1 1.
KLITZ, W., and G. THOMSON, 1987 Disequilibrium pattern analy- sis. 11. Application of Danish HLA A and B locus data. Genetics
LAWLOR, D. A., J. ZEMMOUR, P. P. ENNIS and P. PARHAM, 1988 Evolution of class I MHC genes and proteins: From natural selection to thymic selection. Nature 335: 268-27 1. LEDERMANN, W. (Editor), 1984 Handbook of Applicable Mathemat-
ics, Vol. VI (Part A). John Wiley & Sons, New York.
LEWONTIN, R. C., 1985 Population genetics. Annu. Rev. Genet.
LEWONTIN, R. C., L. R. GINZBURG and S. D. TULJAPURKAR,
1978 Heterosis as an explanation for large amounts of genic polymorphism. Genetics 88: 149-170.
LI, W.-H., C.-C. LUO and C.-I. WU, 1985 Evolution of DNA sequences, pp. 1-94, in Molecular Evolutionary Genetics, edited by R. J. MACINTYRE. Plenum, New York.
MARSH, S. G. E., and J. G. BODMER, 1991 HLA Class 11 nucleotide sequences, 1991. Immunogenetics 33: 321-334.
MARUYAMA, T., and M. NEI, 1981 Genetic variability maintained by mutation and overdominant selection in finite populations. Genetics 98: 441-459.
MAYER, W. E., M. JONKER, D. KLEIN, P. IVANYI, G. VAN SEVENTER
and J. KLEIN, 1988 Nucleotide sequences of chimpanzee MHC class I alleles: evidence for trans-species mode of evolu- tion. EMBO J. 7: 2765-2774.
MCCONNELL, T . J., W. S. TALBOT, R. A. MCINDOE and E. K. WAKELAND, 1988 The origin of MHC class I1 gene polymor- phism within the genus Mus. Nature 332: 651-654.
NEI, M., 1987 Molecular Evolutionary Genetics. Columbia Univer- sity Press, New York.
NEI, M., and A. L. HUGHES, 1991 Polymorphism and evolution of the major histocompatibility complex loci in mammals, pp. 222-247 in Evolution at the Molecular Level, edited by R. K. SELANDER, A. G. CLARK and T . S. WHITTAM. Sinauer Associ- ates, Sunderland, Mass.
POTTS, W. K., C. Jo MANNING and E. K. WAKELAND, 1991 Mating patterns in seminatural populations of mice influenced by MHC genotype. Nature 352: 6 19-62 1.
RITTE, U., E. NEUFELD, C. O'HUIGIN, U. MORTO, F. FIGUEROA and J. KLEIN, 1991 Possible selection for H-2 heterozygotes in natural populations of the house mouse, pp. 435-440 in Molec- ular Evolution of the Major Histocompatibility Complex, edited by J. KLEIN and D. KLEIN. Springer-Verlag, Heidelberg. ROBERTSON, A,, 1962 Selection for heterozygotes in small popu-
lations. Genetics 47: 1291-1 300.
ROYCHOUDHURY, A. K., and M. NEI, 1988 Human Polymorphic Genes: World Distribution. Oxford University Press, Oxford. SAVATIER, P., G. TRABUCHET, Y. CHEBLOUNE, C. FAURE, G. VER-
DIER and V. M. NIGO, 1987 Nucleotide sequences of the P-
globin genes in gorilla and macaque: the origin of nucleotide polymorphisms in human. J. Mol. Evol. 2 4 309-318.
SATTA, Y., 1992 Balancing selection at HLA loci, in The Proceed- ings of the 17th Taniguch Symposium, edited by N. TAKAHATA. Japan Scientific Societies Press, Tokyo (in press).
SATTA, Y., N. TAKAHATA, C. SCHONBACH, J. GUTKNECHT and J.
KLEIN, 1991 Calibrating evolutionary rates at the major his- tocompatibility complex loci, pp. 51-62 in Molecular Evolution
of the Major Histocompatibility Complex, edited by J. KLEIN and D. KLEIN. Springer-Verlag, Heidelberg.
SERJEANTSON, S. W., 1989 The reasons for MHC polymorphism in man. Transplant. Proc. 21: 598-601.
1 1 6 633-643.
19: 81-102.
SPENCER, H. G., and R. W. MRAKS, 1988 The maintenance of single-locus polymorphism. I. Numerical studies of a viability selection model. Genetics 120: 605-613.
TAJIMA, F., 1983 Evolutionary relationship of DNA sequences in finite populations. Genetics 105: 437-460.
TAKAHATA, N., 1990 A simple genealogical structure of strongly balanced allelic lines and trans-species evolution of polymor- phism. Proc. Natl. Acad. Sci. USA 87: 2419-2423.
TAKAHATA, N., 1991a Trans-species polymorphism of HLA mol- ecules, founder principle, and human evolution, pp. 29-49 in
Molecular Evolution of the Major Histocompatibility Complex, ed- ited by J. KLEIN and D. KLEIN. Springer-Verlag, Heidelberg. TAKAHATA, N . , 1991b Overdispersed molecular clock at the ma-
jor histocompatibility complex loci. Phil. Trans. R. SOC. Lond.
TAKAHATA, N., and M. NEI, 1985 Gene genealogy and variance of interpopulational nucleotide differences. Genetics 110: 325- 344.
TAKAHATA, N., and M. NEI, 1990 Allelic genealogy under over- dominant and frequency-dependent selection and polymor- phism of major histocompatibility complex loci. Genetics 124:
TAKAHATA, N., and F. TAJIMA, 1991 Sampling errors in phylo- geny. Mol. Evol. Biol. 8: 494-502.
T A V A R ~ , S., 1984 Lines-of-descent and genealogical processes, and their applications in population genetics models. Theor. Popul. Biol. 26: 119-164.
THOMSON, G., 1988 HLA disease associations: models for insulin dependent diabetes mellitus and the study of complex human genetic disorders. Annu. Rev. Genet. 22: 3 1-50.
TIWARI, J. L., and P. TERASAKI, 1985 HLA and Disease Associa- tions. Springer-Verlag, New York.
UZZELL, T., and K. W. CORBIN, 1971 Fitting discrete probability distributions to evolutionary events. Science 172: 1089-1096. WATTERSON, G. A., 1975 On the number of segregating sites in
genetical models without recombination. Theor. Popul. Biol.
WATTERSON, G. A., 1984 Lines-of-descent and the coalescent. Theor. Popul. Biol. 26: 77-92.
WRIGHT, S., 1931 Evolution in Mendelian populations. Genetics 16: 97-159.
WRIGHT, S., 1939 The distribution of self-sterility alleles in pop- ulations. Genetics 24: 538-552.
WRIGHT, S., 1969 Evolution and the Genetics of Populations, Vol. 2. The Theory of Gene Frequencies. University of Chicago Press, Chicago.
YOKOYAMA, S., and M. NEI, 1979 Population dynamics of sex- determining alleles in honey bees and self-incompatibility al- leles in plants. Genetics 91: 609-626.
ZEMMOUR, J., and P. PARHAM, 1991 HLA Class I nucleotide sequences, 1991. Immunogenetics 33: 3 10-320.
B 243: 13-18.
967-978.
7: 256-276.
Communicating editor: A. G. CLARK
APPENDIX