ISSN: 2319-8753
I
nternational
J
ournal of
I
nnovative
R
esearch in
S
cience,
E
ngineering and
T
echnology
(An ISO 3297: 2007 Certified Organization)
Vol. 3, Issue 6, June 2014
Copyright to IJIRSET www.ijirset.com 13326
Pinku Sarma
Assistant professor, Department of Chemistry, D.k. College, India.
ABSTRACT: The quality analysis of some physio-chemical parameters of the ground water collected from different
locations of nearby area of Mirza, all used for drinking purpose was done in this work.The average pH values were found in the range 6.3-7.6. . The average values of temperature for the ground water sources were found without much variation. The Electrical conductivity and Hardness (Ca & Mg) of ground water were found within the permissible limit. The value of conductance gives a qualitative measurement of extent of mineralization of water.
KEYWORDS: Hardness, Electrical conductivity, temperature, ground water.
I. INTRODUCTION
The chemical composition of ground water is vital for the natural functioning of ground water in ecosystem, drinking water production and anthropogenic use of ground water for agriculture, industrial and other purpose.1 It is believed that ground water is purer and safer than surface water due to protective qualities of the soil cover. Many unseen dissolved mineral and organic constituents are present in ground water in various concentrations. Generally ground water carries higher mineral content than surface water because of slow circulation and longer period of contact with sediment materials. Ground water is less susceptible to bacterial pollution than surface water because the soil and rocks through which ground water flows screen out most of the bacteria. Hydrothermal processes including dissolution, precipitation, ion exchange, sorption, desorption together with the residence time occuring along the flow path, control the variation in chemical composition of ground water. The WHO has introduced a set of guidelines for drinking water quality (WHO, 2004) to ensure physical, chemical and biological composition of water within the limit; so as not to cause any undesirable effect on humans over a long period of consumption.2
Naturally occurring nitrate, phosphate, magnesium, chloride and total dissolved solids (TDS) can make ground water unsuitable for drinking. Common problems of drinking water include exposure to toxic inorganic substances, heavy metals, bacterial and other pathogens, increased nitrogen concentration and other trace chemicals and micronutrients in drinking water resources. The consumption of nitrate contaminated water causes high risk of methaemoglobinaemia in infants and also cause disorders of alimentary canal, respiratory and nervous system.3,4 A high phosphorus load is often the result of agricultural activities or domestic pollution. Fluoride is both beneficial and harmful for living organism. Intake of small quantity of fluoride in the permissible limit of 0.5-1.0 mg/L is known to be beneficial for human health in production and maintenance of healthy teeth and bones. However, a concentration higher than 1.5 mg/L can cause dental and skeleton fluorosis.5
ISSN: 2319-8753
I
nternational
J
ournal of
I
nnovative
R
esearch in
S
cience,
E
ngineering and
T
echnology
(An ISO 3297: 2007 Certified Organization)
Vol. 3, Issue 6, June 2014
Copyright to IJIRSET www.ijirset.com 13327
Table 1: Drinking water guideline for physical and bacteriological water quality parameters prescribed by WHO/BIS
(Bureau of Indian Standard) are as shown in the following table:
Parameter WHO (DL-PL) mg/L BIS (DL-PL) mg/L
Colour in hazen unit 5-25 5-25
Odour Agreeable-Agreeable 5-25
Turbidity in NTU 5-19 5-10
DO 5-8 mg/L 5-10
DL- Desirable Limit, PL- Permissible Limit, NTU- Nephalometric Turbidity Unit.
II.AIMS AND OBJECTIVES:
The main objective to this study is to determine the some physio-chemical properties of nearby area of Mirza. The physio-chemical properties determined are Viz;
A. PH
B. Odour
C. Temperature
D. Electrical Conductivity and
E. Hardness (Ca and Mg)
III.EXPERIMENTAL
Polyethylene bottles of 2L capacity is used for sampling purpose. The sampling bottles were washed with soap, followed by dil. HNO3, tap water and finally with distilled water. When water is collected from tube wells the water is made to
run from the sampling source for 4-5 minute before taking the final sample.
IV.STUDY AREA
For taking water sample the nearby area of Mirza are:
ISSN: 2319-8753
I
nternational
J
ournal of
I
nnovative
R
esearch in
S
cience,
E
ngineering and
T
echnology
(An ISO 3297: 2007 Certified Organization)
Vol. 3, Issue 6, June 2014
Copyright to IJIRSET www.ijirset.com 13328
A B
Fig.1: The above figure A,B shown the places of water collected from Bijoynagar, Batarhat respectively. During the time of collection of water sample temperature and pH is measured immediately. Temperature is the most Important parameter
which measures the physical and biological parameters of water.
C D
Fig.2: The above figure C,D shown the places of water collected from Nahira, Rampur respectively. The ph and temperature is measured immediately as above sample. After that other parameter like electrical conductivity, hardness is measured
ISSN: 2319-8753
I
nternational
J
ournal of
I
nnovative
R
esearch in
S
cience,
E
ngineering and
T
echnology
(An ISO 3297: 2007 Certified Organization)
Vol. 3, Issue 6, June 2014
Copyright to IJIRSET www.ijirset.com 13329
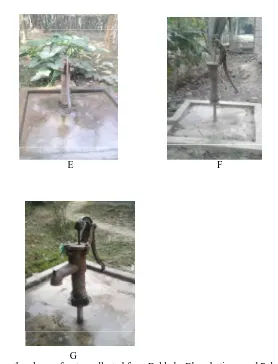
E F
G
Fig. 3: The above figure E.F.G shown the places of water collected from Dakhala, Bhagabatipara and Palasbari respectively.
All the above figure shown the places from where the water sample collected. In all the places minimum temperatre is found to be 18.40C and maximum is found to be 26.50C. During the present investigation, pH varies between 6.3-7.6. The other parameters electrical conductivity and hardness are also found to be within the range as per WHO limit.
V. RESULTS AND DISCUSSION
A. Physio-Chemical parameters of Ground water
Temperature: Temperature is one of the most important physical parameter which control the other physical, chemical and
ISSN: 2319-8753
I
nternational
J
ournal of
I
nnovative
R
esearch in
S
cience,
E
ngineering and
T
echnology
(An ISO 3297: 2007 Certified Organization)
Vol. 3, Issue 6, June 2014
Copyright to IJIRSET www.ijirset.com 13330
Table II: Temperature (0C) of ground water samples:
Sampling site Temperature (0C)
A 25.2
B 19.5
C 26.3
D 20.5
E 24.3
F 19.8
G 26.5
H 25.2
I 18.4
pH: The pH of ground water samples were determined with a digital pH meter. The pH values for water generally lie between 6.5-8.5. During the present investigation, pH varies between 6.3-7.6.
Table III: pH values of ground water samples:
Sampling site pH
A 7.15
B 7.28
C 6.19
D 7.03
E 7.27
F 7.38
G 7.02
H 7.31
I 7.19
Odour: Disagreeable odour and metallic taste were observed in some of the samples. This may be due to high content of iron.
VI.ELECTRICAL CONDUCTIVITY
The maximum limit of electrical conductivity in drinking water is prescribed as 1,500 µs/cm as per WHO standard. The electrical conductivity values in all the study area are found below this limit. This shows that the ionic content of ground water samples are not excessive.
Table IV: Conductance (µs/cm) of ground water samples
Sampling site Conductivity (µs/cm)
A 163
B 215
C 132
D 105
E 255
ISSN: 2319-8753
I
nternational
J
ournal of
I
nnovative
R
esearch in
S
cience,
E
ngineering and
T
echnology
(An ISO 3297: 2007 Certified Organization)
Vol. 3, Issue 6, June 2014
Copyright to IJIRSET www.ijirset.com 13331
G 264
H 381
I 261
VII.DETERMINATION OF HARDNESS (CA & MG)
Calcium: It is the fifth among the elements in natural water in order of abundances. Calcium contributes to the hardness
making the water unsuitable for some of its uses. It has no record causing adverse effect on human health. The guideline value of Ca in drinking water is 100mg/L. It has been found that all the ground water samples are within the permissible limit.
Table V: Calcium content (mg/L) of ground water samples:
Sampling site Ca (mg/L)
A 18
B 25
C 47
D 37
E 20
F 53
G 62
H 42
I 58
Magnesium: WHO recommended the permissible limit of Mg in drinking water 150 mg/L. In this study all are in the permissible limit.
Table VI: Magnesium content (mg/L) of ground water samples:
Sampling site Mg (mg/L)
A 9.27
B 6.83
C 12.04
D 4.88
E 9.76
F 3.43
G 17.42
H 26.74
I 14.15
VIII.CONCLUSION:
ISSN: 2319-8753
I
nternational
J
ournal of
I
nnovative
R
esearch in
S
cience,
E
ngineering and
T
echnology
(An ISO 3297: 2007 Certified Organization)
Vol. 3, Issue 6, June 2014
Copyright to IJIRSET www.ijirset.com 13332 REFERENCES:
[1] Abbasi, S.A., ‘Environmental pollution and its control’, Congent International, First ed,1998.
[2] Adak, M.D., and K.M. Purohit “poll. Res.”, status of surface and groundwater quality of Mandiakudar part-I : physio-chemical parameters , Vol 20 (1) , p. 103-110, 2001.
[3] Bobby, cruz, G.K. Priya and P. Nagrajan, “Ind. J. Env. Prot.”, Ground water quality deterioration in Trichirapalli city, Vol 20(3), p. 171-173, 2000.
[4] H.P. Sarma, “Indian Journal Of Environmental Protection”, Quality of drinking water of tubewells and municipal supply water with respect to.
Na, k, Ca, Mg, Fe in Darrang district , 21 (11), 1006-1011,2001
[5] H.P. Sarma, “ecology , environment & conservation”, A study in generation and disposal of solid waste in guwahati city , 11(4), 653-656,