Copyright1998 by the Genetics Society of America
Testing for Epistasis Between Deleterious Mutations
S. A. West,* A. D. Peters
†and N. H. Barton*
*Institute of Cell, Animal and Population Biology, University of Edinburgh, Edinburgh EH9 3JT, United Kingdom
and†Department of Biology, Indiana University, Bloomington, Indiana, 47405 Manuscript received September 18, 1997
Accepted for publication February 4, 1998
ABSTRACT
Determining the way in which deleterious mutations interact in their effects on fitness is crucial to numerous areas in population genetics and evolutionary biology. For example, if each additional mutation leads to a greater decrease in log fitness than the last (synergistic epistasis), then the evolution of sex and recombination may be favored to facilitate the elimination of deleterious mutations. However, there is a severe shortage of relevant data. Three relatively simple experimental methods to test for epistasis between deleterious mutations in haploid species have recently been proposed. These methods involve crossing individuals and examining the mean and/or skew in log fitness of the offspring and parents. The main aim of this paper is to formalize these methods, and determine the most effective way in which tests for epistasis could be carried out. We show that only one of these methods is likely to give useful results: crossing individuals that have very different numbers of deleterious mutations, and comparing the mean log fitness of the parents with that of their offspring. We also reconsider experimental data collected on
Chlamydomonas moewussi using two of the three methods. Finally, we suggest how the test could be applied
to diploid species.
D
ETERMINING the way in which deleterious muta- tion because a relatively large number of deleterious mutations will be eliminated from sexual populations tions interact in their effects on fitness is crucial toin the low quality offspring that have particularly high numerous areas in population genetics and evolutionary
numbers of deleterious mutations. Given a sufficient biology (reviewed byKondrashov1993). These
interac-mutation rate, this advantage can be more than suffi-tions may take three forms: (1) independently
(multipli-cient to balance the two-fold cost of sex. However, evi-cative selection), (2) each additional mutation leading
dence for synergistic epistasis comes primarily from the to a greater decrease in log fitness than the last
(syner-non-linear fitness decline in a mutation accumulation gistic epistasis), or (3) each additional mutation leading
experiment with Drosophila melanogaster (Mukai1969), to a smaller decrease in log fitness than the last
(antago-and several possible problems with such experiments nistic epistasis). It is convenient to work in log fitness
have been pointed out (Keightley1996). because on this scale the three possibilities can be
distin-de Visseret al. (1996, 1997a) have recently suggested guished by the different relations that they predict with
that tests for epistasis between deleterious mutations the number of deleterious mutations (Charlesworth
can be conducted in haploid species by crossing two 1990; Figure 1). Multiplicative selection leads to log
individuals and examining the mean and/or skew in fitness decreasing linearly with increasing number of
log fitness of their offspring (before selection has taken mutations. In contrast, synergistic and antagonistic
epi-place). They used their techniques to test for synergistic stases lead to nonlinear curves, with the slope declining
epistasis in Chlamydomonas moewussi, a haploid unicellu-more (concave) and less (convex) steeply as the number
lar algae. This novel approach is particularly important of deleterious mutations increases, respectively.
because it provides a relatively simple way to experimen-Many theoretical studies have relied on the
assump-tally test for synergistic epistasis. Here, we extend the tion that deleterious mutations interact with synergistic
underlying theory, and determine the most effective epistasis. For example, if deleterious mutations interact
way in which tests for epistasis could be carried out. We with synergistic epistasis then sexual reproduction and
also reconsider the experimental data on C. moewussi recombination provide an advantage over asexual
re-thatde Visseret al. (1996, 1997a) collected using two production because they enable individuals to better
of these methods. Finally, we suggest how the test could eliminate deleterious mutations (the Mutational
Deter-be applied to diploid species. ministic hypothesis;Kondrashov1982, 1984;
Charles-worth 1990). Synergistic epistasis leads to this
predic-MEAN LOG FITNESS
de Visseret al. (1996) pointed out that, in a haploid Corresponding author: S. A. West, Institute of Cell, Animal and
Popula-species, comparing the mean log fitness of sexually
pro-tion Biology, University of Edinburgh, Edinburgh EH9 3JT, UK.
E-mail: [email protected] duced offspring with that of their two parents (or
a lower mean log fitness. In contrast, if the two parents have very different numbers of deleterious mutations, then their variance in numbers of deleterious mutations will be greater than that amongst their offspring, and so synergistic epistasis would lead to the offspring having a greater mean log fitness.
We now formalize and quantify the above argument. Consider two haploid parents which have exactly n1and
n2deleterious mutations, respectively. The mean (Mp)
and variance (Vp) in the number of deleterious
muta-tions per individual in the parents (or their combined asexual offspring) are Mp 5 (n1 1 n2)/2, and Vp 5
(n12n2)2/4, respectively. In contrast, assuming random segregation and free recombination, the mean (Mo) and
variance (Vo) in the number of deleterious mutations
Figure1.—The relationship between log fitness and
num-carried by the offspring can be obtained by summing ber of deleterious mutations. The lines represent the three
two binomial distributions, and are given by Mo5(n11
ways in which deleterious mutations may interact in their
effects on fitness: antagonistic epistasis (a 5 0.02, b 5 n2)/2, and Vo 5(n1 1n2)/4, respectively. Notice that,
20.00008); multiplicative selection (a 50.025,b 50), and although the means are identical, the variances differ. synergistic epistasis (a 50.002,b 50.0008).
Two important limiting cases, which confirm the verbal arguments given above, are: (1) if n15n2then Vp50,
and so Vo . Vp (assuming n1 . 0), and (2) if n1 Àn2 ally produced offspring) can provide information about
then Vp.Vo(Vp≈n12/4; Vo≈ n1/4).
the way in which deleterious mutations interact. The
In order to determine the difference in mean log sexually produced offspring of a cross between two
indi-viduals will, due to random segregation and recombina- fitness between offspring and parents, it is necessary to tion, have a symmetrical (i.e., binomial) distribution of assume a relationship between the number of deleteri-mutations per individual, with the mean equal to that ous mutations and fitness. Following Charlesworth of their parents. If deleterious mutations interact multi- (1990) we assume that log fitness (w) follows a quadratic plicatively, then the mean offspring log fitness will equal function with the number of deleterious mutations (n): the mean log fitness of the parent lines. However, if
deleterious mutations show epistasis, then the mean log log(w)5 2
1
an1 b 2n2
2
. (1)fitness of the offspring lines can differ from that of their parents. If the parents have identical or very similar
The various ways in which deleterious mutations interact numbers of deleterious mutations, then the mean
off-are then represented by: b . 0 (synergistic epistasis); spring log fitness is predicted to be lower (synergistic
b 50 (multiplicative selection), andb ,0 (antagonistic epistasis) or greater (antagonistic epistasis) than that
epistasis). The ratiob/ameasures the degree of epista-of their parents. In contrast, if the parents have very
sis (Charlesworthet al. 1990). This quadratic relation-different numbers of deleterious mutations, then the
ship was chosen to facilitate comparison with previous mean offspring log fitness is predicted to be greater
studies, and because it allows for a wide variety of forms (synergistic epistasis) or lower (antagonistic epistasis)
of epistasis. than that of their parents.
We present results for a wide range of values ofaand These predictions can be understood intuitively by
b, representing a variety of forms of epistasis.Mukai’s comparing the variance in the number of deleterious
(1969) mutation accumulation experiment with D. mela-mutations amongst sexually produced offspring with
nogaster suggested that the values ofaandbare: 0.002 that amongst their two parents. For example, with
syner-and 0.0008, respectively, when deleterious mutations gistic epistasis, increasing the variance in the number
are heterozygous (assuming that the coefficient of domi-of deleterious mutations decreases the mean log fitness
nance is 0.2), and 0.014 and 0.011, respectively, when because of the particularly low fitness experienced by
deleterious mutations are homozygous (Crow 1970; individuals with high numbers of deleterious mutations
Charlesworth 1990). The homozygous coefficients (or relatively high fitness of individuals with
intermedi-may be more appropriate for haploids. However, in the ate numbers of deleterious mutations). If the two
par-discussion we suggest that these methods can also be ents have equal (or very similar) numbers of deleterious
applied to diploids, and so present results over parame-mutations then they will have zero (or very small)
vari-ter values that include both of these possibilities. In ance in the number of deleterious mutations.
Conse-addition, it has been suggested thatMukai’s experiment quently, the variance in the number of deleterious
mu-may have overestimated the extent of epistasis ( Keight-tations amongst the offspring will be greater and so
point to note here is that different ranges in the num-bers of deleterious mutations per parent should be con-sidered for different values of a andb. For example, when a and b are 0.002 and 0.0008, respectively, 75 deleterious mutations are required for the fitness of an individual to fall below 0.01. In contrast, with values of 0.014 and 0.011 foraandb, only 20 deleterious muta-tions are required for such a decline in fitness.
In order to use Equation 1 to calculate the mean log fitness of parents and their offspring, we must calculate the mean fitness of a group of individuals with a given mean (n) and variance (Vn) in the number of deleterious
mutations per individual. The mean of the number of mutations squared will be given by the equation n2 5
n21V
n, and so the mean log fitness will be
log(w)5 2
1
an1 b2(n 21 V
n)
2
(2)Figure 2.—The predicted difference in mean log fitness (Charlesworth and Barton 1996). Note that, with between offspring and their parents, when the parents have equal numbers of deleterious mutations. The lines represent synergistic epistasis, increasing the variance in
deleteri-different values ofb; variation in ahas no effect. The lines ous mutations leads to a decrease in log fitness. The
in which b 50.011 and b 50.002 are only continued up mean log fitness of the parents (wp) and their offspring until when each parent has 30 and 75 deleterious mutations,
(wo) can be calculated by substituting Mp, Vp, Moand Vo respectively, because above this their fitness would be
incredi-bly low (,0.00001 even ifa 50). into Equation 2. The difference in mean log fitness
between the offspring and their parents [Dlog(w) 5 log(wo)2log(wp)] is given by
for realistic values ofb, are extremely small and would be very hard to detect experimentally.
Dlog(w)5 b 8 (n
2
1 1n2222n1n22n12n2)
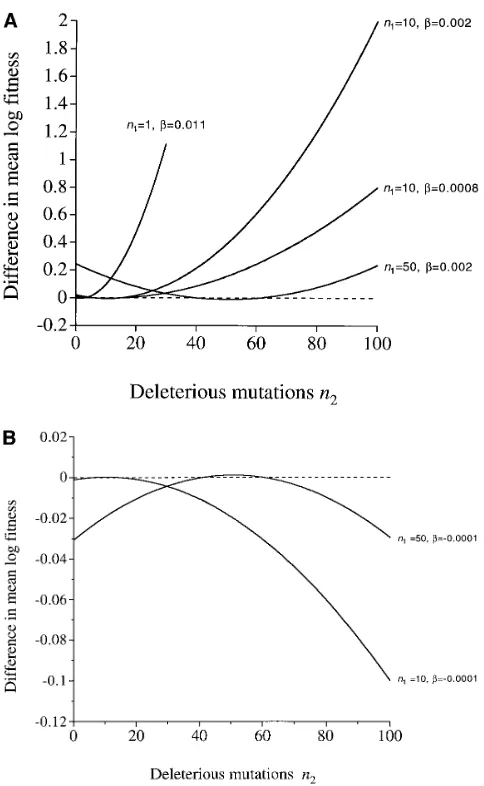
We shall now consider the case where two parents have different numbers of deleterious mutations. Some
5b
2(Vp2 Vo) . (3) examples are plotted in Figure 3 and illustrate twopoints. First, the number of deleterious mutations in the two parents need only differ by a small amount to The difference in mean log fitness is linearly related to
predict a difference in mean log fitness equal to zero or the extent of epistasis (b), and the difference in variance
in the opposite direction to that predicted with exactly of numbers of deleterious mutations per individual
be-equal numbers of deleterious mutations. This will be a tween parents and their offspring (Vp2 Vo). The value
problem if the number of deleterious mutations in each of a does not enter into Equation 3, and so has no
parent cannot be directly measured and so must be effect on the predicted difference. Note that, for small
inferred. Consequently, when crossing two lines with changes in fitness, log(wo)2 log(wp)≈wo 2wp(Burt
approximately equal numbers of deleterious mutations, 1995).
all possible results could be explained by synergistic or Let us first consider the case where the two parents
antagonistic epistasis! have equal numbers of deleterious mutations (n15n25
The second point illustrated by Figure 3 is that
cross-Mp). Equation 3 then simplifies to
ing lines with very different numbers of deleterious mu-tations can lead to much larger differences in mean log
Dlog(w)5 2bMp
4 fitness than crossing lines with the same number of
deleterious mutations. Furthermore, these differences [Figure 2; followingCharlesworth(1990), only a nar- should be large enough to be experimentally detectable. row range of negativebvalues are shown]. Variation in Crossing lines with relatively low numbers of deleterious
a has no effect. Larger differences in log fitness are mutations with lines with relatively large numbers of predicted with greater numbers of deleterious muta- deleterious mutations would, therefore, appear to be tions. So, if one were testing for epistasis it would be the best way to use differences in mean log fitness to better to do so with lines that had accumulated large test for epistasis between deleterious mutations. numbers of deleterious mutations. However, it should Mean log fitness, equilibrium populations and the
TABLE 1
The average difference between mean offspring log fitness and mean parent log fitness (recombination
load) in sexual populations at equilibrium
Deleterious mutations per individual
Average difference Mutation rate Mean Variance in log fitness (U ) (n) (Vn) (Dlog(w))
2.0 50.8 49.2 20.000320
1.5 43.6 42.4 20.000240
1.0 35.0 34.2 20.000160
0.5 24.1 23.7 20.000080
0.1 9.8 9.8 20.000014
All cases, moderate synergistic epistasis was assumed (a 5 0.002,b 50.0008). The values for n and Vnare from
Charles-worth(1990), and differ due to the linkage disequilibrium that is caused by epistasis.
worth1990;Barton1995). Substituting into Equation 3, the mean difference between mean offspring log fit-ness and mean parent log fitfit-ness [Dlog(w)] will be
Dlog(w)5 b
4(Vn2n) . (4)
This value increases with the extent of epistasis (b), and as the difference between the mean and the variance in number of deleterious mutations per individual in-creases (see also Charlesworth andBarton 1996). Note also that increasing the extent of epistasis leads to greater linkage disequilibrium, and so increases the difference between the mean and the variance in num-ber of deleterious mutations per individual ( Charles-Figure 3.—The predicted difference in mean log fitness
between offspring and their parents as the number of deleteri- worth1990;Barton1995;Charlesworthand Bar-ous mutations in one parent (n2) varies. The other parent is ton1996).
assumed to have a fixed number of deleterious mutations (n1). Charlesworth(1990) calculated the mean and the (A) Synergistic epistasis. (B) Antagonistic epistasis.
variance in number of deleterious mutations per indi-vidual for five different genomic deleterious mutation per individual. Consequently, random mating with either rates. In all cases, moderate synergistic epistasis was as-synergistic or antagonistic epistasis may lead to a decrease sumed (a 50.002, b 50.0008). The subsequent pre-in mean log fitness with some matpre-ings, and an pre-increase dicted mean difference between mean offspring log fit-with others. The aim of this section is to consider: (1) the ness and mean parent log fitness are given in Table 1. change in mean log fitness that is predicted from random This table illustrates two points about the predicted mating in a sexual population with synergistic epistasis, difference: in all cases it is extremely small (,0.0004), and (2) how often the difference in numbers of deleteri- making it practically impossible to detect experimen-ous mutations, between two individuals drawn at ran- tally (see alsoCharlesworthandBarton1996); and dom from a population, will be large enough to predict it rises with the mutation rate, because of an increasing that their offspring have a higher mean log fitness. In difference between the mean and variance in the num-addition to testing for synergistic epistasis these results ber of deleterious mutations per individual. It is worth have implications for the possible role of deleterious noting here that the above predictions assume that fit-mutations in causing a recombination load (an immedi- ness itself is measured. While it is the actual fitness that ate reduction in fitness due to recombination;Charles- determines the variance in the number of deleterious worthandBarton1996). mutations, it will often only be experimentally possible
Consider a haploid population in which the number to measure a component of fitness.
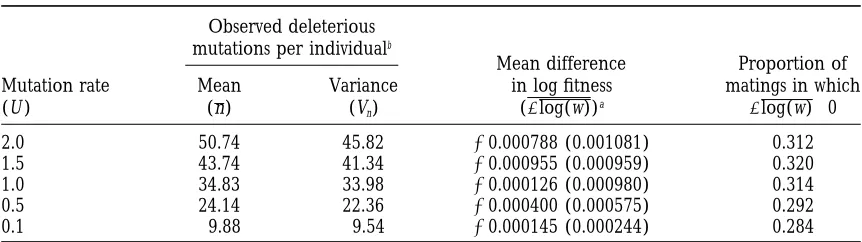
Charles-TABLE 2
The difference between mean offspring log fitness and mean parent log fitness (recombination load) in simulated sexual populations
Observed deleterious mutations per individualb
Mean difference Proportion of Mutation rate Mean Variance in log fitness matings in which
(U ) (n) (Vn) (Dlog(w))a Dlog(w).0
2.0 50.74 45.82 20.000788 (0.001081) 0.312
1.5 43.74 41.34 20.000955 (0.000959) 0.320
1.0 34.83 33.98 20.000126 (0.000980) 0.314
0.5 24.14 22.36 20.000400 (0.000575) 0.292
0.1 9.88 9.54 20.000145 (0.000244) 0.284
Deleterious mutations were assumed to be normally distributed, with the mean and variance predicted for that mutation rate (Table 1;Charlesworth 1990). In all cases, moderate synergistic epistasis was assumed (a 50.002,b 50.0008).
a95% confidence intervals are shown in parentheses. bObserved in 1000 simulated individuals.
tations, between two individuals drawn at random from data (e.g., environmental or measurement) is likely to make more negative values ofDlog(w) become positive a population, is large enough to predict that their
off-spring have a higher mean log fitness. We assumed a than vice versa. This would make acceptance of the null hypothesis more likely (type II error). In addition, this normal distribution, and randomly assigned mutations
to 1000 individuals in 500 mating pairs. The mean log problem would be increased if there was skew in the error. Nonetheless, these results also emphasise the im-offspring fitness and mean log parent fitness were
calcu-lated for each mating pair, and the process repeated portance of crossing numerous distinct lines (i.e., repli-cation at the line level); 30% of matings between individ-for each of the values of n and Vncorresponding to the
mutation rates examined by Charlesworth (1990). uals that came from the same population, and so might have been expected to have “similar” numbers of delete-The results are given in Table 2. As predicted, very small
differences between mean offspring log fitness and rious mutations, resulted in the variance in numbers of deleterious mutations per individual being greater in mean parent log fitness were observed. These
differ-ences were not significantly different from zero, despite the parents than in their offspring (Vp.Vo). In these
matings, the mean offspring log fitness is predicted to sample sizes of 500 and no measurement error,
dem-onstrating how difficult they would be to detect experi- be greater than the mean parent log fitness.
Equation 4 predicts the recombination load due to mentally. However, in all cases, approximately 30% of the
matings led to the mean offspring log fitness being higher epistasis between deleterious mutations in a haploid sexual population at equilibrium. This equation would than the mean parent log fitness (Dlog(w).0). In these
matings the number of deleterious mutations in the two also hold for a diploid species in which all deleterious mutations were heterozygous. Our results (Tables 1 and parents were different enough that their variance was
more than in their offspring (Vp. Vo). The reason why 2) therefore agree with Charlesworthand Barton
(1996), that this is too small to be able to explain the there were only very small average differences overall,
is that the difference in mean log fitness between par- recombination load that has been observed in experi-ments with D. melanogaster.
ents and their offspring is larger when the offspring log fitness is greater (the parents have different numbers of deleterious mutations; Figure 3), than when the
off-SKEW IN OFFSPRING LOG FITNESS spring log fitness is lower (the parents have “similar”
numbers of deleterious mutations; Figure 2). de Visseret al. (1997a) pointed out that, in a haploid species, examining whether the distribution of log fit-These results illustrate a possibly important point to
bear in mind when crossing lines with “similar” levels of ness amongst the offspring of sexual crosses are symmet-rical or skewed can provide information about the way mutations and examining the change in mean log fitness.
The fact that approximately 70% of matings led to the in which deleterious mutations interact. As noted above, these offspring will have a symmetrical distribution of mean offspring log fitness being lower than the mean
parent log fitness (Dlog(w),0) suggests that it might be mutations per individual, with the mean equal to that of their parents. If deleterious mutations interact multi-useful to cross numerous different lines and then analyze
tions show epistasis, then this distribution will be skewed. rising numbers of deleterious mutations. Between these two extremes there will be a large range of values ofa Synergistic epistasis would lead to a negative skew, and
antagonistic epistasis to a positive skew. As with mean andbwhere the skew will peak at intermediate numbers of deleterious mutations. The most important conse-log fitness, this is due to the effects of the relatively low
(synergistic epistasis) or high (antagonistic epistasis) quence of this variable relationship is that it would be almost impossible to carry out control crosses where fitness of individuals with relatively large numbers of
deleterious mutations. one would expect less skew due to deleterious
muta-tions. Such a control would be crucial to allow for epista-If we assume that deleterious mutations are normally
distributed in the progeny (Charlesworth1990;Bar- sis between favorable alleles, a point that we shall return to in the discussion.
ton1995;CharlesworthandBarton1996), then by
taking moments over Equation 1, the skew in offspring Another possible problem with this method is that, when measuring fitness, there may be skew in the error. log fitness (g1) simplifies to
This could arise environmentally or through the method by which fitness is estimated. The crucial point here is that such a source of variation generates a third moment
g15
2
1
M3pb38 1
3M2
pb(a 1Mpb)2
4
2
1
M2pb2
8 1
Mp(a 1Mpb)2
2
2
3/2 . (5)
which would increase with the variance. In order for this to have no effect on the predicted skew it would require the extremely restrictive assumption that this The numerator represents the third central moment of third moment scale with the variance3/2.
log fitness, while the denominator is the cube of its standard deviation. Example relationships for different
DISCUSSION values ofa andbare given in Figure 4, and illustrate
three important points. First, as expected, synergistic de Visseret al. (1996, 1997a) suggested three meth-epistasis leads to a negative skew, and antagonistic epis- ods to test for epistasis between deleterious mutations tasis to a positive skew. Second, the predicted values of in haploid species: (1) crossing two individuals with skew are very small for realistic parameter estimates, similar numbers of deleterious mutations and compar-and would be very hard to detect experimentally. For ing the mean log fitness of the two parent lines with large samples (n.150) the standard error of the skew their offspring; (2) crossing two individuals with very statistic is≈
√
6/n (SokalandRohlf1981), and so the different numbers of deleterious mutations and com-minimum sample size required to detect a certain paring the mean log fitness of the two parent lines amount of skew, assuming no error variance in the fit- with their offspring, and (3) examining whether the ness estimates, will be≈24/g12, which will be very large distribution of log fitness amongst sexually produced for the values of skew predicted here. For example, offspring is symmetrical or skewed. Our results suggests the minimum sample sizes required to detect the skew that method 2 (crossing two individuals with very differ-predicted by the estimates from D. melanogaster (a 5 ent numbers of deleterious mutations) is by far the best 0.002,b 50.0008) are several hundred for most mean method, and the only one likely to give clear results. numbers of deleterious mutations in the parents. Repli- There are several problems with the other two meth-cating such experiments could be extremely hard. ods. Method 1 (crossing two individuals with similar Finally, the shape of the relationship between pre- numbers of deleterious mutations) is unsuitable be-dicted skew and mean number of deleterious mutations cause: (i) the number of the deleterious mutations in depends upon the values ofaandb. Equation 5 predicts the two parents need only differ by a small amount to a domed or inverse domed shape, reaching a maxi- give a difference in mean log fitness between parents mum/minimum when]g1/dMp50, which occurs when and their offspring equal to zero or in the opposite Mp5 a/b(synergistic epistasis;b .0) or when Mp5 direction to that predicted with exactly equal numbers2a/b(antagonistic epistasis; b ,0). With synergistic of deleterious mutations, (ii) even when the two parents epistasis, the maximum predicted skew is 2(a3/8 1
have exactly the same number of deleterious mutations, 3a4/b)/(a2/8 12a3/b)3/2, which increases withb and
Figure 4.—The relationship between predicted skew and mean number of deleterious mutations in the parents Mp. (A) Synergistic epistasis (a 50.002,b 5variable). (B) Synergistic epistasis (a 50.014,b 5variable). (C) Synergistic epistasis (a 5 variable,b 50.0008). (D) Antagonistic epistasis (a 50.02,b 5variable).
sample sizes required to detect skew in a cross between ing individuals with different numbers of deleterious mutations), where large differences in mean log fitness two lines means that it would be hard to replicate with
crosses between different parents, and (iv) it does not are predicted.
The methods that examine mean log fitness (methods allow for skew in the error.
The problems for methods 1 and 3 would be in- 1 and 2) require assumptions to be made about the num-ber of deleterious mutations in different individuals (de creased by experimental measurement (replication)
er-ror, which our theoretical predictions do not take into Visseret al. 1996, 1997a). The number of deleterious mutations in an individual will never be exactly known, account. The importance of this would depend
enor-mously upon the type of organism used in any experi- and so must be inferred by their relative fitness. This is a problem because the fitness consequences and form ments. If a species is being used where genotypes can
be cloned and replicated to a high degree, then the of epistasis of deleterious mutations differ (Keightley 1994, 1996; Whitlock et al. 1995;Elenaand Lenski problem can be effectively ignored. However, if this is
not possible, then it could make detecting small effects 1997;OttoandFeldman1997). For example, a reduc-tion in fitness of 4% could be caused by one mutareduc-tion much harder. This would increase the problems for
(cross-method that involves crossing individuals with “approxi- ual population bottlenecks, as benign conditions as pos-sible to minimize selection, and asexual reproduction. mately” equal numbers of mutations (method 1).
How-ever, this problem will be reduced in crosses between Mutations should be accumulated in several indepen-dent replicate lines. Mutation accumulation could be individuals with very different fitnesses (method 2),
be-cause the fitness consequences of deleterious mutations speeded up with artificial mutagens. The experimental crosses would come from crossing the mutation accumu-are thought to be generally small (Mukai et al. 1972;
Ohnishi 1977a,b;Crow and Simmons 1983;Keight- lation lines with individuals from the base populations. The control crosses would be to cross individuals from ley1994, 1996;KeightleyandOhnishi1998;Kibota
andLynch1996; but seeKeightleyandCaballero the base populations.
Control crosses are crucial because similar differences 1997). Consequently, large fitness differences between
individuals are likely to represent large numbers of dele- in mean log fitness, or skew, could be predicted by epistasis between beneficial alleles. Indeed, the inability terious mutations. Replicating crosses with different
par-ent lines would reduce the possibilities that mutations to carry out a control is the biggest problem for method 3 (testing for skew in log fitness). Our proposed control of small effects were usually the cause of fitness
de-creases, but that one had unfortunately chosen to cross for method 2 is to cross individuals with similar and low levels of deleterious mutations (a case of method 1). two individuals where the fitness differences were due
to mutations with large effects. Such replication would With regard to epistasis between beneficial alleles, the differences in mean log fitness between parents and also reduce the possibility that variation in the extent
of epistasis occurs, and that one had crossed individuals their offspring in the control crosses should equal that in the experimental crosses. However, epistasis between whose mutations showed particularly large or small
ex-tents of epistasis. deleterious mutations is predicted to lead to much
greater differences in mean log fitness between parents We have used a quadratic function to represent
vari-ous forms of epistasis. One of the advantages of this and their offspring in the experimental crosses (Figure 3) than in the control crosses (Figure 2). Consequently, function is that by varying the parameters it is possible
to consider a wide variety of forms of epistasis: the ratio epistasis between deleterious mutations would lead to the mean difference between mean offspring log fitness
b/ameasures the degree of epistasis (Charlesworth
et al. 1990). Another commonly used function is trunca- and mean parent log fitness differing between the ex-perimental and the control crosses.
tion selection, which is an extreme case of synergistic
epistasis (Kondrashov 1982). With truncation selec- Replication needs to be carried out at the parent level. This is crucial to avoid pseudoreplication (Hurlbert tion, individuals who have less than a certain number
of deleterious mutations (T ) have a fitness of 1.0, and 1984) and subsequent false results that could occur for a number of reasons, such as extreme variation in muta-individuals with T or more mutations have a fitness
of 0. We have not presented results with a truncation tion/epistasis effects (see above), or some particular gene combination that increased or decreased fitness. function because its extreme properties lead to it not
being useful for the purposes of this paper: (1) all indi- Several lines which have acquired deleterious mutations independently, through natural or artificial mutation, viduals have a fitness of 1.0 or 0; log (0) cannot be
calculated, and so it is not possible to work on a log should be used. The data from each of these lines should then either provide a single data point in the analysis, fitness scale; (2) parents must have less than T
deleteri-ous mutations because they are alive and reproducing, or be analyzed by an appropriate nested approach (e.g., Crawley1993, p. 147).
and so the fitness of offspring is always equal to or less
than their parents, and (3) skew is maximized when Another issue that needs consideration is the nature of deleterious mutations present (segregating) in natu-offspring fitness is either very low (lots of 0’s and few
1.0’s) or very high (lots of 1.0’s and few 0’s). ral populations versus the properties of newly arising deleterious mutations. The problem here is that
selec-Experimental design, controls and replication:Our
theoretical results suggest that only method 2 (crossing tion will lead to these two distributions being different. While it is the latter of these two distributions that is two individuals with different numbers of deleterious
mutations) can be used to test for epistasis between crucial to estimate, it is the former that may be more accessible to empirical study. This problem can be re-deleterious mutations. A basic methodology for applying
this to a haploid species would be as follows. Individuals duced if selection is minimized when creating and main-taining lines with high deleterious mutation loads. Re-with relatively low numbers of deleterious mutations
would come from (base) populations maintained in lated to this, it is also worth noting that if one’s aim is to test the importance of deleterious mutations in conditions that had minimized the accumulation of
del-eterious mutations: large population size, plenty of op- maintaining sexual reproduction, it is crucial to work on sexual species: selection may have shaped the distri-portunity for competition and selection, and, if possible,
sexual reproduction. Individuals with relatively large bution of affects in newly arising deleterious mutations differently in sexual and asexual species.
numbers of deleterious mutations would come from
individ-provide clear evidence for or against epistasis between scale of measurement. For example, theory has been developed in terms of discrete generations, where fit-deleterious mutations in C. moewussi. The main problem
is that they used the two methods which we have found ness (w) is the number of offspring in one generation, and the population grows at a rate wt5elog(w)t. However, are unlikely to give clear results. In their first paper (de
Visseret al. 1996), they crossed individuals with similar with overlapping generations, the maximum growth rate is ert. This suggests that r plays the role of log (w),
numbers of deleterious mutations and compared the
mean log fitness of the two parent lines with their off- and not log (r). In contrast, K may be proportional to fitness when there is weak density dependent selection spring (method 1). The main problem with this method
is that the number of the deleterious mutations in the (Charlesworth1980). In addition, it was necessary to remove several data points from the analyses because two parents need only differ by a small amount to give
a difference in mean log fitness between parents and growth was continuing or the logistic model did not fit. This may have biased the results: skew is particularly their offspring equal to zero or in the opposite direction
to that predicted with exactly equal numbers of deleteri- sensitive to outliers.
Applying the methodology to diploids:de Visser et ous mutations. de Visseret al. (1996) only carried out
one cross for each of their different UV irradiation al. (1996, 1997a) initially suggested that these methods
should be applied to haploids, where the problems of treatments (i.e., no replication at the parent level), and
we have no idea how ’similar’ the numbers of deleteri- homozygosity and dominance are avoided. Although easiest to apply in haploids, we believe that this method-ous mutations in the two strains were. This is crucial
because when crossing two lines with ’similar’ numbers ology can also be applied to diploids. One way in which this would be possible would be if all deleterious muta-of mutations, any result can be explained by any form
of epistasis. In addition, the predicted differences in tions were heterozygous. Individuals with all deleterious mutations in the heterozygote state could be achieved mean log fitness with method 2 may be undetectably
small (Figure 2). by crossing two individuals with high mutation loads
that carried different deleterious mutations. This would In their second paper (de Visseret al. 1997a) they
ex-amined whether the distribution of log fitness amongst be likely if the individuals came from completely different populations, and if they had acquired additional deleteri-sexually produced offspring was symmetrical or skewed
(method 3). The most important problem with this ous mutations independently (through natural or artificial mutation). These individuals could then be used as the method is that it is very hard to construct control crosses
where less skew would be expected due to deleterious parents with high mutational loads in method 2. Another way of applying method 2 is possible with facul-mutations. For example, they found greater skew in the
crosses between individuals that were likely to contain tatively sexual diploid species. Consider two individuals, A and B, which would have some heterozygote and some more deleterious mutations, and suggested that this was
indicative of synergistic epistasis. However, our results homozygote deleterious mutations. These individuals should then be maintained asexually (clonal lineages), suggest that, although the extent of skew initially
in-creases with the number of mutations for very small and additional deleterious mutations acquired indepen-dently (through natural or artificial mutation). These numbers of deleterious mutations, it then decreases
(Figure 4, A and B). The number of deleterious muta- new mutations should be in the heterozygote state, and we shall refer to the new individuals with additional tions in a population at equilibrium depends upon the
mutation rate and the extent of any epistasis between mutations as MA and MB. Two types of crosses should then be carried out: (1) the original individuals with deleterious mutations (Crow1970;Kondrashov1982;
Charlesworth1990). This makes it almost impossible each other (A3 B), and (2) each mutated individual with the opposite non-mutated (MA3B; MB3A). The to make a clear a priori prediction about how the skew
should vary between different crosses. Indeed, the pre- difference between mean offspring and mean parent log fitness in the first (A3B) cross would be due to epistasis dicted equilibrium number of mutations in populations
(Charlesworth 1990; Table 1) is generally enough between deleterious mutations, dominance effects, and epistasis between beneficial alleles (i.e., all forms of non-to suggest that reasonable levels of synergistic epistasis
would lead to crosses between individuals with greater additive genetic interactions). The difference between mean offspring and mean parent log fitness in the sec-numbers of deleterious mutations having less skew
(Fig-ure 4, A and B), the opposite direction to that found ond group of crosses (MA3B and MB3A) would be the sum of the difference in the first cross (A3B) and byde Visseret al. The other general problems for this
method also stand. any epistasis due to the new deleterious mutations. So
any difference between the first and second crosses would There may also have been some problems with the
measures of log fitness used in the two papers. The param- indicate epistasis. Both this and the previous method should be replicated with different parents, and inde-eters of the logistic growth model, maximum growth
rate (r) and carrying capacity in batch culture (K ) were pendent acquisition of additional mutations.
de VisserandHoekstra(1998) have recently applied used as the measures of fitness. While these may be
Crawley, M.,1993 GLIM for Ecologists. Blackwell Scientific, Oxford. eral diploid species. They found that fitness-related
Crow, J. F.,1970 Genetic loads and the cost of natural selection, traits in plants showed almost exclusively negative skew- pp. 128–177 in Mathematical Topics in Population Genetics, edited ness, while those in fungal species did not. In addition, byK. Kojima. Springer-Verlag, Berlin.
Crow, J. F.,andM. J. Simmons,1983 The mutation load in Drosoph-they argued that dominance and error variance were
ila, pp. 1–35 in The Genetics and Biology of Drosophila, edited byM. unlikely to be responsible for the skew observed with Ashburner, H. L. CarlsonandJ. N. Thompson. Academic Press, plant species. However, as they (de VisserandHoeks- London.
de Visser, J. A. G. M.,andR. F. Hoekstra,1998 Synergistic epistasis tra1998) pointed out, their data cannot distinguish
between loci affecting fitness: evidence in plants and fungi. Genet.
between synergistic epistasis between deleterious muta- Res. (in press).
tions and antagonistic epistasis between beneficial al- de Visser, J. A. G. M., R. F. HoekstraandH. van den Ende,1996
The effect of sex and deleterious mutations on fitness in
Chlamydo-leles. This result emphasises how control crosses cannot
monas. Proc. R. Soc. Lond. Ser B 263: 193–200.
be carried out with method 3 that would allow epistasis de Visser, J. A. G. M., R. F. HoekstraandH. van den Ende,1997a between deleterious mutations to be unambiguously An experimental test for synergistic epistasis and its application
in Chlamydomonas. Genetics 145: 815–819.
demonstrated. In addition, the observed skews were very
de Visser, J. A. G. M., R. F. HoekstraandH. van den Ende,1997b large (up to236.7), and cannot be predicted by syner- Test of interaction between genetic markers that affect fitness in gistic epistasis between deleterious mutations. Aspergillus Niger. Evolution 51: 1499–1505.
Dudash, M. R.,1990 Relative fitness of selfed and outcrossed prog-To conclude, despite their considerable importance,
eny in a self-compatible, protandrous species, Sabatia Angularis
empirical data testing for epistasis between deleterious L. (Gentianaceae): a comparison in three environments. Evolu-mutations are severely lacking. We have shown that one tion 44: 1129–1139.
Elena, S. F.,andR. E. Lenski,1997 Test of synergistic interactions of the three possible methods proposed byde Visser
among deleterious mutations in bacteria. Nature 390: 395–398. et al. (1996, 1997a) should provide a relatively simple Hurlbert, S. H.,1984 Pseudoreplication and the design of ecologi-way to collect such data in both haploid and diploid cal field experiments. Ecol. Monogr. 54: 187–211.
Keightley, P. D., 1994 The distribution of mutation effects on species. Experiments using these methods, therefore,
viability in Drosophila. Genetics 138: 1315–1322.
have the opportunity to provide valuable data for several Keightley, P. D.,1996 Nature of deleterious mutation load in Dro-areas in population genetics and evolutionary biology. sophila. Genetics 144: 1993–1999.
Keightley, P. D.,andA. Caballero,1997 Genomic mutation rates Other possible methods include testing for a non-linear
for lifetime reproductive output and lifespan in Caenorhabditis
decline of log fitness in mutation accumulation experi- elegans. Proc. Natl. Acad. Sci. USA 94: 3823–3827.
ments (Mukai1969), and examining the fitness conse- Keightley, P. D.,andO. Ohnishi,1998 EMS-induced polygenic
mutation rates for nine quantitative characters in Drosophila
mela-quences of a known number of marker mutation or
nogaster. Genetics 148: 753–766. transposable element insertions (de Visseret al. 1997b;
Kibota, T. T.,andM. Lynch,1996 Estimate of the genomic muta-ElenaandLenski1997). A general point that must be tion rate deleterious to overall fitness in E. coli. Nature 381: 694–696. Kondrashov, A. S.,1982 Selection against harmful mutations in considered for all of these methods is that fitness must
large sexual and asexual populations. Genet. Res. 40: 325–332.
be measured under conditions as realistic as possible Kondrashov, A. S.,1984 Deleterious mutations as an evolutionary (Dudash 1990;Kondrashov andHoule 1994;West factor. I. The advantage of recombination. Genet. Res. 44: 199–218. Kondrashov, A. S.,1993 Classification of hypotheses on the
advan-et al. 1996).
tage of amphimixis. J. Hered. 84: 372–387.
We thank Brian Charlesworth, Andrew Clark, Laurence Kondrashov, A. S., andD. Houle, 1994 Genotype-environment
Hurst, Peter Keightley, Alexey Kondrashov, Curt Lively, Mar- interactions and the estimation of the genomic mutation rate in Drosophila melanogaster. Proc. R. Soc. Lond. Ser B 258: 221–227. garet Mackinnon, Katrina Lythgoe, Sally Otto, Andrew Read
Mukai, T.,1969 The genetic structure of natural populations of
andArjan de Visserfor useful discussion and comments on the
D. melanogaster. VIII. Synergistic interactions of spontaneous
mu-manuscript. This work was supported by the Biotechnology and
Bio-tant polygenes controlling viability. Genetics 61: 749–761. logical Sciences Research Council.
Mukai, T., S. I. Chigusa, L. E. MettlerandJ. F. Crow,1972
Muta-tion rate and dominance of genes affecting viability in Drosophila
melanogaster. Genetics 72: 335–355.
Ohnishi, O.,1977a Spontaneous and ethyl methanesulfonate-induced LITERATURE CITED mutations controlling viability in Drosophila melanogaster. II. Ho-mozygous effect of polygenic mutations. Genetics 87: 529–545.
Barton, N. H.,1995 A general model for the evolution of recombi- Ohnishi, O.,1977b Spontaneous and ethyl methanesulfonate-induced
nation. Genet. Res. 65: 123–144. mutations controlling viability in Drosophila melanogaster. III.
Het-Burt, A.,1995 The evolution of fitness. Evolution 49: 1–8. erozygous effect of polygenic mutations. Genetics 87: 547–556. Charlesworth, B.,1980 Evolution in Age-Structured Populations. Cam- Otto, S. P.,andM. W. Feldman,1997 Deleterious mutations,
vari-bridge University Press, Camvari-bridge, London. able epistatic interactions, and the evolution of recombination.
Charlesworth, B.,1990 Mutation-selection balance and the evolu- Theor. Popul. Biol. 51: 134–147.
tionary advantage of sex and recombination. Genet. Res. 55: Sokal, R. R.,andF. J. Rohlf,1981 Biometry. W. H. Freeman, New
199–221. York.
Charlesworth, B.1998 The effect of synergistic epistasis on the West, S. A., K. E. FlanaganandH. C. J. Godfray,1996 The
rela-inbreeding load. Genet. Res. (in press). tionship between parasitoid size and fitness in the field, a study
Charlesworth, B.,andN. H. Barton,1996 Recombination load of Achrysocharoides zwoelferi (Hymenoptera, Eulophidae). J.
associated with selection for increased recombination. Genet. Anim. Ecol. 65: 631–639.
Res. 77: 27–41. Whitlock, M., P. Philips, F. B. G. MooreandS. J. Tonsor,1995
Mul-Charlesworth, B.,D. CharlesworthandT. M. Morgan, 1990 tiple fitness peaks and epistasis. Annu. Rev. Ecol. Syst. 26: 601–629.
Genetic loads and estimates of mutation rates in highly inbred