ABSTRACT
GURARSLAN, ALPER. Single-Component Nylon-6 Composites. (Under the direction of Alan E. Tonelli.)
Polymer composites usually fail at weak interfaces resulting from their chemical incompatibility. The ideal solution to the interface problem would be to make the reinforcing elements from the same polymer as the matrix, called “self-reinforced composites”. When producing self-reinforced composite the constituent polymer chains in the fibers must be organized in a way that prevents their complete or even substantial diffusion into the matrix polymer during melt-processing into a single-component composite. Such a reorganization of polymer chains may be achievable by coalescing guest polymers from their crystalline inclusion compounds (ICs) formed with the host cyclodextrins (CDs). Coalesced polymers have recently been observed to be largely extended and unentangled, to crystallize at higher temperatures than their normal entangled melts, and to remain this way even after being held in the melt for considerable periods of time (hours). The same conditions are valid for the films made with the addition of 2wt % of coalesced polymer. Thus, when nucleated polymers are used as the reinforcement fibers and as received polymer is used as the matrix, substantial diffusion of polymer chains from the fiber/matrix into the matrix/fiber is expected to be extremely slow, and should not occur during the times required for composite processing. Furthermore, upon cooling from the melt nucleated film will crystallize before the matrix, and should, for the most part, retain their structural/morphological/ positional integrity and increase the mechanical properties of the composite. Because both components melt during fabrication, at least partially
Single-Component Nylon-6 Composites
by Alper Gurarslan
A thesis submitted to the Graduate Faculty of North Carolina State University
in partial fulfillment of the requirements for the Degree of
Master of Science
Textile Chemistry
Raleigh, North Carolina 2011
APPROVED BY:
_______________________________ ______________________________ Dr. Xiangwu Zhang Dr. Michael Dickey
Member of Advisory Committee Member of Advisory Committee
_______________________________ Dr. Alan E. Tonelli
DEDICATION
BIOGRAPHY
ACKNOWLEDGEMENTS
First and foremost, I would like to thank The Turkish Republic Ministry of National Education for covering my expenses during my language study and master’s degree.
I would like to sincerely thank my advisor, Dr. Alan E. Tonelli, for all his guidance and help. The best decision I have ever made was to pursue my graduate research with him.
I would like to thank my committee members Dr. Xiangwu Zhang and Dr. Michael Dickey for their time.
I would like to acknowledge Birgit Andersen, Judy Elson, and Teresa White for teaching me how to use various instruments.
I would like to thank all of my friends who helped me during my research, especially, Abhay Joijode, Huseyin Avci, Ilkay Ozsev Yuksek, and Hicran Koc.
Finally I would like to thank my loving wife, Rana Gurarslan. Without her I couldn’t have done any success.
TABLE OF CONTENTS
Introduction ... 1
Chapter 1. Introduction to Cyclodextrin and Cyclodextrin Inclusion Compounds ... 3
1.1. Introduction ... 3
1.2. Properties of Cyclodextrins ... 4
General Properties ... 4
Crystalline Structures ... 7
1.3.Cyclodextrin Inclusion Complexes ... 9
Reference... 13
Chapter 2. An Introduction to Self‐Reinforced Composites ... 16
2.1 Literature Review ... 16
Reference ... 23
Chapter 3. Producing Single‐Component Polymer Composite by Using Coalesced Polymers ... 25
3.1. Introducing a new method to produce single‐component polymer composites ... 25
3.2. Experimental ... 28
3.2.1. Materials ... 28
3.2.2. Methods ... 28
3.2.2.1. Inclusion Complex Formation ... 28
3.2.2.3. Nucleation Process ... 29
3.2.2.4. Film Production ... 29
3.2.3. Experimental Techniques ... 30
3.2.3.1. Fourier Transform Infrared Spectroscopy ... 30
3.2.3.2. Differential Scanning Calorimeter ... 30
3.2.3.3. Wide Angle X‐Ray Diffraction ... 31
3.2.3.4. Tensile Test ... 31
3.2.3.5. Density Measurements ... 33
3.2.3.6. Scanning Electron Microscope ... 33
3.2.3.7. Polarized Optical Microscope ... 34
3.3. Results and Discussion ... 34
3.3.1. Characterization of the Nylon‐6‐α‐Cyclodextrin Inclusion Complex ... 34
3.3.2. Coalescence and Characterization of Nylon 6 ... 38
3.3.3. Employment of Coalesced Nylon‐6 as a nucleating agent and Its Characterization ... 42
3.3.4. Single Layer as‐r N‐6 and nuc N‐6 films and their characterization ... 44
3.3.5. Characterization of Single‐Component as‐r and nuc N‐6 Composites ... 53
3.3. Conclusions ... 59
Reference ... 61
Chapter 4. Future Work ... 63
4.1. Future Studies ... 63
LIST OF TABLES
Chapter 1. Introduction to Cyclodextrin and Cyclodextrin Inclusion Compounds
Table 1. Basic properties of α‐, β‐, and γ‐cyclodextrin ... 5
Chapter 3. Producing Single‐Component Polymer Composite by Using Coalesced Polymers
Table 1. Nylon‐6 Densities ... 42
Table 2. Tensile test results for single layer as‐r and nuc N‐6 films ... 47
Table 3. Crystallinity values of as‐r, nuc, and annealed N‐6 single layer films ... 51
LIST OF FIGURES
Chapter 1. Introduction to Cyclodextrin and Cyclodextrin Inclusion Compounds
Figure 1. Number of cyclodextrin publications over the past 120 years ... 3
Figure 2. Chemical structure and numbering of α‐, β‐, and γ‐cyclodextrin ... 5
Figure 3. Location of the hydrophobic and hydrophilic interactions for cyclodextrin ... 6
Figure 4. Glucopyranose unit ... 7
Figure 5. The Herringbone (A) and Layer (B) cage structures, and head to head:tail to tail (C) and head to head‐tail to head:tail to tail (D) Channel crystal structures ... 8
Figure 6. X‐Ray diffraction for as received α‐CD and Nylon‐6 α‐CD IC ... 9
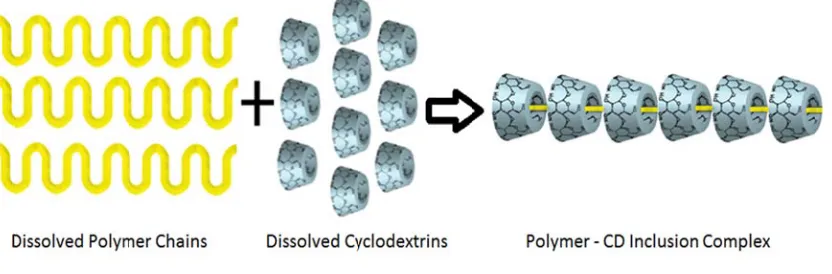
Figure 7. Schematic representation of polymer cyclodextrin complex formation ... 10
Figure 8. Schematic representation of non‐stoichiometric polymer‐cyclodextrin IC formation ... 11
Figure 9. Schematic representation of the coalescence process ... 12
Chapter 2. An Introduction to Self‐Reinforced Composites Figure 1. Diagram of preparing single polymer composite by the partial melting method ... 20
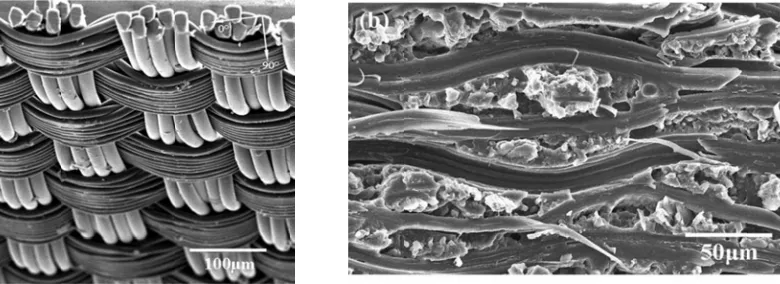
Figure 2. Plain N‐6 cloth and cross‐section morphology of plain N‐6 cloth partially melted at 226 °C. ... 21
Chapter 3. Producing Single‐Component Polymer Composite by Using Coalesced Polymers Figure 1. Flow diagram of this study ... 27
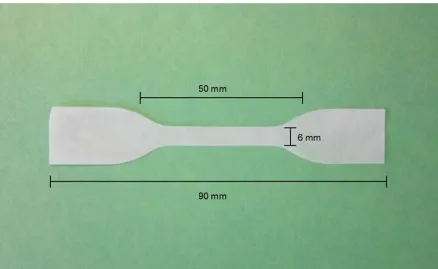
Figure 2. Picture of a dumbbell specimen for tensile test ... 32
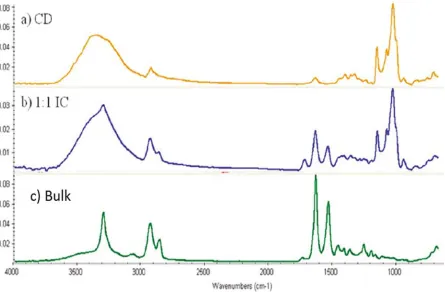
Figure 3. FTIR scans for α‐CD, 1:1 N‐6 α‐CD‐IC, and bulk N‐6 ... 35
Figure 4. DSC heating scans for as‐r N‐6, 1:1 N‐6 α‐CD‐IC ... 36
Figure 5. WAXD of cage crystalline structure of pure α‐CD and columnar crystalline structure of N‐6‐ α‐CD‐IC ... 37
Figure 6. FTIR scans of α‐CD, 1:1 N‐6 of α‐CD IC, as‐r N‐6, and coalesced N‐6 ... 38
Figure 7. DSC heating and cooling scans for coalesced N‐6 ... 40
Figure 9: WAXD scans for as‐r and coalesced N‐6 ... 41
Figure 10. DSC scans of N‐6 and nuc N‐6 ... 43
Figure 11. Polarized Optical Microscope images for melt crystallized films of neat N‐6 and nuc N‐6 44 Figure 12. DSC of single layer as‐r N‐6 film and single layer nuc N‐6 film ... 45
Figure 13. Response of single layer as‐r (upper) and nuc (lower) N‐6 films to applied load ... 46
Figure 14. Load‐strain curves of single layer as‐r N‐6 and nuc N‐6 ... 49
Figure 15. Energy associated with increments of strain ... 50
Figure 16. Stress‐strain responses of thin melt‐pressed neat bulk N‐6 films (as‐received and annealed), and N‐6 film nucleated with N‐6 coalesced from its 1:1 stoichiometric α‐CD‐IC ... 52
Figure 17. Schematic representation of two layer as‐r N‐6 sandwich, and Single ‐ Component as‐r N‐ 6/nuc N‐6 Composite ... 53
Figure 18. DSC cooling scans from the melts of (I) as‐received , (II) nucleated, and (III) asr/nuc sandwich films ... 55
Figure 19. Tensile tests results for asr/asr and asr/nuc N‐6 sandwich films ... 57
Figure 20. Response of asr/asr (left) and asr/nuc (right) N‐6 sandwich film to applied load ... 58
Figure 21. SEM images of the cross section of single‐component as‐r/nul‐N‐6 composite ... 59
INTRODUCTION
There is strong correlation between the properties of polymer materials and their solid state morphologies. It is possible to obtain desired properties by manipulating a polymer’s
morphology, which is possible by controlling its processing. In this study, we are processing polymers with cyclodextrin at the industrial macromolecular level and obtain distinct and improved properties in comparison to bulk polymers processed from their solutions and melts.
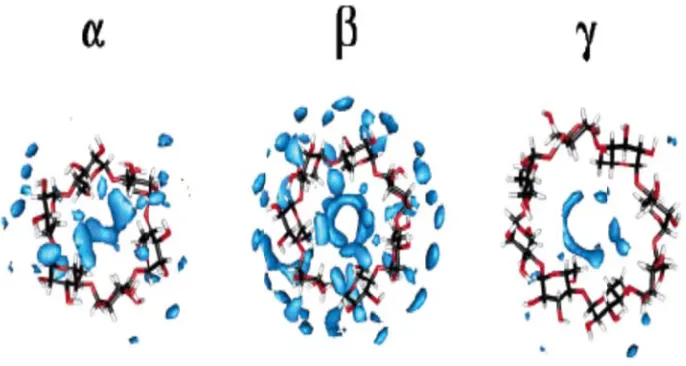
Cyclodextrins are cyclic starch molecules composed of α-1,4-linked glucose units. Most widely used are alpha, beta, and gamma cyclodextrins which have 6, 7, and 8 glucose units,
respectively. These cyclically attached glucose units form a hydrophobic internal cavity and a hydrophilic outer surface. Depending on their cavity size, it is possible to include a variety of molecules and polymer chains inside their cavities and form non-covalently bonded inclusion compounds (ICs), and are widely used in the pharmaceutical industry. The first polymer-cyclodextrin inclusion compound was obtained by Harada and Kamachi using poly(ethylene oxide) oligomers and α-cyclodextrin in 1990. Subsequently, his threading technique was applied on numerous polymers.
After the coalescence process, crystallizable polymers exhibit higher melting, crystallization, and decomposition temperatures, while amorphous polymers exhibit higher glass-transition
temperatures, Tg, than samples obtained from their solutions and melts. Moreover coalesced polymers retain these altered specific properties even after holding them in the melt or above Tg for long times. This means that they will retain their as-coalesced morphologies after normal thermal processing conditions. Furthermore, when these coalesced polymers are used in small amounts, they can successfully nucleate the crystallization of the same as-received polymers, which then show the same enhanced crystallizabilities, because upon cooling from the melt, coalesced polymers crystallize before bulk polymers.
Because of their thermal stability, nucleated polymers do not rapidly mix with as-received polymers. As a result, it is possible to produce a self-reinforced composite by using nucleated polymers as reinforcement and bulk as-received polymers as matrix via melt processing. During melt processing, these two components can partially interpenetrate and interlock with each other, yielding a good adhesion between the interfaces, but without losing their individual
characteristics, and resulting in improved mechanical properties.
Intro
Comp
1.1 In There schem into t Indusoduction
pounds
Introducn 1891 A. V e have been matizes the c three main p strial Produc
Figure 1.
n to Cyc
ction
illears first d numerous re cumulative C arts: Discov ction of Cycl
Number of
CHA
lodextri
discovered c esearches co CD publicati very of their lodextrins.f cyclodextr
APTER
in and C
yclodextrins onducted on c
ions. As seen Structures, C
rin publicati
R 1
Cyclodex
s (CDs) and cyclodextrin n there, stud Chemical an
ions over th
xtrin In
named them ns since 189 dies on CDs c nd Inclusion
he past 120 y
nclusion
m cellulosine 1 and Figure can be divid
Although Villears discovered the cyclodextrins, Schardinger was the first scientist to name these cyclic-oligosaccharides. He also distinguished α- and β-cyclodextrins, relying on the color of an iodine complexation [3].
In the 1930’s Freudenberg and Jacobi discovered γ cyclodextrin and they showed that these cyclic starch molecules are compose of α-1,4-linked glucose units [4]. Until the 1970’s structural, chemical, and physiochemical characteristics of cyclodextrins were studied
extensively by Cramer [5], and after the 1970’s, industrial production of cyclodextrins increased dramatically because they started to be used in various applications.
In the last decade, cyclodextrins were employed mostly in pharmaceutical applications. CD complexation of drug molecules allows release of drugs in a controlled fashion through control of the solubility of drug molecules [6]. Cyclodextrins provide new production and processing techniques. More interestingly, they can be used as an effective tool to improve our knowledge of polymer physics [7].
1.2 PropertiesofCyclodextrins
1.2.1 GeneralProperties
shows th 1. F Table 1: Numb Mo Solubi O C Ca *Values v
e cyclic stru
Figure 2. Ch n= Basic prop
Proper
ber of glucop olecular weig ility(% w/v in Outer diamet Cavity diamet Cavity dep avity volume ary slightly de
ucture of cyc
hemical stru =2 for β, and perties of α-,
rty
yranose unit ght (g/mol)
n water, 25 °C ter (Å)
ter (Å)
pth (Å)
e (ų)
epending on
lodextrins, a
ucture and n d n=3 for γ) , β-, and γ-c
s
C)
source
and some of
numbering o [8].
cyclodextrin
α‐CD
6
972
14.5
14.6
4.7‐5.3
7.9
174
their basic p
of α-, β-, an
n [8]. β‐C 7 11 1.8 15 6.0‐ 7. 26 properties ar d γ-cyclode CD 7 35 85 5.4
‐6.5 7 .9
62
re listed in T
xtrin (n=1 f
γ‐CD
8
1297
23.2
17.5
7.5‐8.3
7.9
427
Table
T and the h cylindric this conic on their n cyclodex oxygen b cavity an lipohilic Figure 3 T compatib solubility
The most imp hydrophilic h al molecules c shape, bec narrow rim, xtrins [9]. Th bridges that c nd a hydroph
properties, p
. Location o
The hydrophi ble solvents, y in water th
portant struc hydroxyl gro s, but to som ause they hin while all the he aliphatic r connect the g hilic outer su
place cyclod
of the hydro
ilic outer sur such as wat an α- and
γ-tural charact oups on the o me extent are
nder bond ro e secondary h ring hydroge
glucopyrans urface, as dep dextrins in a
ophobic and
rface of cycl ter and DMS CD’s. [10].
teristics of c outer surface e truncated c
otation. All t hydroxyl gro en atoms are
e rings [8]. T picted in Fig
special posit
d hydrophili
odextrins m SO. As seen i
According t
cyclodextrins e. Cyclodext
ones. Their the primary oups are loc directed inw This conform gure 3. Havin
tion as drug
ic interactio
makes them so in Table 1, β to molecular
s are their cy trins are not
glucopranos hydroxyl gro ated on the w wards, as are mation creat ng both hydr
delivery sys
ons for cyclo
oluble in hyd β-CD has mu
r dynamic co
ylindrical sh exactly se units caus
simulatio cavity, as β-cyclod water mo entropy, 1.2.2 Cyclo classes. O cyclodex the caviti ons, β-cyclod s seen in Fig
extrin and cr olecules and which yield
Figure 4. M
Cryst
odextrins ma One class is xtrins or their
ies of cyclod
dextrin has h gure 4. These reates a mor
a relatively s much lowe
Molecular D
talline Struc
ay adopt fou cage crystal r ICs contain dextrins are p
highly dense e surroundin re rigid cycli rigid assemb er water solu
Dynamic com around the
ctures
ur kinds of cr line structur ning small gu parallel to ea
local water ng water mol ic structure t bly of β cycl ubility for
β-mputer simu cyclodextri
rystalline str res, which ar uests. The se ach other. In
structure bo lecules, decr than α- and γ
lodextrin de -cyclodextrin ulation dep ins. [10] ructures, whi re generally
econd type i n order to hav
oth inside an reases the int γ-cyclodextr
creases the c n.
icts local wa
ich can be pl formed by p is columnar ve such a co
nd outside its ternal motio rins. Surroun configuration
ater molecu
there usu cavities. The c diffractio Nylon-6 structure cavities. Figu tail
ually must be Figure 5 dep
crystalline st on (WAXD) can be seen
from cage t
ure 5. The H (C) and hea
e some long picts the cag
tructures of c . The WAXD
in Figure 6. o columnar
Herringbone ad to head-t
guest, like p ge and colum
cyclodextrin D pattern for
From this fi form when w
e (A) and L tail to
head-polymeric ch mnar crystalli
ns can be diff r as received figure it is cle
we include s
ayer (B) cag -tail to tail (
hains, includ ine structure
fferentiated b d α-CD and i ear that CDs some guest p
ge structure (D) Channe
ded inside the es.
by wide angl its inclusion s shift their c polymer chai
es, and head el crystal str
e cyclodextr
le X-ray n complex wi
crystalline ins inside th
Fig
1.3. Cycl
As ex cavities. of cyclod are no co together. [16-19] c
gure 6. X-R
lodextrin In
xplained prev When cyclo dextrin and f ovalent bond Ions[12], s can be comp
Ray diffracti
nclusion Com
viously, cyc odextrins con form a new c ds between th small molecu lexed inside
on for (a) a
mplexes
clodextrins h ntact hydroph complex mat he guest mol ules[13], mo e cyclodextri
s received α
have hydroph hobic molec terial, called lecule and th onomers[14
n cavities.
α-CD and (b
hilic outer su cules, they pr d an inclusion
he host cyclo ], dyes [15],
b) Nylon-6-
urfaces and h refer to stay n complex. A odextrin cavi
, oligomers,
α-CD IC [1
Harad (ehylene conducte schemati F F and its m Figure 7
da and Kam glycol) (PE ed extensive zes complex
Figure 7. Sc
ormation of molecular we
was modele
1. Di
2. Th
3. M
4. De
5. Pr
achi first rep G)[20] in 19 studies on p x formation b
chematic rep
f polymer-cy ight, solvent ed by Baglion
iffusion of p
hreading of p
Movement of
e-threading o
recipitation o
ported inclus 990, and the polymer-cycl between gue
presentation
yclodextrin IC t and temper ni et al to oc
polymer chai
polymer cha
CD molecul
of CD molec
of the final a
sion complex reafter, Hara lodextrin inc est polymer c
n of polyme
Cs depends o rature [21]. T ccur in five m
ins and CD m
ain ends into
les through t
cules off of t
aggregate
xes formed b ada et al and clusion comp
chains and c
er cyclodext
on the type o The inclusio main steps [2
molecules
the CD cav
the polymer
the polymer
between CD d Tonelli et a pounds. Figu cyclodextrins
trin complex
of cyclodext n process re 22].
ities
chains
r chains
Ds and poly al [21] have
ure 7 s.
x formation
trin, the poly epresented in
n
M stoichiom of cyclod occurs. F Fig There host cycl arrangem entangled numerou
Mohan (in he metric inclus dextrin is not Formation of
gure 8. Sche
e is an intere lodextrin. Th ment of chain d solutions o us times in st
er PhD thesis sion compou
t enough to c f non-stoichi
ematic repre
esting proces he guest poly ns distinct fro or melts (See
udies of Ton
s) and others unds by using
cover the en iometric Poly
esentation o
ss called coa ymer chains om that norm e Figure 9). T nelli et al [7]
s before her g excess poly ntire guest po
ymer-CD-IC of non-stoich alescence, wh coalesce to mally produc This expecta ]. showed that ymer [23]. I olymer chain C can be seen
hiometric P
hich occurs form a bulk ced from the ation has ind
t it is possibl In this case, s ns, only parti n in Figure 8
Polymer-CD
after careful solid sampl eir randomly deed been co
le to make n since the am ial coverage 8.
D IC formati
Co distinct p crystalliz higher m amorpho consolida of two or coalescen be contro importan Fig oalesced poly properties. In zable polym melting (Tm), us homopoly ated from th r more polym nce from the olled (either ntly, iv.) the t
gure 9. Sche
ymers, as de n fact, observ mers evidence crystalliziat ymers exhib eir disordere mers that are eir common suppressed o thermal and
ematic repre
epicted in Fig vations show e increased l
ion, and dec bit higher gla ed solutions e normally be
CD-ICs, iii.) or enhanced
temporal sta
esentation o
gure 9, have w that upon c levels of cry composition ass-transition
and melts; i elieved imm ) the phase s d) in coalesce
abilities of th
of the coales
a new organ coalescence ystallinity, un
temperature n temperatur ii.) molecula miscible can b
segregation o ed block cop he organizat
scence proce
nization, wh from their C nusual polym es, while coa
res (Tg) than arly mixed, i be obtained of incompati polymers, an tion of coale
ess.
hich may lead CD-ICs; i.) morphs, and alesced n samples intimate blen upon
homopolymers, well-mixed homopolymer blends, and block copolymers are substantial, thereby suggesting retention of their as-coalesced structures and morphologies under normal thermal processing conditions. Observation iv.) has recently been suggested to be the result of the long times necessary for the many chains influenced by a single coalesced polymer chain, after it is randomly-coiled, to establish a fully entangled melt [24].
REFERENCES
1. Villiers A. On the fermentation of starch by the action of the ferment butyric, Comptes Rendus de l’Acad´emie des, Vol. 112, pp. 536-538. 1891.
2. Szejtli, J. Chem. Rev. 98, 1743-1754. 1998.
3. Schardinger F, Zentalblatt B. 2, 29, 188. 1911.
4. Freudenberg K, Meyer-Delius M. Ber. Dtsch. Chem. Ges, 2, 71, 1596-1600. 1938.
5. Cramer F. Inclusion Compounds. Berlin : Springer-Verlag, 1954.
6. Uekama K, Hirayama F, Irie T. Cyclodextrin Drug Carrier Systems, Chem. Rev.98
2045-2076. 1998.
7. Tonelli AE. Molecular Processing of Polymers with Cyclodextrins, Adv Polym Sci, 222: 115– 173. 2009.
8. Williamson BR. Processing Polymers with Cyclodextrins. PhD Thesis. North Carolina State University. 2010.
9. El-Nokaly MA, David MP, Charpentier BA. Polymeric Delivery Systems.Washington , DC: American Chemical Society. 1993.
11. Mohan A, Joyner X, Kotek R, Tonelli AE. The Constrained/Directed Crystallization of Nylon-6:ı. Non-stoichiometric Inclusion Compounds formed with Cyclodextrins,
Macromolecules, 42, 8983-8991. 2009.
12. Bajpai M, Gupta P, Bajpai SK. Silver(I) Ions Loaded Cyclodextrin-Grafted-Cotton Fabric with Excellent Antimicrobial Property, Fibers and Polymers,11,1, 8-13. 2009.
13. Rusa CC, Bridges C, Ha S, Tonelli AE. Macromolecules, 38, 5640-5646. 2005.
14. Uyar T, El-Shafei A, Wang X, Hacaloglu J, Tonelli AE. J. Incl. Phenom. Macro, 55, 109-121. 2006.
15. Suzuki M, Tsutsui M, Ohmori H. Carbohyd Res, 261, 223-230. 1990.
16. Rusa C, Rusa M, Peet J, Uyar T, Fox J, Hunt M, Wang X, Balik C, Tonelli AE. J. Incl. Phenom. Macro. 55, 185-192. 2006.
17. Wei M, Tonelli AE. Macromolecules 34, 4061-4065. 2001.
18. Martínez, G, Gómez MA, Villar-Rodil S, Garrido L, Tonelli AE, Balik CM. J. Polym. Sci. Pol. Chem. 45, 2503-2513. 2007.
19. Rusa CC, Shuai X, Shin ID, Bullions TA, Wei M, Porbeni FE, Lu J, Huang L, Fox J, Tonelli AE. J. Polym. Environ. 12, 157-163. 2004.
21. Rusa CC, Rusa M, Peet J, Uyar T, Fox J, Hunt MA, Wang X, Balik CM, Tonelli AE, The Nano-threading of Polymers, J. Inclus. Phenom. & Macrocyc. Chem., 55,185, 2006.
22. Becheri A, Lo Nostro P, Ninham BW, Baglioni P. J. Phys. Chem. B 107, 3979-3987. 2003.
23. Mohan A. Modification of Nylon 6 Structure via Inclusion. PhD Thesis. North Carolina State University. 2009.
24. Tonelli AE. Organizational Stabilities of Bulk Neat and Well-Mixed, Blended Polymer
Samples Coalesced from Their Crystalline Inclusion Compounds Formed with Cyclodextrins,
CHAPTER 2
An Introduction to Self-Reinforced Composites
2.1. Literature Review
There is no universally accepted definition for a composite material. For some optimistic researchers materials composed of two or more identifiable constituents are composites, and not homogenous or single phase materials. On the other hand, there is another group who think composite materials do not include sandwiches, laminates, felts, etc., but consist only of reinforcing phase structures embedded in a continuous matrix phase. In his book, Lee defines composite materials as “a multiphase material formed from a combination of materials which differ in composition or form, remain bonded together, and retain their identities and properties” [1]. Since this appears to be a comprehensive and judicious definition, we are going to adopt it here.
In many cases, a strong and stiff component is embedded in a softer constituent component forming the matrix [2]. For instance, bone and teeth are both essentially composed of hard inorganic crystals (hydroxyapatite or osteons) in a matrix of tough organic constituents called collagen [3].
Composites are very important engineering materials, because it is possible to tune the desired properties of final products by manipulating the volume fractions of the matrix and the
reinforcement. Although the volume fraction of reinforcement has profound impact on final properties, interactions at the interfaces between composite components are the defining/limiting feature of composite behavior. If there is poor adhesion between components at their interfaces, composites break when the weaker component breaks. Unfortunately, polymer-polymer
composites usually fail due to the poor adhesion at the interfaces resulting from their chemical incompatibility.
Researchers have been trying to improve adhesion between the fiber and the matrix in different ways. Grafting of polymer chains has been proposed as a means to improve adhesion. For instance, Mobarakeh et. al. covalently grafted Nylon 6,6 onto Kevlar fibers to maximize the interface diffusion between the matrix and the dangling polymer chains attached to the Kevlar fiber. They report increase in strength and modulus of composites even at the low fiber
percentage used [4]. When a similar approach was applied on polystyrene-Kevlar composites, polymerization of styrene onto Kevlar fibers led to an increase of up to 38.2% in tensile strength of the composite [4]. These studies show the importance of interfacial adhesion and demonstrate that chemical compatibility is required for a strong interface.
properties which impede their direct bonding. In order to obtain sufficient interfacial strength, coupling agents are generally necessary for glass-reinforced polymer composites [4].
N.J. Capiati and R. S. Porter [5] came up with the idea of single polymer composites, where the constituents of the composite do not have compatibility problems. In one-component
polymer composites, matrix and reinforcement are made from different morphologies of the same polymer [5]. Based on this suggestion, Teishev, Marom, et al. made one-component composites using polyethylenes (PE), with gel-spun ultrahigh MW PE fibers (Tm = 150⁰ C) and
high density PE matrix (Tm = 130⁰ C) [6-8]. However, the mechanical properties of the
UHMWPE/HDPE composites were not found to be superior to two-component composites made with UHMWPE fibers and chemically dissimilar matrix polymers. In addition, single component composites might potentially be fabricated using reinforcement fibers made from
stereo-complexed polymers, such as poly (L- and D-lactic acids) (PLLA and PDLA) [9], or isotactic (i) and syndiotactic (s) poly(methyl methacrylates) (PMMA) [10], which have Tms above either of their pure stereoisomeric crystalline polymers or the Tgs of their stereoirregular amorphous polymers. However, while stereo-complexed PLLA/PDLA fibers can be melt spun [11], i- and s-PMMAs cannot, but instead have recently been electrospun from solution [10]. Furthermore, these stereo-complexed fibers are not likely to be fully compatible with matrices made with their stereoirregular amorphous or stereoregular semi-crystalline counterparts.
similar m softening fibers. A not very immobile A compacti In subseq material. produced Gong and the fibers fibers. Th structure Figure ( matrix polym g temperatur
s a conseque highly interp e as the matr
A second met ion method [ quent proces By using th d with differe
d Yang [14] s melt, wher hese partially
together, as
e 1. Diagram (a) Original f
mers. As such res of the ma
ence, the inte penetrating a rix polymer
thod for prod [12-14]. Her ssing, two di his technique ent polymers
took a N6 fa e there is hig y melted out s schematize
m of prepari fibers
h, their com atrix and belo
erfaces betw and strong, b
is melt-proc
ducing singl re there is on fferent morp e, a variety o
s including P fabric, and pa gher free vol ter fiber surf d in Figure 1
ing single po
(b) Pa
mposites must ow the melti ween them, th
because the r cessed into th
le polymer c nly one starti phologies are of single-com PE, PP, PET artially melt lume and low faces act as g 1.
olymer com [14]. rtially meltin
t be formed ing temperat hough poten reinforcing f hem. composites is ing material, e obtained b mponent poly T, PMMA, N ted it. They s wer crystalli glue and bin
mposite by th ng (c)
at temperatu tures of the r ntially compa fibers remain
s the partial , generally a by partially m
ymer compo N6,6 and N6. state that onl inity than the nd the remain
he partial m
Single Polym
ures above th reinforcing atible, are lik
n solid and
melting/hot a woven fabr melting the in osites were
. For exampl ly the surfac e core of the ning un-melt
melting meth
mer Compos
In regions in theoretic pressing heating, w fibers is r regions, o tensile st is a fabri fabric, as
Figure
T time of c
n this techniq n Figure 1(c ally reinforc or radial win which make retained afte or that melte rength comp c and final p s seen in Fig
2. Plain N-6
The process v ompaction.
que, the mat c)), and the re ces and supp
nding is requ s processing er processing ed parts are t pared to the i product is a f
ure 2.
6 cloth (left partially
variables in t Precisely co
trix of the co emaining un orts the com uired to prev g difficult. A g, there is no totally amorp
initial fabric film, where t
hand side) melted at 2
the partial m ontrolling the omposite are n-melted regi mposite. Duri vent relaxatio Although auth o evidence th phous. Neve c. This is not there are mo
and cross-s 26 ⁰C (righ
melting metho e processing
e the partially ions (circles ing the partia on of high fi hors claim th hat the non-m ertheless, the t unexpected ore contact p
section morp t hand side)
od are the te temperature
y melted por s in Figure 1 ally melting iber orientati hat high orie melted parts ere is still an d, because th points, and is
phology of p ) [14].
emperature, p e is crucial in
rtions (dark (c)) process, lat ion during entation of th
are crystalli n increase in he initial mat s denser than
plain N-6 cl
pressure, and n this metho
the case of N-6, for instance, at 228⁰ C almost all of the structure melts, while partial melting at 226⁰ C yields the highest tensile strength [14].
In conclusion, currently two main methods exist to produce one-component polymer composites. In the first method two chemically identical polymers are required, but their melting point difference prevents the development of a strong interface. In the second method there is no matrix initially, but it forms after partial melting. In the latter case, the reinforcing unit doesn’t have superior properties. Production of single-component polymer composites may be possible by combining the advantages of both techniques. A better technique requires chemically identical matrix and reinforcing components, but with both melting during processing. In addition, the reinforcing component must have mechanical properties superior to the matrix.
REFERENCES
1. Lee SM. Dictionary of composite materials technology. 1989.
2. Hull D, Clyne TW. An Introduction to Composite Materials, 2nd Edition, Cambridge Solid State Series. 2003.
3. Currey, J. D. Biological composites, in Handbook of Composites, vol. 4 – Fabrication of Composites. Kelly A, Mileiko ST (eds.). Elsevier: New York, pp.501-64. 1983.
4. Mobarakeh HS, Kadi AA, Brisson J. Improvement of mechanical properties of composites through polyamide grafting onto Kevlar fibers, Polymer Eng. & Sci. Vol. 36, No. 6. 1996.
5. Capiati NJ, Porter RS. Concept of one polymer composites modeled with high-density polyethylene, J. Mat. Sci., 10, 1671-77. 1975.
6. Teishev A, Incardona S, Migliaresi C, Marom G. Polyethylene fibers/polyethylene matrix composites-Preparation and physical properties, J. Appl. Polym. Sci., 50, 503-12. 1993.
7. Teishev A, Marom G. The effect of transcrystalinity on the transverse mechanical properties of single-polymer polyethylene composites, J. Appl. Polym. Sci., 56, 959-66. 1995.
8. Stern T, Marom G, Wachtel E. Origin, morphology, and crystallography of transcrystallinity in polyethylene-based single-polymer composites, Composites, Part- A, Appl. Sci. Manufactor,
9. Hyon H, Jamshidi K, Ikada Y. In Polymers as Biomaterials; S. W. Shalaby, A. S. Hoffman, B. D.Ratner, T. A. Horbett,, Eds.; Plenum Press: New York, London, 1984; pp 51.
10. Crne M, Park JO, Srinivasarao M. Electrospinning Physical Fels: The Case of Stereo complex PMMA, Macromolecules, 42, 4353-55. 2009.
11. Furuhashi Y, Kimura Y, Yamane H. Higher order Structural Analysis of Stereocomplex Poly(lactic acid) Melt-Spun Fibers, J. Polym. Sci. Part B-Polym. Phys, 45, 218-28. 2007.
12. Hine PJ, Ward IM, Olley RH, Bassett DC. The Hot Compaction of High Modulus Melt-Spun Polyethylene Fibres, Journal of Materials Science, vol.28, pp.316-324. 1993.
13.Ward IM, Hine PJ. Novel composites by hot compaction of fibers, Polymer Engineering & Science, 37: 1809–1814. doi: 10.1002/pen.11830. 1997.
CHAPTER 3
Producing Single-Component Polymer Composite by Using
Coalesced Polymer
3.1 Introducing a new method to produce single-component polymer composites
The importance of the interfacial strength between matrix and reinforcing unit was discussed in the previous chapter. Single polymer composites potentially have better interface
performance than traditional glass or carbon fiber reinforced polymer composites [1].Single– component polymer composites not only eliminate the interface problem, but also simplify recycling of composite materials [1].
The two current methods for producing one-component polymer composites have been discussed. In the first method, there are two chemically identical polymers with different melting points. In this technique one constituent melts while the other constituent doesn’t. This is a disadvantage because strong interfaces cannot be obtained if both components do not melt at the same time. In the second method, partial melting of the structure provides stronger interfaces, because both components melt at the same time. This technique, however, does not initially have separately matrix and reinforcing units. Un-melted parts of the initial material create the
interface compared to the initial material. Our aim is producing a single-component self reinforced polymer composite with both strong reinforcing units and strong interfaces.
This type of self-reinforced composite would be produced by making the reinforcing component from the same polymer as the matrix, but with the constituent polymer chains in the reinforcing unit organized in a way that prevents their substantial diffusion into the matrix polymers during their melt-processing into a single-component composite. Such a reorganization of polymer chains may be achievable by nucleating the melt crystallization of polymers with guest polymers coalesced from their crystalline inclusion compounds (ICs) formed with the host cyclic starches, cyclodextrins (CDs).
As we discussed in Chapter I, coalesced polymers have properties distinct from as-received polymers. They have higher crystallinity and higher crystallization temperatures due to their extended conformations and untangled nature. Moreover, they retain their coalesced structures and morphologies even after spending long times in their melts [2].
propertie we have
In self reinf reinforcin
es, this metho strong interf
n order to an forced comp ng unit. A f
od would be faces but onl
nswer these t osites, wher flow diagram
Figu
e the same as ly modest re
two critical q e as-received m that summa
ure 1. Flow
s the partial m einforcement
questions we d N-6 is the arizes our st
diagram of
melting hot t.
e have chose matrix and n tudy is prese
f this study.
compaction
en to use Ny nucleated (n ented in Figu
.
method, wh
on-6 (N-6) i nuc) N-6 is th ure 1.
here
in our he
First we successfully inserted all guest N-6 chains into host nano-sized (~ 0.5nm) α
-cyclodextrin (α CD) channels, resulting in stoichiometric 1:1 N-6 α CD ICs. Coalesced N-6 was
obtained by removing the host cyclodextrin channels, and were used as nucleating agents by adding a few wt % to as-received (as-r) N-6. In order to compare mechanical properties of as-r N-6 and nuc N-6, thin films were made and tensile tests were conducted. Once we determined that nuc N-6 has better mechanical properties than as-r N-6, we decided to use it as reinforcing unit for our self reinforced composite. Single-component polymer composites were made into a sandwich of the two films, with one layer of as-r 6 and one layer of nuc 6. Note that as-r N-6 and nuc N-N-6 are chemically identical but possess different morphologies.
3.2. Experimental
3.2.1. Materials
N-6 having a molecular weight of 60,000 was obtained from BASF (brand name Ultramid B4001®). All solvents were obtained from Sigma-Aldrich, α-cyclodextrin was obtained from Cerestar Co, and Film Made of Teflon®PTFE was obtained from McMaster-Carr.
3.2.2. Methods
3.2.2.1. Inclusion Complex Formation
in 84 mL of 99% dimethyl-sulfoxide. Once α-CD dissolved completely, the α-CD solution was added to the N-6 solution. Their combined solution was stirred and heated on a hot plate at 50 °C for 2 h, then cooled to room temperature, and continuously stirred for another 6 h. The
precipitate was vacuum filtered and rinsed with formic acid and deionized water and finally dried in a vacuum oven for 24 hours.
3.2.2.2. Coalescence Process
The coalescence process to remove the host cyclodextrin channels of 1:1 N-6-α-CD-IC was accomplished by stirring the IC in excess deionized water for 2 h. In this process
coalescence occurs faster if the particle size of precipitated IC is small. After coalescence the N-6 obtained has a different morphology than as-received N-6.
3.2.2.3. Nucleation Process
Nucleated Nylon-6 was obtained by a solvent casting method. After N-6 was dissolved in 90% formic acid, coalesced N-6 was added into the solution. Finally formic acid was removed by evaporation, and the remaining nucleated Nylon-6 was processed into a powder in a blender and dried in a vacuum oven for 24 hours.
3.2.2.4. Film Production
Using these single layer films two types of bilayer sandwich films were produced. First we produced two layers of as-r N-6 by melt pressing 1 g of as-received film onto 1 g of as-received film (2 Layers of as-r N-6). Our second type of bilayer film was produced by melt pressing 1 g of as-received single layer film onto 1 g of nucleated N-6 film (single-component polymer
composite). Bilayer films were melt-pressed under an applied pressure of 2.62 MPa for 1 minute at 240 °C.
3.2.3. Experimental Techniques
3.2.3.1. Fourier Transform Infrared Spectroscopy
Infrared spectral studies were conducted with a Nicolet 510P FTIR spectrometer.
Observations were conducted in the range 4000-400 cm-1, with a resolution of 4 cm-1. Powdered
α-CD, N-6, stoichiometric N-6-α-CD-IC, and coalesced N-6 samples were pressed into KBr
pellets for the FTIR absorption measurements [4].64 scans were conducted for all measurements. FTIR data were analyzed by using Omnic software.
3.2.3.2. Differential Scanning Calorimeter
Differential scanning calorimetric (DSC) thermal scans were performed with a Perkin Elmer Diamond DSC-7 instrument. Hermetically sealed aluminum pans were used in all
DSC data were analyzed by using Pyrissoftware. For a combination of heating and cooling curves, approximately 50,000 data points were collected. Melting and crystallization temperatures and enthalpies were calculated automatically by the software from the areas of endothermic and exothermic peaks. The degree of crystallinity was calculated with the formula shown below (Eq. 1):
Degree of crystallinity (%)
°
100
(1)Where ΔHf is the heat of fusion observed for the sample, and ΔHf° is the heat of fusion of 100% crystalline Nylon-6 which is taken as 160 J/g [4].
3.2.3.3. Wide Angle X-Ray Diffraction
Wide Angle X-Ray Diffraction studies were performed with a Siemens type -F X-ray diffractometer equipped with a Ni-filtered CuKα radiation source (λ=1.54Å). The supplied
current and voltage were 30kV and 20mA, respectively, and diffraction intensities were measured every 0.1 o from 2θ=5 to 30o at a rate of (2θ=3o)/minute [4].
3.2.3.4. Tensile Tests
as-r N-6 why cros annealed films sho the initia modulus, break, an mechanic occurred results. S
and two laye ss-head spee d N-6 and tw owed a much
l part of the , peak load, nd energy to cal propertie very close t Sample shape
er as-r N-6 f d was 500m o layer as-r/ h lower perce
load-elonga break load, y
break data w es reported w
to the gauche e and dimen
Figure 2. Pi
films had per mm/min for th /nuc N-6 film ent elongatio ation curve w yield load, s were acquire was an averag
e clamps or w sions are dep
icture of a d
rcent strain a hese films. In ms, cross-hea
on at break. where the slo train at peak ed at the end ge of at leas were initiate picted in Fig
dog bone sp
at break valu n the case of ad speed wa
Modulus va ope is consta k load, strain of each test t five film te ed by flaws w gure 2.
pecimen for
ues greater th f single laye as 50mm/min alues were ca ant. The load n at break loa
t, and each v est specimen were not inc
tensile test.
han 100. Thi er nuc N-6,
n, because th alculated fro d- strain curv
ad, elongatio value of the
ns. Breaks th cluded in the
3.2.3.5. Density Measurements
Densities of as-r N-6 and coalesced N-6 were determined by floatation in a mixed solution of carbon tetrachloride (CT) and toluene (T), whose densities are greater (ρCT = 1.594 g/cm3) and less (ρT = 0.8668 g/cm3) than N-6. Small portions of N-6 film were floated atop 25ml of CT in a 100ml graduated cylinder containing a magnetic stir bar that was placed on a
magnetic stir plate. The tip of a 50ml burette containing T was inserted through aluminum foil that covered the mouth of the graduated cylinder. While stirring, T was slowly dripped in (~10 drops/ml) until the N-6 film sank below the surface of and became suspended in the CT/T solution when stirring was stopped. The volume of T, vol(T), required to achieve suspension of the N-6 sample was then used to determine the N-6 film density, ρN-6, from equation 2.
ρN-6 = [vol(T)ρT + 25ρCT]/[vol(T) + 25] (2)
Comparative N-6 film densities were observed for melt-crystallized as-received and coalesced N-6 samples possessing the same crystallinity, as determined by DSC. This was achieved by simultaneously placing a portion of each of the N-6 melt-crystallized films in the graduated cylinder containing CT, and adding T as just described. The film that first began to sink and became suspended in the CT/T column had the highest density, which must be attributed to closer packing of chains in the non-crystalline regions of the sample [5].
3.2.3.6. Scanning Electron Microscope
double sided conductive carbon tape and coated with gold/palladium to reduce charging. A Quorum Technologies SC7620 Mini Sputter Coater was employed for 45 seconds.
3.2.3.7. Polarized Optical Microscope
Polarized optical microscopic observation for various films were performed on a Nikon Eclipse 50i POL Optical Microscope equipped with a CCID-IRIS/RGB color video camera made by Sony Corp.
3.3. Results and Discussion
3.3.1. Characterization of the Nylon 6 α-Cyclodextrin Inclusion Complex
We employed three analytical techniques to confirm that we had produced a
stoichiometric 1:1 N-6-α-CD inclusion complex. These techniques are FTIR, DSC, and X-ray.
conducte can state show as-extended crystallin channels
Figure 3. F
After ed DSC. If D that our pre r N-6 meltin d N-6 chains nity. Moreov up to 300 °C
FTIR scans
confirming t DSC does not cipitate is an ng, because m
arranged ins ver, the N-6 c C, after whic
for α-CD (a
that we have t show an as n IC and not melting requ side the α-C chains inside ch the α-CD
a), 1:1 N-6 α
e both α-CD s-r N-6 melti t a physical m uires crystall
D channels, e the cyclod
channels m
α-CD-IC (b)
D and N-6 in ing peak, as mixture. The line N-6. Sin we do not h dextrin chann melt and deco
), and bulk N
our precipita can be seen e stoichiome nce there are have any pos nels are isola ompose [10].
N-6 (c).
ate, we in Figure 4, etric IC does
only single ssibility for ated by the α
.
, we not
Figure
A also cond possible
were no i character
5. WAXD o
Although FTI ducted. As se
only when g
inclusion, th ristic XRD p
of cage crys
IR and DSC een in Figur guest polyme
hen α-CD wo pattern, as di
stalline stru structure are sufficien e 5, the N-6-er chains are
ould adopt a scussed in C
cture of pur of N-6-α-C nt to confirm -α-CD-IC ha e included in
cage crystal Chapter I.
re α-CD (a) CD-IC.
m IC formati as a columna nside the hos
lline structur
) and colum
ion, X-ray ob ar structure, st α-CD chan re with the c
nar crystall
bservations which is lik nnels. If ther
correspondin line
were kely
re
3.3.2
C by DSC,
Figur
C of coales of remna
. Coalescen
Confirmation X-ray, and d
re 6. FTIR s
Coalesced an sced N-6 sho ant α-CD pre
ce and Cha
n of N-6 coal density tests
scans of α-C
d as-receive ould be the sa esent. As see
racterizatio
lescence was s.
CD(a), 1:1 N
ed polymers ame as as-r N en in the FTI
on of Nylon
s done by FT
N-6 of α-CD (d).
are chemica N-6. More im IR spectra in
6
TIR and its p
D IC (b), as-r
ally identical mportantly, n Figure 6, th
properties w
r N-6 (c), an
l. Therefore, there should here is no
α-ere investiga
nd coalesced
the FTIR sc d not be any
CD in the ated
d N-6
coalesced N-6, because it only shows the same absorption peaks as as-r N-6. In addition, note the superior resolution of the spectrum for coalesced N-6. This results from both its greater
crystallinity and the un-entangled and extended nature of N-6 chains in the non-crystalline sample regions [9].
As we discussed in previous chapters, the coalescence process leads to distinct properties. Figure 7 shows DSC heating and cooling scans of coalesced N-6, while as-r N-6 has a Tc at 167 °C, coalesced N-6 crystallized at 186.5 °C (compare with Figure 10 in next section). In addition, crystallization takes place over a narrower temperature range leading to a more uniform semi-crystalline structure.
Fig
Figure
gure 7. DSC
8. Parallel (
heating and
(γ, left) and
d cooling sc
anti-paralle
cans for coa
el (α, right)
alesced N-6.
T peaks at r polymorp amount o N differ fro than as-r crystallin chains in produces
The X-ray dif room tempe ph show two of γ-phase si
Figure
Not only the c om the as-r N N-6. Since t ne regions ca n the non-cry s closer pack
ffraction pat rature. Whil o peaks at ab gnificantly d
9: WAXD s
crystalline re N-6, because
their crystall an contribute ystalline regi king in non-c
tterns of α- a le the α-poly bout 2θ=10.7 decreases up
scans for as
egions, but a e density mea line density e to this dens ions. Coalesc crystalline re
and γ-polymo ymorph show 7° (Not show pon coalescen
s-r (left) and
also the non-asurements i and chemica sity increase cence yields egions. Dens
orphs have t ws peaks at a wn) and 21.4
nce [4].
d coalesced
-crystalline r indicate that al structure a e which refle s extended an sity values ar
their own tw about 2θ=20 4°. As seen i
(right) N-6
regions of co t coalesced N are the same ects a closer nd oriented c re given belo
wo characteri and 23.7°, t in Figure 9, t
[4].
oalesced N-6 N-6 is denser e, only
non-packing of N chains and ow in Table
Table 1. Nylon-6 Densities [5].
Density of non‐crystalline regions in Nylon‐6 1.084 g/cm3 Density of non‐crystalline regions in Coalesced
Nylon‐6
1.111 g/cm3
3.3.3. Employment of Coalesced Nylon 6 as a nucleating agent and Its Characterization
As mentioned previously, nucleated N-6, not pure coalesced N-6, will be our reinforcing unit. The reason is that only approximately 10% of N-6-α-CD-IC is N-6. It is extremely tedious to produce large amounts of coalesced polymers. However, coalesced polymers can serve as nucleating agents when a few wt % are used[4]. Here we nucleated 2g of as-r N-6 with 0.04g of coalesced N-6. The nucleated N-6 has a larger amount of crystallinity and a higher crystallization temperature (Tc). As seen in Figure 10, as-r N-6 crystallized at 167 °C and nucleated N-6
crystallized at 184 °C. Similar to coalesced N-6, nuc N-6 also crystallizes over a narrower temperature range (Compare to Figure 7), yielding a more uniform semi-crystalline morphology. Material Xc (DSC crystallinity) Density (g/cm3)
Nylon‐6 0.53 1.1559
Nylon‐6 ( coalesced from 1:1 N‐6‐α‐CD‐IC)
Polarized more hom
d Optical Mi mogenously
Fig
icroscope im providing fi
gure 10. DS
mages, in Fig iner scale mo
C scans of N
gure 11, indic orphology th
N-6 (upper)
cate that nuc han as-r N-6
) and nuc N
cleated N-6 c 6.
N-6 (lower).
Figure N-6,
3.3.4
A layered f
DSC resu
11. Polarize and (lower)
. Single Lay
After melt pre films were ob
ults of these
ed Optical M ) nucleated
yer as-r N-6
essing N-6 p btained after
films are sh
Microscope N-6 with 2 w
6 and nuc
N-pellets and nu r 6 minutes u
hown in Figu
images for wt% N-6 co
-6 films and
uc N-6 powd under an app
ure 12. As we
melt crysta oalesced fro
d their char
der between plied pressur
e discussed p
allized films om 1:1 N-6-
acterization
n Teflon® sh re of 1.75 M
previously, n
of (upper) n α-CD-IC [6
n
heets, single Pa at 240 °C
nuc N-6 has neat 6].
C.
larger am layer film has 36 % of as-r N °C after m
F
A mechanic mechanic composit
mount of crys m also has a % crystallinity N-6 film is 18
melt-pressin
Figure 12. D
As we mentio cal propertie cal propertie tes. Mechani
stallinity and larger amou y, while the 83.5 °C. Sim ng.
DSC of singl
oned earlier, es with as-r N es, then they
ical properti
d higher Tc th unt of crystal
nuc N-6 film milarly Tc of n
e layer as-r
the purpose N-6 films. If will be used es of as-r
N-han as-r N-6 llinity and hi m has 52 %. nucleated fil
r N-6 film (a
e of making n f single layer d as the reinf -6 films and
6. As anticip igher Tc than
Tc of as-r N lms also incr
a) and single
nucleated fil r nuc N-6 fil forcement la nuc N-6 film
pated, the nuc n as-r N-6. T N-6 pellets ar
reases to 191
e layer nuc
lms is for co lms have sup ayer in our o
ms were exa
cleated singl The as-r N-6 e 167 °C, bu 1.5 °C from
N-6 film (b)
omparing the perior
ne-compone amined by th le 6 film
ut Tc 184
).
eir
Q-Test. Ten strain cur
Fig load. Yi
nsile tests we rves for sing
gure 13. Res eld load, pe
ere conducte gle layer as-r
sponse of sin eak load, an
ed for each f r N-6 and sin
ngle layer a d break loa P, and
film as discu ngle layer nu
as-r (upper) ad locations B respectiv
ussed in secti uc N-6 film a
and nuc (lo are indicat vely.
ion 3.2.3.4. T are presented
ower) N-6 fi ed in the up
Typical load d in Figure 1
ilms toappl pper curve a
d-13.
A stress-strain curve can be obtained by dividing each load value by the initial cross-sectional area of the sample. However, the cross-cross-sectional areas of the specimens do not remain constant during the experiment, but rather decrease. This is why here we provide load-strain curves rather than stress-strain curves.
Table 2. Tensile test results for single layer as-r and nuc N-6 films.
Single layer film Width (mm) Thickne ss (mm)
Yield load (N) Break Load (N) Break Stress (kgf/c²) Elongat ion at
break (mm) % Strain at break (%) Energy to break (N*mm ) Young’s Modulu s (MPa)
as‐rN6 6 0.14 24.98 54.39 666.52 136 271.9 4833.6 571.01
nucN6 6 0.11 25.06 24.55 367.14 28.7 57.5 625.99 739.4
computer program. As seen in Table 2, single layer nuc N-6 films have a higher modulus of elasticity than single layer as-r N-6 films.
At higher strains, there is no linear proportionality between stress and strain. This
nonlinearity is generally related to irreversible stress-induced plastic flow in the specimen. In the case of semi-crystalline polymers this plastic flow requires dislocation of crystalline block segments. Materials lacking this mobility, due to internal microstructures that block dislocation motion, are usually brittle rather than ductile [8]. Brittle and ductile materials differ in their stress-strain curves. Brittle materials have linear stress-strain curves over their full range of strain without noticeable plastic flow until fracture occurs. On the other hand, ductile materials have linear stress-strain curves until the yield stress and then the plastic deformation of the specimen starts. As seen in Figure 13, as-r N-6 films fracture in a ductile fashion, while nuc N-6 films shows fracture similar to brittle materials. Since nucleated films have a higher amount of crystallinity, they have limited mobility. This is why it’s difficult to identify a plastic region in the load-strain curve of single layer nuc N-6 films.
The yield stress is the stress required to stimulate plastic deformation in the specimen [8]. The yield load is marked with the letter Y in Figure 13. Yield loads (N) of single layer as-r and nuc N-6 films are given in Table 2. Single layer nuc N-6 film has a slightly higher yield load, however, the average sample thickness for the nuc N-6 films is less than as-r N-6 films. This is why the yield stress of single layer nuc N-6 film is much higher than single layer as-r N-6 film.
necking a reaches t creates a simply ex formation loads, wh 2).
all subseque he full gage
stronger mi xplained by n, single lay hile single la
Figure 14
nt deformati length of th crostructure increased or er as-r N-6 f ayer nuc N-6
4. Load-stra
ion takes pla he specimen, whose brea rientation in film has a sig 6 film exhibi
ain curves o
ace in the ne a process ca aking load is
the direction gnificant dif it almost the
of single lay
ck [8]. The n alled drawin
greater than n of the appl fference betw
same yield
yer as-r N-6
neck propag ng. Interestin n the yield lo lied load. As ween its yiel
and break lo
(1) and nuc
gates until it ngly, necking oad. This can s a result of ld and break oads (see Tab
c N-6 (2). g n be
neck
“T that value that we u curve. Th strain cur T as-r N-6 N-6 films elongatio N-6 elon as-r N-6
The total me e is the area used gives th his energy to
rve.
There is a sig and nuc N-6 s presented i on or load, b
gates 136 m film require
Fig
echanical ene under the st he energy to o break data
gnificant diff 6 films, as ev
in Figure 14 ecause it is t mm, while the
s almost 8 ti
gure 15. Ene
ergy per uni tress-strain c break (N*m corresponds
ference betw videnced by . Note that e the area unde e nuc N-6 fil imes more en
ergy associa
t volume con curve up to a mm), which is
s to toughnes
ween the nece the load-stra energy to bre
er the load-e lm elongates nergy to bre
ated with inc
nsumed by t a given value s the area un ss, which is
essary energ ain response eak increases elongation cu s only 28.7 m ak than the n
crements of
the material e of strain [8 nder the load the area und
gies to break es of single l s quadratica urve. The sin mm. This is w
nuc N-6 film
f strain [8].
in straining 8].” The softw d-elongation der the stress
the single la ayer as-r and lly with ngle layer as why single l m (see Table
In addition, Figure 15 schematically depicts the available amount of energy required to break for two equal increments of strain Δε, applied at different levels of existing elongation. In
later elongation, the same amount of stretching requires much more energy to break the material [8]. This also increases the difference between the energy to break values between single layer as-r and nuc N-6 films. Finally it is a fact that ductile materials are generally tougher than brittle materials [8].
Tensile test results in Table 2 indicate that nucleated single layer N-6 films have lower elongation at break and higher Young’s modulus than as-r N-6 films. Single layer nuc N-6 films also have greater yield stress than as-r N-6 films. These are plausible results because nucleated N-6 films have higher crystallinity than as-r N-6 films. It is a fact that crystalline regions act like large cross-links and decreases elongation and increases modulus and strength.
Table 3. Crystallinity values of as-r, nuc, and annealed N-6 single layer films.
Single Layer Film Δ Hm (J/g) % Crystallinity* as‐r N‐6 58.8 36
nuc N‐6
Annealed N‐6
83.4
84
52 52
*%Crystallinity values were calculated by Equation 1.
In mechanic hours and endotherm A tests wer modulus nucleated N-6 and Figure 1 anneale
n order to eli cal propertie d obtained th ms of as-r, n
After obtainin re conducted
and lower % d films can b
even to anne
16. Stress-st ed), and N-6
iminate the e es to use as r
he same amo nuc, and ann
ng the same d for anneale % elongation be used as th ealed as-r
N-train respon 6 film nuclea
effect of cry reinforcing u ount of cryst ealed N-6 an
amount of c d films. As s n at break tha he reinforcing
-6 films.
nses of thin m ated with N
stallinity and unit, we anne
tallinity as th nd their % cr
crystallinities seen in Figu an annealed g unit, becau
melt-presse N-6 coalesced
[5].
d see that if ealed the as-he nuc N-6 f rystallinity v
s for anneale ure 16, nuclea films. These use they hav
ed neat bulk d from its 1
nuc N-6 film r N-6 films a films. The m
values are lis
ed and nuc N ated films ha e results clea ve superior p
k N-6 films ( 1:1 stoichiom
m has superi at 180 °C fo melting
sted in Table
In stoichiom compared crystallin homogen density o 3.3.5 F Thus when use films of n By using reinforcin
n Figure 16 w metric 1:1
α-d to the neat nity as the nu neous and fin of un-entangl
. Character
Figure 17. S
far, we have ed in small a
nucleated N-g nuc N-6 film
ng, single-co
we can see th -CD-IC has a t N-6 films, e ucleated N-6 ner scale sem
led and exten
rization of S
Schematic r Comp e shown that amounts, serv
-6, we found m as the rein omponent po
hat the N-6 a higher mod even after an 6 film. We be mi-crystallin
nded N-6 ch
Single-Comp
epresentatio ponent as-r
t coalesced N ve as an effe d that they ha nforcing unit olymer comp
film nucleat dulus and a g nnealing to a
elieve this to e morpholog hains in the n
ponent as-r
on of two la 6/nuc N-N-6 has prop ective nuclea ave higher m t, and as-r N posites. This
ted with 2 wt greatly reduc achieve a clo o be a conseq gy and possi non-crystalli
and nuc Ny
ayer as-r N--6 Composit perties distin ating agent. W modulus and N-6 film as m s self-reinfor
t% of N-6 co ced elongati osely similar quence of th ibly the incre ine regions [
ylon 6 Comp
-6 sandwich te.
nct from as-r When we m d lower elong matrix, we wi rced N-6 com
oalesced fro ion at break r level of he more
eased packin [4, 5].
posites
h, and Single
r N-6 and can made melt pre
made by melt-pressing nuc N-6 film onto as-r N-6 film. Finally we will compare the properties of our composite with two layers of as-r N-6. A schematic representation of such two layers sandwich films are given in Figure 17.
According to the definition of a composite, which we discussed and adopted in chapter 2, a composite is a “multiphase material formed from a combination of materials which differ in composition or form, remain bonded together, and retain their identities and properties”. From this definition, there are three main characteristics that a composite has to have, and they are,
1-There has to be two distinct materials,
2-These two different materials have to stay together,
3- They should retain their distinct characteristic behaviors.
![Figure 1. Number off cyclodextrrin publicatiions over thhe past 120 yyears [2].](https://thumb-us.123doks.com/thumbv2/123dok_us/1706914.1216769/13.612.140.449.404.642/figure-number-cyclodextrrin-publicatiions-thhe-past-yyears.webp)
![Table 1: Basic propperties of α-,, β-, and γ-ccyclodextrinn [8].](https://thumb-us.123doks.com/thumbv2/123dok_us/1706914.1216769/15.612.64.506.417.641/table-basic-propperties-a-b-g-ccyclodextrinn.webp)
![Figure 3. Location oof the hydroophobic andd hydrophiliic interactioons for cycloodextrin [3]].](https://thumb-us.123doks.com/thumbv2/123dok_us/1706914.1216769/16.612.158.484.336.518/figure-location-oof-hydroophobic-andd-hydrophiliic-interactioons-cycloodextrin.webp)