SOIL-STRUCTURE INTERACTION METHODOLOGY USING SITE
INDEPENDENT INPUT MOTIONS
Thomas Houston1, Michael Costantino2, Greg Mertz2, and Andrew S. Maham2
1 Principal Engineer, Carl J. Costantino and Associates, New York, NY ([email protected])
2 Senior Structural Engineer, Carl J. Costantino and Associates, New York, NY
ABSTRACT
Section 3.7.2 of the Standard Review Plan (U.S. NRC, 2007) identifies a Soil-Structure Interaction (SSI) analysis methodology for safety-related structures, systems and components using site independent motions. Likewise, current draft provisions of the American Society of Civil Engineers Standard 4 (ASCE, 2013) identify the need for introduction of a methodology for performing SSI analyses using site independent motions. In the cases where a site does not have a Probabilistic Seismic Hazard Assessment (PSHA) to rely on, or the PSHA is based on surface attenuation models that do not provide data regarding high strain site soil properties consistent with the probabilistic seismic motions, soil properties for an SSI analysis must be estimated.
In the case of sites using generic broad-banded ground motion spectra for input into a SSI analysis, Section 3.7.2 of the Standard Review Plan (SRP) states that soil properties for use in a SSI analysis can be based on low strain soil properties. This paper evaluates this simplified methodology that is based on low strain soil properties by computing hazard consistent, surface design motions for a range of sites, and performing SSI analyses using the strain compatible soil properties and design motions for a range of structures. A coincident analysis is then performed using the design surface motion as input into a SSI analysis where low strain soil properties are distributed according to Section 3.7.2 of the SRP, when strain compatible properties are not known.
The paper evaluates the effectiveness of the simplified methodology by comparing seismic responses for a range of structures founded on three sites. The conclusions reached based on the results of this analysis are that for uniform sites, the simplified methodology defined in the SRP produces conservative SSI responses relative to the hazard consistent methodology, due to the fact that nonlinearities in the relatively uniform soil profile occur deeper in the profile. This finding cannot be explicitly extrapolated to foundations with footprints larger than that considered in this paper without further investigation.
Sites where nonlinearities are significant, such as sites with significant impedance mismatches between layers, or large input motions, the hazard consistent methodology produces LB profiles that are significantly softer, resulting in a greater shift of the SSI frequency relative to the simplified methodology. Depending on the mass and frequency of the structure considered, this can produce unconservative estimates of seismic demands in the structure and attached components.
In general, the simplified methodology identified in Section 3.7.2 of the SRP for definition of soil profiles using site independent input motions should be adjusted to address the expected level of nonlinearities in the soil profile to capture the appropriate lower bound soil column definition.
INTRODUCTION
Division IV
that do not provide data regarding high strain site soil properties consistent with the probabilistic seismic motions, soil properties for a SSI analysis must be estimated.
In the case of sites using generic broad-banded ground motion spectra for input into a SSI analysis, Section 3.7.2 of the SRP specifies that low strain soil properties can be used to define the Best Estimate (BE) soil profile, where the Lower Bound (LB) and Upper Bound (UB) profiles are defined as one-half and twice the shear modulus of the BE profile, respectively. The analysis described herein evaluates the appropriateness of this methodology for a range of sites and structures.
This analysis evaluates the simplified methodology that is based on low strain soil properties by computing hazard consistent, surface design motions for a range of sites, and performing SSI analyses using the strain compatible soil properties and design motions for a range of structures. A coincident analysis is then performed using the design surface motion as input into an SSI where low strain soil properties are distributed according to Section 3.7.2 of the SRP when strain compatible (i.e. high strain) properties are not known. This analysis assumes that the process of developing surface motions from a PSHA based on rock motions at depth, would produce surface motions consistent with that produced from an attenuation based PSHA. The analysis identifies the importance of nonlinearities in the soil profile on response of the structure.
The metrics used to test the simplified methodology are In-Structure Response Spectra (ISRS), seismic base shear and SSI frequency. The analysis is performed on: (1) a deep, soft soil site, (2) a deep, stiff site, and (3) a layered site with a strong impedance mismatch at relatively shallow depth.
SITE PROFILES AND ROCK MOTIONS
Three soil profiles are used in this analysis: (1) a deep, soft soil site representative of the southeastern U.S., (2) a deep, stiff site representative of a western, volcanic site, and (3) a layered alluvial site with an impedance mismatch at shallow depth. In this case, shallow depth is defined as within two building radii of the foundation. For each soil profile, a probabilistic site response analysis is performed consistent with procedures defined in the SRP where the input motion is defined as an outcrop motion at bedrock. Figure 1 shows the 5% damped Acceleration Response Spectra (ARS) of the outcrop time history motions used in the probabilistic site response analyses. Note, the deep soil site is analyzed at two different levels of outcrop motion, one with a Peak Ground Acceleration (PGA) of approximately 0.15g, and one with a PGA of approximately 0.3g.
Figure 1. Rock Outcrop ARS (5% Damped)
Out[1302]=
0.1 0.5 1.0 5.0 10.0 50.0 100.0
0.0 0.1 0.2 0.3 0.4 0.5 0.6
Frequency�Hz�
S
pectr
al
A
cc
.
�
g
� Deep Soil Site�0.15g
Deep Soil Site�0.3g
Deep Stiff Site
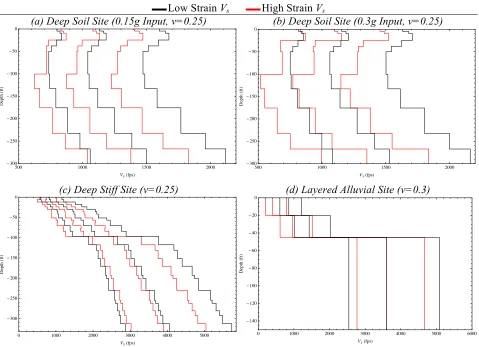
The resulting BE, LB and UB shear wave velocity (Vs) soil profiles developed from the
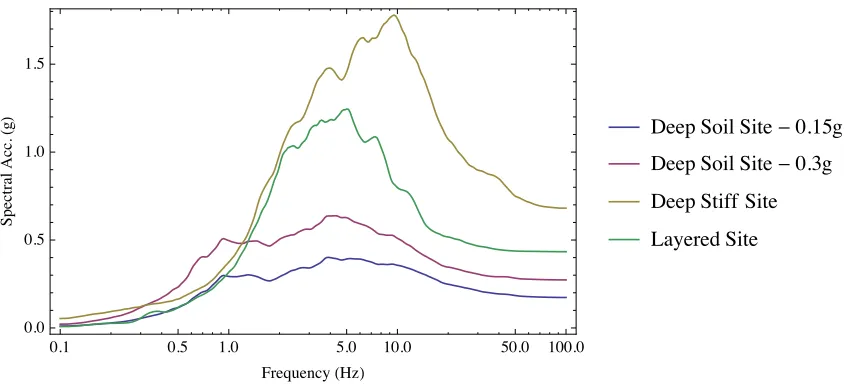
probabilistic site response analyses are shown in Figure 2, for both the low strain (black curves) and high strain soil (red curves) SSI methodologies. The LB and UB low strain velocity profiles are generated by multiplying the shear modulus of the BE low strain soil profile by 0.5 and 2, respectively. Figure 3 shows the resulting 5% damped surface ARS for the four probabilistic site response analyses. Note, the surface ARS of Figure 3 assume the scale factor defined in ASCE 43 (ASCE, 2005) is unity. Also, the curves are not transformed into a smooth design spectral shape. Smoothing of the spectra through linearization of the curves in log-log space to create a design shape is not important for this analysis, therefore, the spectra are taken directly from the probabilistic site response analyses.
In all four probabilistic site response analyses, the UB low strain profile bounds the UB strain compatible profile. In the case of the deep soil site (Figures 2a and 2b) the LB low strain profile is similar to the LB strain compatible profile in the upper 25 ft of the soil column. However, below 25 ft of depth the LB strain compatible profile is softer than the LB low strain profile due to nonlinearities in the analysis. This difference increases with increased level of the input motion as observed by the more pronounced softening of the LB strain compatible profile from the 0.15g to 0.3g input levels.
Low Strain Vs High Strain Vs
(a) Deep Soil Site (0.15g Input, ν=0.25) (b) Deep Soil Site (0.3g Input, ν=0.25)
(c) Deep Stiff Site (ν=0.25) (d) Layered Alluvial Site (ν=0.3)
Figure 2. BE, LB and UB Shear Wave Velocity Profiles
In the case of the deep stiff and layered alluvial sites (Figures 2c and 2d) the LB strain compatible profile is softer than the LB low strain profile above the soil layer where a significant impedance mismatch occurs. In the case of the deep stiff site, this layer is at 100 ft depth, and in the case of the
500 1000 1500 2000
�300 �250 �200 �150 �100 �50 0
Vs�fps�
D epth � ft � High Strain Low Strain
500 1000 1500 2000
�300 �250 �200 �150 �100 �50 0
Vs�fps�
D epth � ft � High Strain Low Strain
0 1000 2000 3000 4000 5000
�300 �250 �200 �150 �100 �50 0
Vs�fps�
D epth � ft � High Strain Low Strain
0 1000 2000 3000 4000 5000 6000
�140 �120 �100 �80 �60 �40 �20 0
Vs�fps�
Division IV
layered alluvial site this layer is at 45 ft depth. The layered alluvial site produces significant nonlinearity in the upper portions of the profile, as evidenced by the fact that the LB strain compatible profile is less than half that of LB low strain profile.
Figure 3. Probabilistically Developed Surface ARS (5% Damped)
SOIL-STRUCTURE INTERACTION ANALYSIS METHODOLOGY
SSI analyses are performed on each soil profile for a range of structures of varying frequency content. The first analysis is performed using the process defined for a typical SSI analysis, where high strain properties are known based on a PSHA defined by bedrock outcropping motions. The second, coincident analysis for each profile and structure uses the surface motion developed from the first analysis, with low strain soil properties consistent with guidance in Section 3.7.2 of the SRP for generic ground motions. The goal is to compare the results of the approximate process to that of the hazard consistent process, which is treated as the target response in this analysis.
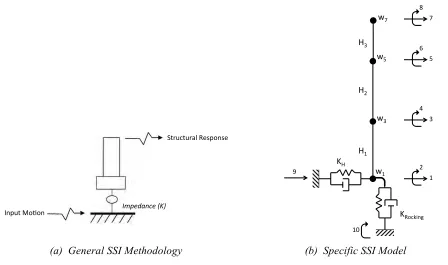
In order to ensure that significant SSI effects are captured, the properties of the structure are parameterized to encapsulate a broad range of structural frequencies. Figure 4a shows the general SSI analysis procedure whereby an input motion is applied at the support level, transferring the motion into a spring and dashpot representing the foundation impedance for the soil/foundation system.
Figure 4b shows the model implemented in this analysis. The structure is defined as a cantilever model attached to horizontal translation and rocking springs representing the foundation impedance. Coupling terms between translation and rocking are included in the model. Surface foundation impedances are generated for a 45 ft by 45 ft square, rigid, massless foundation using SDE-SASSI version 2.0, for each soil profile shown in Figure 2.
Properties of the structure in terms of mass, stiffness and height are defined using parametric definitions of the relation of the frequency of the structure to that of the site profile. In this analysis, the
mass ratio of the structure to the site (!) is defined by Equation 1.
!=!!!! , (1)
where, m is the mass of the structure, ρ is the mass density of the soil, and r is the equivalent
foundation radius. In this analysis, ! is set equal to 2, which is selected because it is a mass level that
will generate significant SSI effects.
Out[1307]=
0.1 0.5 1.0 5.0 10.0 50.0 100.0
0.0 0.5 1.0 1.5
Frequency�Hz�
S
pectr
al
A
cc
.
�
g
� Deep Soil Site�0.15g
Deep Soil Site�0.3g
Deep Stiff Site
(a) General SSI Methodology (b) Specific SSI Model
Figure 4. Schematic of SSI Analysis Model
The height of the structure is set to capture a ratio of height to foundation radius (ℎ) of 1, as
defined in Equation 2.
ℎ=!! , (2)
where, h is the height from the foundation to the center of gravity of the structure. ℎ is set equal
to 1 because this value will induce rocking demands on the foundation. Each profile is analyzed with a suite of structures of varying frequency content, where the relation of the stiffness of the structure to that
of the site is defined by the parameter ! defined in Equation 3.
! = !!!
!!,!"# , (3)
where, ωs is the fixed-base natural frequency of the 1st structural mode, and Vs,avg is the average
shear wave velocity of the upper 100 ft of the BE strain compatible soil profile. In this analysis, ! ranges
from 0.2 to 4 which captures a range of structures typically observed in the nuclear industry. Given the
fixed values of foundation radius (r), mass ratio (!) and height ratio (ℎ), the mass and height of the
model shown in Figure 4b are determined for each site. Then, for each value of ! the stiffness of the
model is adjusted to capture the appropriate frequency response (ωs).
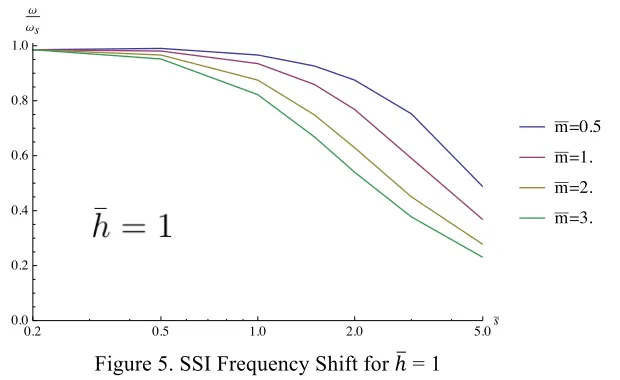
Figure 5 shows an example of the expected shift in SSI frequency relative to the fixed-base
frequency (! !!) for varying values of !, for a structure with ℎ = 1 and ! varying from 0.5 to 3.
!"#$%&'&(&)*+,*-./&,/&!"+#0"#+*1&
2345./43&
'6&
!"#$%&'($)*+,)
7/5#"&8.-./&
!"+#0"#+*1&2345./43&
!" #"
$" %"
&" '"
(" )"
*!" *#" *$"
+*"
+,-./012"
3!" 3$" 3&" 3("
4"
!5"
671809:;:<"=:7>"?-@:9"
*:7;AB"CD:7<"3799" 8AE:"-F"C8<G.8G<:" H02D8B">-<:"F9:I0J9:" C8<G.8G<79":9:>:18"
22nd Conference on Structural Mechanics in Reactor Technology
San Francisco, California, USA - August 18-23, 2013 Division IV
Figure 5. SSI Frequency Shift for ℎ = 1
The SSI analyses are carried out in the frequency domain where the appropriate input motion is convolved with resulting SSI transfer functions from the analysis. Time domain responses are generated in terms of 5% damped ISRS and seismic base shear.
RESULTS
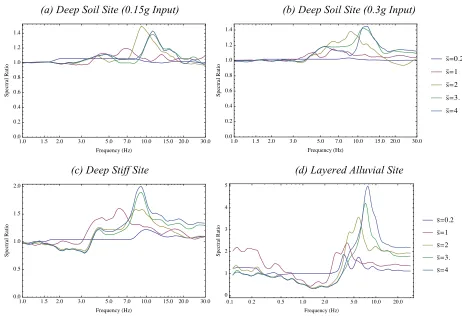
Figure 6 shows the ratio of horizontal ISRS at the top of the structure using the specified methodology with low strain soil properties and a surface motion, to that generated using the hazard consistent methodology. As shown in the figure, for the deep soil cases representative of essentially a uniform half-space, the low strain analysis methodology produces essentially equal or conservative ISRS relative to the hazard consistent methodology. In the case of the deep, stiff site and layered site, the low strain methodology produces conservative ISRS in the high frequency range, but unconservative ISRS in the low frequency range (<5 Hz).
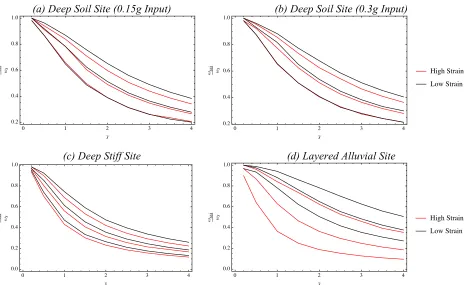
Figure 7 shows the ratio of SSI frequency to that of fixed base frequency (!!!" !!) for the first
mode of both systems versus !, for both the low strain and hazard consistent methodologies. Consistent
with observations for the spectral ratios of Figure 6, the shift in SSI frequency for the deep soil sites of the low strain methodology (black curves) envelopes the frequency shift of the hazard consistent, or “high strain” methodology (red curves). Note, in the upper 25 ft of the soil profile, the LB profiles are similar between both methodologies. Given the relatively small equivalent radius of the foundation of approximately 25 ft, it is expected that nonlinearities deeper in the soil profile would not impact SSI response for this structure. However, larger foundation radii may induce greater shift in the SSI frequency for the LB strain compatible soil column relative to that of the LB low strain profile.
In the case of the deep stiff and layered sites, the frequency shift becomes more pronounced between the two analysis methodologies. In particular, the layered site produces significantly more shift in SSI frequency when the hazard consistent methodology is used. This is due to the nonlinearities induced by the impedance mismatch of the profile, as evident in the relation of the LB strain compatible profile to that of the LB low strain profile shown in Figure 2d.
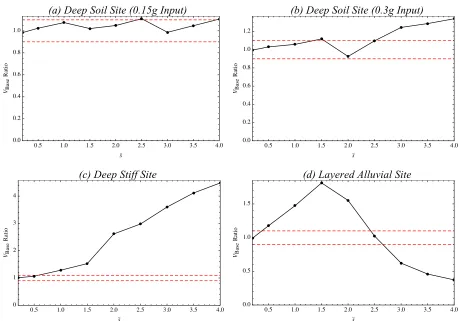
Figure 8 shows the ratio of seismic shear at the base of the structure using the simplified methodology with low strain soil properties and a surface motion, to that generated using the hazard consistent methodology. Note, the red dashed lines represent +/-10% of unity. Consistent with the observations for ISRS, base shears are relatively consistent between the two methodologies for the deep soil site.
In the case of the deep stiff site, base shears are significantly conservative. In the case of the layered alluvial site, the base shears are conservative for lower frequency structures, and unconservative
for higher frequency structures (! greater than 2.5). At these higher levels of stiffness ratio, the rigid
34% 0.2 0.5 1.0 2.0 5.0s
0.0 0.2 0.4 0.6 0.8 1.0
Ω Ωs
m�0.5
m�1.
m�2.
m�3.
body SSI frequency and the frequency of the first structural fixed base mode are generally far apart within the frequency band. Therefore, the primary mode of response is generally rigid body motion and rocking, not dynamic response of the structure. The unconservativism is due to the relation of the shift in SSI frequency of the high strain profile relative to the power of the input motion. It is expected that a profile with significant nonlinearity can be conservative or unconservative at different frequencies based on the character of the input motion.
(a) Deep Soil Site (0.15g Input) (b) Deep Soil Site (0.3g Input)
(c) Deep Stiff Site (d) Layered Alluvial Site
Figure 6. Ratio of Spectral Acceleration of Low Strain Methodology to Hazard Consistent Methodology
1.0 1.5 2.0 3.0 5.0 7.0 10.0 15.0 20.0 30.0
0.0 0.2 0.4 0.6 0.8 1.0 1.2 1.4
Frequency�Hz�
S
pectr
al
Ratio
s�0.2
s�1
s�2
s�3.
s�4
1.0 1.5 2.0 3.0 5.0 7.0 10.0 15.0 20.0 30.0
0.0 0.2 0.4 0.6 0.8 1.0 1.2 1.4
Frequency�Hz�
S
pectr
al
Ratio
s�0.2
s�1
s�2
s�3.
s�4
1.0 1.5 2.0 3.0 5.0 7.0 10.0 15.0 20.0 30.0 0.0
0.5 1.0 1.5 2.0
Frequency�Hz�
S
pectr
al
Ratio
s�0.2
s�1
s�2
s�3.
s�4
0.1 0.2 0.5 1.0 2.0 5.0 10.0 20.0 0
1 2 3 4 5
Frequency�Hz�
S
pectr
al
Ratio
Division IV
(a) Deep Soil Site (0.15g Input) (b) Deep Soil Site (0.3g Input)
(c) Deep Stiff Site (d) Layered Alluvial Site
Figure 7. Ratio of SSI Frequency to Fixed-Base Frequency for Low Strain and Hazard Consistent SSI Methodologies
0 1 2 3 4
0.2 0.4 0.6 0.8 1.0
s
Ωssi Ωs High Strain
Low Strain
0 1 2 3 4
0.2 0.4 0.6 0.8 1.0
s
Ωssi Ωs High Strain
Low Strain
0 1 2 3 4
0.0 0.2 0.4 0.6 0.8 1.0
s
Ωssi Ωs High Strain
Low Strain
0 1 2 3 4
0.0 0.2 0.4 0.6 0.8 1.0
s
Ωssi Ωs High Strain
(a) Deep Soil Site (0.15g Input) (b) Deep Soil Site (0.3g Input)
(c) Deep Stiff Site (d) Layered Alluvial Site
Figure 8. Ratio of Seismic Base Shear of Low Strain to Hazard Consistent Methodologies
CONCLUSIONS
This paper evaluates the appropriateness of the methodology specified in Section 3.7.2 of the SRP defining an SSI analysis methodology of safety-related structures, systems and components using site independent motions. In the cases where a site does not have a PSHA to rely on, or the PSHA is based on surface attenuation models that do not provide data regarding high strain site soil properties consistent with the probabilistic seismic motions, soil properties of an SSI analysis must be estimated.
In the case of sites using generic broad-banded ground motion spectra for input into a SSI analysis, Section 3.7.2 of the SRP specifies that low strain soil properties can be used to define the BE soil profile, where the LB and UB profiles are defined as one-half and twice the shear modulus of the BE profile, respectively. The analysis described in this paper evaluates the appropriateness of this methodology for a range of sites and structures.
This analysis evaluates the simplified methodology that is based on using low strain soil properties by computing hazard consistent, surface design motions for a range of sites, and performing SSI analyses using the strain compatible soil properties and design motions for a range of structures. A coincident analysis is then performed using the design surface motion as input into an SSI analysis where low strain soil properties are distributed according to Section 3.7.2 of the SRP when strain compatible (i.e. high strain) properties are not known.
0.5 1.0 1.5 2.0 2.5 3.0 3.5 4.0 0.0
0.2 0.4 0.6 0.8 1.0
s VBas
e
Ratio
0.5 1.0 1.5 2.0 2.5 3.0 3.5 4.0 0.0
0.2 0.4 0.6 0.8 1.0 1.2
s VBas
e
Ratio
0.5 1.0 1.5 2.0 2.5 3.0 3.5 4.0 0
1 2 3 4
s VBas
e
Ratio
0.5 1.0 1.5 2.0 2.5 3.0 3.5 4.0 0.0
0.5 1.0 1.5
s VBas
e
Division IV
The paper evaluates the effectiveness of the simplified methodology by comparing ISRS, SSI frequency shift and seismic base shear for a range of structures founded on three sites: (1) a deep, soft soil site representative of the southeastern U.S., (2) a deep, stiff site representative of a western, volcanic site, and (3) a layered alluvial site with an impedance mismatch at shallow depth.
The conclusions reached based on the results of this analysis are that for uniform sites, the simplified methodology defined in the SRP produces conservative SSI responses relative to the hazard consistent methodology, due to the fact that nonlinearities in the relatively uniform soil profile occur deeper in the profile. In this analysis, the nonlinearities in the deep soil profile did not initiate until a depth of one foundation radius of the structure. This finding cannot be explicitly extrapolated to foundations with footprints larger than that considered in this paper without further investigation.
In all cases, the simplified methodology produces an UB soil profile that bounds that of the hazard consistent methodology. In the case of a layered site where nonlinearities are significant, the hazard consistent methodology produces LB profiles that are significantly softer, resulting in a greater shift of the SSI frequency relative to the simplified methodology. Depending on the mass and frequency of the structure considered, this can produce unconservative estimates of seismic demands in the structure and attached components.
In general, the simplified methodology identified in Section 3.7.2 of the SRP for definition of soil profiles using site independent input motions should be adjusted to address the expected level of nonlinearities in the soil profile to capture the appropriate LB soil column definition. The primary elements controlling the level of nonlinearities are level of input motion, properties of the soil layers and locations and level of impedance mismatches within the profile.
REFERENCES
American Society of Civil Engineers. (2005). ASCE Standard 43: Seismic Design Criteria for Structures,
Systems, and Components in Nuclear Facilities. Reston, Virginia, USA.
American Society of Civil Engineers. (2013). DRAFT ASCE Standard 4: Seismic Analysis of
Safety-Related Nuclear Structures and Commentary. Reston, Virginia, USA.
U.S. Nuclear Regulatory Commission. (2007). NUREG-0800: Standard Review Plan for the Review of