Article
Propose of Mix Design Method for CO
2Reduction
Concrete Using the Regression Analysis
Tae Hyoung Kim
Building and Urban Research Institute, Korea Institute of Civil Engineering and Building Technology, Gyeonggi-Do 10223, Korea; [email protected]
Abstract: As argued by ‘Declaration of Concrete Environment (2010)’ of Korea and ‘Declaration of Asian Concrete Environment (2011)’ of six Asian countries, concrete as a single material has lately shown extremely large impact on environmental issues such as climate change. Assessment of environmental impact from concrete material and production has considerable importance. Concrete is a major material used in the construction industry that emits a large amount of substances with environmental impacts during its life cycle. Accordingly, technologies for the reduction in and assessment of the environmental impact of concrete from the perspective of Life Cycle Assessment must be developed. At present, the studies in relation to greenhouse gas emission from concrete are being carried out globally as a countermeasure against climate change. In this study, CO2 reduction concrete mix design algorithm was designed using correlation analyses, and its carbon emission and cost reduction performances were assessed. Using correlation analyses, the concrete strength, water/cement (w/c) ratio and fine aggregate/total aggregate (s/a) ratio, and CO2 emissions were identified as major variables of concrete mix design that influenced other variables. Also, this study aims to evaluate the CO2 emission reduction performance of the algorithm-deduced CO2 reduction concrete mix design, and therefore, the CO2 emissions of the CO2 reduction concrete mix design are compared with those of the actual concrete mix design applied to the construction of the office building A in South Korea.
Keywords: concrete; sustainability; regression analysis mix design; CO2 emission; cost
1. Introduction
With the increasing interest in climate changes worldwide, however, the development of concrete mix designs that consider the reduction of CO2 emissions, in addition to the physical properties such as strength and durability, has become necessary [1].
The major construction materials accounting for more than 90% of building greenhouse gas (GHG) emissions include concrete, rebar, insulation, concrete brick, glass and gypsum board [2]. Among the CO2 emissions generated by these major construction materials, concrete accounts for 70% [3].
model that can accurately define the outcome of the interactions of all these variables. To overcome these limitations, this study proposed a CO2 reduction concrete mix design algorithm by performing correlation analyses to rationally minimize CO2 emissions. This study aims to evaluate the CO2 emission reduction performance of the algorithm-deduced CO2 reduction concrete mix design, and therefore, CO2 emissions of the concrete mix design are compared with those of the actual concrete mix design applied to the office building in South Korea.
2. Literature review
To develop a mix design method for concrete to reduction CO2 emission, this chapter presented methodologies about mix design technique and life cycle CO2 emission assessment etc.
Trend of research was analyzed as below.
The goal that expected from Raharjo et al. research is to obtain the optimal material composition of the mixture that produce the maximum compressive strength but cheaper and competitive in price [6].
Berndt et al. has shown that selection of concrete constituents and appropriate mix design can be used to minimize CO2 emissions associated with large wind turbine foundations without compromising strength and performance requirements [7]. Andreas et al. aimed at empirically identifying a material parameter (or a number of parameters) that defines the carbonation resistance
of mortar and concrete produced with cements containing mineral additions [8].
Peter et al. introduced the commonly used methods of mix design (mixture proportioning) from the United States, and the United Kingdom. The basic principles that are common to all systems are discussed, and then the two methods are considered in detail, stage by stage [9]. Talha et al. presented a systematic approach for selecting mix proportions for alkali activated fly ash-based geopolymer concrete (GPC). The proposed mix design process is developed for low calcium Class F fly ash activated geopolymers using sodium silicates and sodium hydroxide as activator solutions [10]. Kim et al. evaluated the appropriateness and the reduction performance of the low-carbon-emission concrete mix design system and the deduced mix design results using an evolutionary algorithm (EA), the optimal mix design method, which minimizes the CO2emission of the concrete mix design [11]. Ramin et al. presented the experimental results of an on-going research project to produce geopolymer lightweight concrete using two locally available waste materials – low calcium fly ash (FA) and oil palm shell (OPS) – as the binder and lightweight coarse aggregate, respectively [12]. Linoshka et al. investigated a cleaner production of pervious concrete containing waste FA, a solid waste unless otherwise utilized, in combination with other admixtures of nano-iron oxide (NI) and WR. The mix design with the percentages of water-to-binder (w/b), FA/B, NI/B and WR/B was optimized for the desired permeability and compressive strength [13]. Hong et al. proposed an integrated model for assessing the cost and CO2emission (IMACC) at the same time. IMACC is a model that assesses the cost and CO2emission of the various structural-design alternatives proposed in the structural-design process. To develop the IMACC, a standard on assessing the cost and CO2emission generated in the construction stage was proposed, along with the CO2 emission factors in the structural materials, based on such materials' strengths [14].
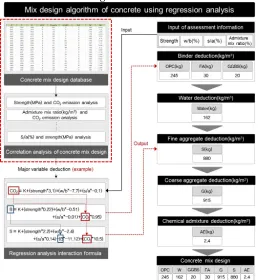
3. Mix design algorithm of CO2 reduction concrete
3.1 Algorithm process
The regression equations were derived using four different concrete mix designs: plain, with fly ash (FA), ground granulated blast furnace slag (GGBS), and both FA and GGBS.
3.2 Establishment of a concrete mix design database
A total of 800 concrete mix designs supplied by 10 RMC suppliers in Korea were investigated as shown in Table 1. The concrete mix designs had varying strength levels (18, 21, 24, 27, 30, 35, 40, 50, and 60 MPa) with variables such as plain cement, mixing water, coarse and fine aggregates, and admixtures. Further, the size of coarse aggregate, strength, and w/b and s/a ratios were investigated. Approximately 800 combinations of concrete strength and admixture type (GGBS/FA/GGBS+FA) were included in the database.
3.3 CO2 emissions assessment
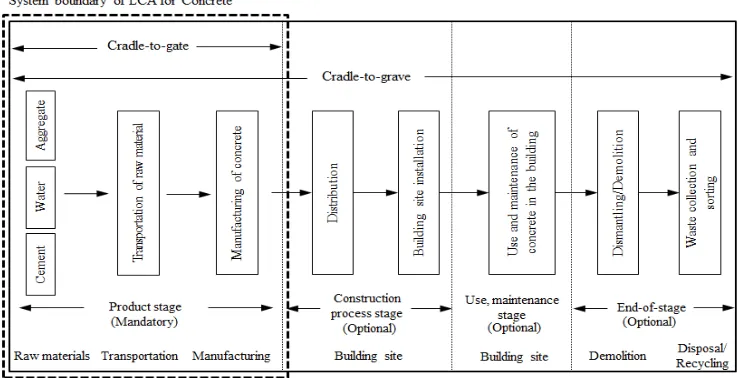
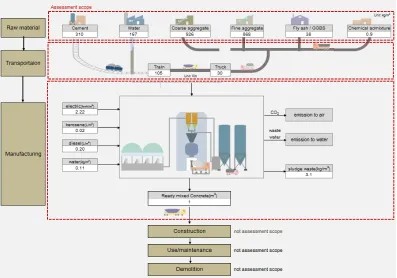
A system boundary was established for the life cycle CO2 emission evaluation of concrete. The system boundary was selected as the product stage of concrete (cradle to gate) based on ISO 14044 [20] and ISO 21930 [21]. The product stage of concrete is divided into the raw material stage, the transportation stage, and the manufacturing stage [22]. The raw material stage refers to CO2 emission during the production of major components of concrete such as cement, aggregate, and water. The transportation stage’s CO2 emission occurs during the transportation of raw materials to the ready-mixed concrete manufacturing plant. The manufacturing stage’s CO2 emission comes from electricity and oil used in the concrete batch plant. The system boundary for life cycle CO2 emission of concrete is shown in Figure 1. Also, Figure 2 is the production process of concrete.
Figure 2. The production process of concrete according to LCA.
CO2 emissions of concrete mix designs were evaluated by calculating the cumulative product of the amount of each material in the concrete mix and the intensity of CO2 emission from the respective materials. The intensities of CO2 emissions were drawn from the life cycle inventory (LCI) databases used in Korea [15] and other countries [16]. Intensities of CO2 emissions from plain cement, mixing water, and coarse and fine aggregates were drawn from the Korean LCI database, whereas the intensities for admixtures (GGBS, FA, and chemical admixtures), for which no Korean LCI databases were available, international LCI databases were used as shown in Table 2 [17, 18].
Table 1.
Example of concrete mix design Database
Strength (MPa)
W/B (%)
S/a (%)
Mix design (kg/m3) CO
2 emission
(kg-CO2/m3)
G S OPC FA GGBS W AE
21 52.7 49.9 906 893 293 33 0 172 1.63 282.4
24 45.7 47.5 910 818 188 38 151 172 2.26 187.5
: :
: :
: :
: :
: :
: :
: :
: :
: :
: :
: :
50 30.5 45 866 728 477 64 0 165 7.03 457.7
50 30.3 44 914 715 457 31 30 163 6.46 439.0
w/b: water binder ratio s/a: fine aggregate ratio OPC: ordinary portland cement FA: fly ash W: water GGBS: ground granulated blast furnace slag G: coarse aggregate S: fine aggregate AE: chemical admixture
Table 2. CO2 emission factor and reference
Constituent material CO2 emission factor Reference
ordinary portland cement 0.944kg-CO2/kg Korea national LCI DB
coarse aggregate 0.0014kg-CO2/m3 Korea national LCI DB
fine aggregate 0.0001kg-CO2/m3 Korea national LCI DB
ground granulated blast furnace slag 0.0418kg-CO2/kg Ecoinvent
fly ash 0.0153kg-CO2/kg Ecoinvent
water 0.0001kg-CO2/kg Korea national LCI DB
3.4 Correlation analysis
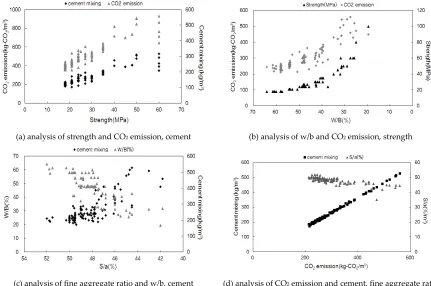
Correlation analyses [19] were performed considering 13 variables, including target strength (MPa) of the concrete mix design, w/b and s/a ratios (%), slump (mm), plain cement, mixing water, fine aggregate, and admixture contents (kg/m3), as well as CO2 emissions (kg-CO2/m3)’ and cost (KRW/m3) [20]. Variables w/b and s/a ratios, slump, CO2 emissions, and cost were found to be highly correlated with concrete strength as shown in Table 3. For instance, with increase in concrete strength, the w/b ratio decreased, whereas aggregate content, CO2 emissions, and cost increased. Variables highly correlated with the w/b ratio were concrete strength, plain cement content, slump, s/a ratio, CO2 emissions, and cost. Variables highly correlated with plain cement content were concrete strength, w/b and s/a ratios, fine aggregate content, slump, CO2 emissions, and cost. Variables highly correlated with fine aggregate content were strength, w/b and s/a ratios, plain cement content, CO2 emissions, and cost. Variables highly correlated with CO2 emissions were strength, the w/b and s/a ratios, plain cement and fine aggregate contents, slump, and cost. For instance, with increase in CO2 emissions, concrete strength, and plain cement and fine aggregate contents increased, whereas cost and the w/b ratio decreased. Variables highly correlated with cost were concrete strength, w/b and s/a ratios, plain cement and fine aggregate contents, slump, and CO2 emissions. The unit prices of concrete materials were excluded from the analyses because they significantly varied from one company to another. Thus, from the 12 different variables that were subject to correlation analyses, four variables were found to be most highly correlated: concrete strength (MPa), w/b (%), s/a (%), and CO2 emissions. Regression equations were then deduced from these four key variables as shown in Figure 2.
(a) Analysis of the concrete strength, CO2 emissions, and plain cement content (b) Analysis of the w/b ratio, CO2 emissions, and concrete strength
(c) Analysis of the w/b and s/a ratios, and plain cement content (d) Analysis of CO2 emissions, plain cement content, and the s/a ratio
Figure 2. Results of correlation analyses of the key variables of the concrete mix design
Table 3. Results of correlation analyses of concrete mix designs
(a) analysis of strength and CO2 emission, cement (b) analysis of w/b and CO2 emission, strength
3.5 Derivation of concrete mix design regression equations
The key variables that were found to have high degrees of correlation were subjected to regression analyses. Regression equations expressing relationships between the amounts of CO2 emissions, binder, and the fine aggregate were derived based on the presence of admixture in the concrete mix design, i.e., in four variations: without admixture, with FA or GGBS only, and with both FA and GGBS [21].
3.5.1 Equation for CO2 emission
A regression equation was derived to deduce the CO2 emission depending on the target strength (MPa), w/b(water/binder ratio), s/a(sand aggregate/total aggregate ratio), admixture mix ratio(%). To this end, we derived a regression equation, thereby setting the w/b ratio as the dependent variable and the concrete strength, w/b(%), s/a(%) and admixture mixing ratio(%) as independent variables. Using the amount of CO2 emission calculated from this equation, the binder amount can be deduced.
[Plain]
variable CO2 (kg-CO2) = 680.87 + (strength(MPa)*3.05) + (w/b(%)*-7.72) + (s/a(%)*-0.13)
[OPC+FA (Fly ash)]
variable CO2 = 512.25 + (strength*6.38) + (w/b*-0.41) + (s/a*-4.98) + (FA(%)*-5.31)
[OPC+GGBS (Ground granulated blast furnace slag)]
variable CO2 = 617.29 + (strength*1.12) + (w/b*-0.55) + (s/a*-3.65) + (GGBS(%)*-7.53)
[OPC+GGBS+FA]
variable CO2 = 662.31 + (strength*1.67) + (w/b*-4.29) + (s/a*-1.87) + [(GGBS+FA)]*-4.08)
3.5.2 Equation for binder amount (B)
A regression equation was derived to deduce the binder amount based on the target strength (MPa), w/b ratio, S/a ratio and CO2 emission. To this end, we derived a regression equation, thereby setting the content of binder as the dependent variable and the concrete strength, w/b, s/a, admixture
w/b S/a slump strength OPC W GGBS FA G S AE CO2 COST
w/b 1.000 0.835 0.433 0.968 0.905 0.005 0.010 0.096 0.155 0.892 0.730 0.907 0.940 S/a 0.835 1.000 0.262 0.850 0.814 0.118 0.024 0.126 0.131 0.935 0.630 0.816 0.816 slump 0.433 0.262 1.000 0.451 0.433 0.059 0.069 0.008 0.333 0.344 0.415 0.417 0.432 strength 0.968 0.850 0.451 1.000 0.898 0.003 0.040 0.106 0.148 0.903 0.781 0.902 0.938 C 0.905 0.814 0.414 0.898 1.000 0.164 0.244 0.043 0.154 0.860 0.670 0.998 0.940 W 0.005 0.118 0.059 0.003 0.164 1.000 0.223 0.198 0.321 0.211 0.054 0.181 0.155 GGBS 0.010 0.024 0.069 0.040 0.244 0.223 1.000 0.053 0.079 0.014 0.130 0.245 0.144 FA 0.096 0.126 0.008 0.106 0.043 0.198 0.053 1.000 0.146 0.171 0.026 0.037 0.027 G 0.155 0.131 0.333 0.148 0.154 0.321 0.079 0.146 1.000 0.115 0.115 0.163 0.192 S 0.892 0.935 0.344 0.903 0.860 0.211 0.014 0.171 0.115 1.000 0.685 0.866 0.883 AE 0.730 0.630 0.415 0.781 0.670 0.054 0.130 0.026 0.115 0.685 1.000 0.674 0.706 CO2 0.907 0.816 0.417 0.902 0.998 0.181 0.245 0.037 0.163 0.866 0.674 1.000 0.952
mixing ratio and CO2 emission as independent variables. Using the binder amount calculated from this equation and the CO2 emission calculated from the previous equation and the input information, mixing water content can be deduced.
[Plain]
variable B(kg) = 0.69 + (strength(MPa)*0.219) + (w/b(%)*-0.51) + (s/a(%)*-0.001) + (CO2 (kg-CO2)*0.958)
[FA(Flyash)]
variable B = 91.1 + (strength*1.846) + (w/b*-0.063) + (s/a*-1.893) + (CO2*0.894)
[GGBS(Ground granulated blast furnace slag)]
variable B = 857.3+ (strength*1.225) + (w/b*-6.471) + (s/a*-2.645) + (CO2*-6.535)
[GGBS+FA]
variable B = 437.3 + (strength*3.244) + (w/b*-3.274) + (s/a*-1.576) + (CO2*-0.236)
3.5.3 Equation for fine aggregate content (S)
A regression equation was derived to deduce fine aggregate content based on the target strength (MPa), w/b ratio, s/a ratio and admixture mixing ratio. To this end, we derived a regression equation, thereby setting the fine aggregate content as the dependent variable and the concrete strength, w/b, s/a, binder and CO2 emission as independent variables. Using the fine aggregate content calculated from this equation and the s/a ratio calculated from the previous equation and the input information, the coarse aggregate content can be deduced.
[Plain]
variable S(kg) = 716.922 + (strength(MPa)*2.177) + (w/b(%)*-2.413) + (s/a(%)*0.135) + (B(kg)*-11.118) + (CO2(kg-CO2)*210.48)
[FA(Flyash)]
variable S = 158.029 + (strength*0.847) + (w/b*0.144) + (s/a*17.588) + (B*-0.529) + (CO2*0.027)
[GGBS(Ground granulated blast furnace slag)]
variable S = -754.711 + (strength*-5.289) + (w/b*0.84) + (s/a*29.83) + (B*0.256) + (CO2*0.47)
[GGBS+FA]
variable S = 600.05 + (strength*2.654) + (w/b*-0.772) + (s/a*-11.351) + (B*-0.963) + (CO2*-0.963)
3.5.4 Equation for chemical admixture content
The amount of chemical admixtures (kg/m3) was generally applied as 0.5 ~ 1% of the amount of ordinary normal cement.
4. Process of deriving CO2 reduction concrete mix design
4.1 Input of assessment information
type and rate (%). The assessment information input is directly transferred to the matching regression equation embedded into the system [22].
4.2 Binder deduction (kg/m3)
The assessment information input is transferred to the regression equation for CO2 emissions, which significantly vary with admixture content or its absence. The amount of CO2 emissions thus deduced is transferred to the regression equation for deducing binder content, and the admixture type and rate yield the plain cement and admixture contents.
4.3 Water deduction (kg/m3)
From the binder content derived in 4.2 and the w/b ratio input in 4.1, the mixing water content of the concrete mix design is automatically deduced.
4.4 Fine aggregate deduction (kg/m3)
The values deduced from the assessment information input in 4.1, and those deduced from the regression equation relating CO2 emissions and binder content are transferred to the regression equation for deducing fine aggregate content of the target concrete mix design.
4.5 Coarse aggregate deduction (kg/m3)
Fine aggregate contents deduced from 4.4 and the s/a ratio input in 4.1 serve as the basis for deducing coarse aggregate content of the target concrete mix design.
4.6 Chemical admixture deduction (kg/m3)
Chemical admixture content is deduced using the regression equation that relates binder and mixing water contents in the range of 0.6–1.4%. This is because an adequate range was set via correlation analysis of the concrete mix design determined.
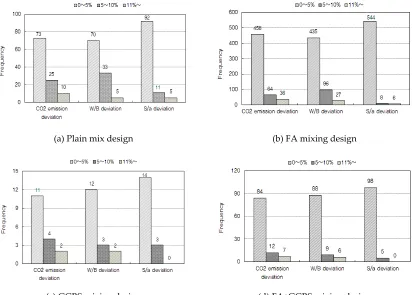
Figure 4 outlines the results of the reliability test of the concrete mix design derived using the CO2 reduction algorithm. The test was performed by feeding the concrete strength, w/b and s/a ratios, and admixture type and rate of approximately 800 mix designs as inputs to the proposed algorithm, followed by the analysis of the average values of CO2 emissions, and the w/b and s/a ratios of the plain cement mix design. These average values were then compared with those of the model mix design constructed using the CO2 reduction mix design system. Analyses were conducted on plain (N = 108), FA (N = 558), GGBS (N = 17), and FA + GGBS (N = 103) algorithm-deduced CO2 reduction mix designs.
As shown in Fig. 4(a), the reliability test revealed that 98 out of 108 plain cement mix designs had deviations of ≤ 10% from the model mix design in terms of CO2 emissions. The deviations for the w/b and s/a ratios were ≤ 10% in 103 plain cement mix designs. Of these, 70 mix designs showed deviations of ≤ 5% for the w/b ratio and 92 mix designs showed the same deviation for the s/a ratio. As shown in Fig. 4(b), the reliability test results for FA mix designs revealed that 522 out of 558 mix designs had deviations of ≤ 10% for CO2 emissions. In particular, deviations of ≤ 5% were observed for the w/b ratio of 435 mix designs and for the s/a ratio of 544 mix designs. This demonstrated high reliability. Fig. 4(c) shows the reliability test results of GGBS mix designs; 15 out of 17 mix designs showed deviations of ≤ 10% for CO2 emissions, and 15 and 17 mix designs showed deviations of ≤ 10% in the w/b and s/a ratios, respectively. High reliability was demonstrated as all 17 mix designs showed a deviation of ≤ 10% for the s/a ratio. Fig. 4(d) shows the reliability test results of FA+GGBS mix designs; 96 out of 103 mix designs showed deviations of ≤ 10% for CO2 emissions, and 97 and 103 mix designs showed deviations of ≤ 10% for w/b and s/a ratios, respectively. With all 103 mix designs showing deviations of ≤ 10% for s/a ratios, FA+GGBS mix designs demonstrated very high reliability.
The results of the overall analysis revealed that CO2 emissions, and the w/b and s/a ratios of the algorithm-deduced v mix designs showed low error rates (%), compared with those of the model mix design. Although there were cases where the average CO2 emissions, and the w/b and s/a ratios of the CO2 reduction mix designs showed deviations of ≥ 10%, compared with those of the model mix design, yet the former accounted for ≤ 7% of all cases. The reliability of the concrete mix design deduced by the CO2 reduction concrete mix design algorithm was thus verified.
(a) Plain mix design (b) FA mixing design
(c) GGBS mixing design (d) FA+GGBS mixing design
5. Case study
It is a 12-storey building with five underground floors and has a gross floor area of 462,000 m2. Information was collected on material amounts for all of the seven standard concrete types, which were used in the construction of the building and were supplied by eight RMC producers in Korea. Based on this information, CO2 emissions and cost-effectiveness were evaluated. Furthermore, a CO2 reduction concrete mix design was deduced under the same conditions, and the analysis and comparison of CO2 emissions and cost-effectiveness of the CO2 reduction mix design and the actual mix design were performed.
5.1 Method
Table 6 outlines the results of the assessment of CO2 emissions and cost-effectiveness of the actual mix design for the material amounts of each standard concrete used in the construction of the example building.
Table 6. Assessment method
Category Actual mix design This study
Assessment amount Actual use [m3]
Applied CO2 emission intensity Korean and European LCI databases
Unit price per material Korean product price data
Assessment items Assessment and analysis of the overall CO2 emissions
Assessment and analysis of the CO2 emissions by strength level
5.2 Result
5.2.1 Analyses of CO2 emissions and cost-effectiveness
As shown in Table 7, the concrete used for the construction of the example building were analyzed and assessed. The assessment revealed that 35,013,372 and 32,395,708 kg of CO2 were emitted from the actual mix design and the CO2 reduction mix design, respectively. CO2 emitted from the CO2 reduction mix design was 7.48% less than that emitted from the actual mix design as indicated in Table 8. In particular, the standard types 25-18MPa-150 and 25-24MPa-210 demonstrated reductions of 11% and 8%, respectively, in case of the CO2 reduction mix design, whereas the standard types 25-45MPa-600 and 25-48MPa-600 showed similar CO2 emissions in case of both the actual and CO2 reduction mix designs. Furthermore, the analysis of cost-effectiveness revealed that it was possible to reduce the material costs by approximately 1.5% when the CO2 reduction mix design was applied against the total material cost of 9,567,240,410 KRW for the actual mix design as indicated in Table 9. For standard types 25-24MPa-210 and 25-30MPa-150, which are in high demand, cost reductions of 50,982,102 and 56,058,408, respectively, were assessed to be possible.
Table 7. Assessment result of CO2 emission and Cost for concrete mix design
Concrete standard strength(MPa)-slump(mm) w/b (%) s/a (%) Amount
[m3] Category Company
Mix design [kg/m3] CO2
emission [kg-CO2/m3]
COST [KRW/m3]
C G S F/A GGBS W AE
18-150
59 50 2,088
Actual mix design
A 258 887 916 39 0 177 1.34 245.8 71,629 61 51 2,088 B 216 885 925 41 35 180 2.04 207.8 68,850 54 52 2,088 C 271 864 969 37 0 169 2.16 258.2 73,619 60 51 2,088 D 197 895 932 42 42 171 1.41 190.1 67,471 60 47 2,088 E 213 965 884 28 42 170 1.98 205.2 69,317 61 47 2,088 F 246 950 860 43 0 178 1.59 234.7 70,840 57 51 2,088 G 209 891 958 28 42 160 1.95 201.3 68,843 59 50 2,088 This study
(CO2 reduction
Table 8. Analyses of CO2 emissions and reduction ratio
Concrete standard strength(MPa)-slump(mm)
CO2 emissions (kg-CO2) CO2 emission reduction rate (%)
with respect to the actual mix design Actual mix design This study
18-80 73,255 68,836 6.03
18-150 3,222,355 2,861,129 11.21
24-210 18,383,462 16,822,918 8.49
30-120 42,146 40,190 4.64
30-150 10,693,385 10,021,201 6.29
45-600 1,093,352 1,080,835 1.14
48-600 1,505,415 1,500,596 0.32
Total 35,013,372 32,395,708 7.48
Table 9. Analyses of cost and reduction ratio
Concrete standard strength(MPa)-slump(mm)
Cost (KRW) Cost reduction rate (%) with respect to the actual mix
design Actual mix design This study
18-80 23,777,687 23,573,156 0.86
18-150 1,024,308,072 1,000,901,633 2.29 24-210 5,248,230,444 5,197,248,342 0.97
30-120 10,868,235 10,649,910 2.01
30-150 2,691,590,502 2,635,532,094 2.08
45-600 244,109,140 239,097,075 2.05
48-600 324,356,330 318,741,579 1.73
Total 9,567,240,410 9,425,743,790 1.48
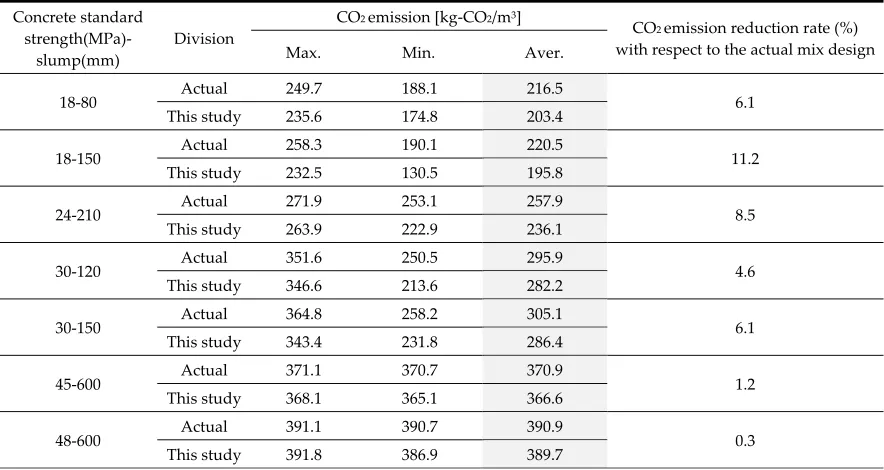
5.2.2 Analyses of CO2 emissions and cost-effectiveness by strength level
CO2 emissions and the cost-effectiveness of the actual and CO2 reduction mix designs were analyzed and compared based on strength level. As indicated in Table 10, the average reductions achieved by the mix design to reduction CO2 were 0.3–11% more than that achieved by the actual mix design.
54 52 2,088 mix design) 237 870 976 32 0 148 1.7 225.6 70,392 60 51 2,088 135 943 982 58 0 118 0.9 130.4 63,118 60 47 2,088 209 1039 951 35 34 167 1.5 201.5 72,362 61 47 2,088 244 966 874 43 0 176 1.7 232.5 71,364 57 51 2,088 210 849 913 35 35 161 1.5 201.6 66,646
24-210
47 48 10,182
Actual mix design
A 268 932 872 34 34 160 3.05 257.1 73,326 48 47 10,182 B 266 925 835 44 55 176 2.92 256.2 72,796 48 49 10,182 C 264 931 896 33 33 160 2.64 253.1 73,411 47 49 10,182 D 284 931 896 17 34 160 2.68 271.8 74,959 48 48 10,182 E 264 940 896 33 33 160 2.64 253.1 73,636 47 48 10,182 F 272 957 902 34 34 160 2.72 260.8 75,003 48 49 10,182 G 264 908 875 33 33 160 2.64 253.1 72,311 47 48 10,182
This study (CO2 reduction
mix design)
Table 10. CO2 emissions and reduction rates by strength level of concrete mix designs
Concrete standard
strength(MPa)-slump(mm)
Division
CO2 emission [kg-CO2/m3]
CO2 emission reduction rate (%)
with respect to the actual mix design Max. Min. Aver.
18-80 Actual 249.7 188.1 216.5 6.1
This study 235.6 174.8 203.4
18-150 Actual 258.3 190.1 220.5 11.2
This study 232.5 130.5 195.8
24-210 Actual 271.9 253.1 257.9 8.5
This study 263.9 222.9 236.1
30-120 Actual 351.6 250.5 295.9 4.6
This study 346.6 213.6 282.2
30-150 Actual 364.8 258.2 305.1 6.1
This study 343.4 231.8 286.4
45-600 Actual 371.1 370.7 370.9 1.2
This study 368.1 365.1 366.6
48-600 Actual 391.1 390.7 390.9 0.3
This study 391.8 386.9 389.7
As shown in Figs. 5 and 6, the main factors influencing CO2 emissions of the actual and low-carbon mix designs were identified to be the mix amounts of plain cement, GGBS, FA, and fine aggregate. In the case of the actual mix design, an increase in strength level tended to increase the mix amounts of plain cement and admixture (GGBS and FA) and the decrease in that of the fine aggregate. However, in the case of the concrete mix design to reduction CO2 emission, an increase in strength level did not affect the mix amounts of plain cement and admixtures, but slightly increased the mix amount of fine aggregate.
Figure 5. Amount of cement and admixture by
actual and CO2 reduction mix design
Figure 6. Amount of cement and fine aggregate by
actual and CO2 reduction mix design
In addition, as shown in Table 11, the low-carbon mix design outperformed the actual mix design in terms of cost-effectiveness, by demonstrating reduction rates ranging between 0.9% and 2.1%. In the actual mix design, an increase in the strength level tended to increase the mix amounts of plain cement and admixture, while that of fine aggregate tended to decrease. This resulted in increased costs because of the increased amount of plain cement and admixture. However, the low-carbon mix design did not incur such increase in costs because the mix amounts of materials were maintained at the minimum level at which they satisfied the targeted physical properties.
Table 11. Cost-effectiveness and reduction rates by strength level of concrete mix designs
strength(MPa)-slump(mm) Max. min. aver.
with respect to the actual mix design
25-18-80
Actual
mix design 72,774 67,254 70,265
0.9 This study
(low-carbon
mix design) 72,733 67,377 69,661
25-18-150 Actual 73,619 67,471 70,081 2.3
This study 72,362 63,119 68,480
25-24-210 Actual 75,003 72,311 73,635 0.9
This study 81,582 70,980 72,919
25-30-120 Actual 79,581 72,782 76,322 2.0
This study 79,409 69,620 74,789
25-30-150 Actual 80,298 73,060 76,789 2.1
This study 79,203 71,334 75,189
25-45-600 Actual 83,709 81,901 82,805 2.1
This study 81,190 81,019 81,105
25-48-600 Actual 84,796 83,452 84,224 1.7
This study 82,888 82,605 82,766
5. Discussion and limitations
The significance and limitations of the findings in this study are presented, and possible future directions are discussed.
The importance of reducing the CO2 emission of concrete is being recognized. The findings of this study are significant in that can be applied to concrete industry in South Korea. Moreover, method reducing CO2 emission of concrete can be conducted, and the strategy for reducing the embodied environmental impact can be sought.
Limitations of this study include 1. Consideration of assessment factors for durability (service life), 2. Experimental verification of the alternative concrete mix design to reduction CO2 emission.
1. Consideration of assessment factors for durability (service life),
In this study, deterioration phenomena was not considered as an assessment factor for durability of concrete in order to develop a CO2 reduction mix design algorithm. Since durability (service life) of concrete differs according to deterioration phenomenon, differences may arise by admixture (Ground granulated blast slag, GGBS) mixing on the same type of concrete. For example, when durability assessment is done only based on carbonation, durability (service life) of concrete is slightly reduced by mixing of admixtures (GGBS). On the contrary, chloride damage can show increase in durability (service life) of concrete from mixing of admixtures according to previous research.
Therefore, durability (service life) can be changed by admixture ratio (%) of concrete with the same mix design depending on the type of deterioration phenomenon. Through future study, durability (service life) of concrete will be assessed by considering various deterioration phenomena such as carbonation and chloride damage at the same time.
2. Experimental verification of the mix design method to reduction CO2 emission.
The mix design method to reduction CO2 emission was proposed in this study. However, it would be necessary to verify, through experiment, physical durability performance (compressive strength, carbonation and chloride etc.) of the mix design. In the future, mix design of concrete derived using the method reducing CO2 emission will be conducted the compressive strength and carbonation etc. experiments.
In this study, a CO2 reduction concrete mix design algorithm was designed using correlation analyses, and its carbon emission and cost reduction performances were assessed.
Using correlation analyses, the concrete strength, w/b and s/a ratios, and CO2 emissions were identified as major variables of concrete mix design that influenced other variables. The key variables were then subjected to regression analyses, and the regression equations for CO2 emissions and binder and fine aggregate amounts were derived.
Using the derived regression equations, we developed the CO2 reduction concrete mix design algorithm and system. The reliability of the proposed algorithm was verified by demonstrating that the CO2 reduction mix design exhibited a very low error rate compared with the model mix design constructed previously.
It was discovered that the actual mix design applied to the construction of the example building emitted 35,013,372 kg of CO2, while CO2 emitted by the CO2 reduction mix design was only 32,395,708. Thus, the CO2 emitted in the case of the CO2 reduction mix design was approximately 7.48% less than that emitted in case of the actual mix design. It was also discovered that it was possible to reduce material costs by approximately 1.5% when the CO2 reduction mix design was applied, as opposed to the total material costs of 9,567,240,410 KRW in the case of the actual mix design.
References
1. Zain, M.F. An Expert System for Mix Design of High-performance Concrete, Advances in Engineering Software. 2005, 36, 325-337.
2. Roh SJ, Tae SH, Shin SW, Development of building materials embodied greenhouse gases assessment
criteria and system (BEGAS) in the newly revised Korea Green Building Certification System (G-SEED), Renewable Sustainable Energy Rev 2014;35:410–21.
3. Oner, A.; Akyuz, A.; Yildiz, R. An experimental study on strength development of concrete containing fly ash and optimum usage of fly ash in concrete. Cement and Concrete Research. 2005, 35, 1165-1171.
4. Roh, S.J.; Tae, S.H.; Shin, S.W.; Woo, J.H. A Study on the Comparison of Characterization of Environmental Impact of Major Building Material for Building Life Cycle Assessment. Architectural Institute of Korea. 2013, 29, 93-100.
5. Chou, J.; Tsai, C. Concrete compressive strength analysis using a combined classification and regression
technique, Autom. Constr. 2012, 24, 52-60.
6. Raharjo, D.; Subakti, A.; Tabvio. Mixed Concrete Optimization using Fly Ash, Silica Fume and Iron Slag on the SCC's Compressive Strength. Procedia Engineering. 2013, 54, 827–839.
7. Berndt, M.L. Influence of concrete mix design on CO2 emissions for large wind turbine foundations.
Renewable Energy. 2015, 83, 608–614.
8. Andreas, L.; Peter, N.; Josef, K.; Roman, L. Relation between carbonation resistance, mix design and
exposure of mortar and concrete. Cement and Concrete Composites. 2015, 62, 33–43.
9. Peter A. Claisse. Chapter 21 – Concrete mix design. Civil Engineering Materials. 2016, 201–217.
10. M, Talha Junaid.; Obada, K.; Amar, K.; Jarvis, Black. A mix design procedure for low calcium alkali activated fly ash-based concretes. Construction and Building Materials. 2015, 79, 301–310.
11. Kim, T.H.; Tae, S.H.; Roh, S.J. Assessment of the CO2 emission and cost reduction performance of a
low-carbon-emission concrete mix design using an optimal mix design system. Renewable and Sustainable Energy Review. 2013, 25, 729–741.
12. Ramin, H.K.; Johnson, A.U.J.; Mohd, Z.B.J.; Hamid, N. Mix design for fly ash based oil palm shell
geo-polymer lightweight concrete. Construction and Building Materials. 2013, 43, 490–496.
13. Linoshka, S.P.; Hwang, S.C. Mix design and pollution control potential of pervious concrete with
non-compliant waste fly ash Journal of Environmental Management. 2016, 176, 112–118.
14. Hong, T.H.; Ji, C.Y.; Park, H.S. Integrated model for assessing the cost and CO2 emission (IMACC) for
sustainable structural design in ready-mix concrete. Journal of Environmental Management. 2012, 103, 1-8. 15. National Life Cycle Index Database Information Network. Available online: http://www.edp.or.kr (accessed
on 11 August 2015).
16. The Ecoinvent Database. Available online: http://www.ecoinvent.org/database (accessed on 11 August 2015). 17. ISO 14044. Life cycle assessment (Requirements and guidelines), 2006.
19. Douglas, M.; Peck J.W. Introduction to linear regression analysis, 2nd edition. 1992. 20. Korea Price Information, http://www.kpi.or.kr/, 2015.
21. Chou, J.; Tsai, C. Concrete compressive strength analysis using a combined classification and regression technique, Autom. Constr. 2012, 24, 52-60.
22. Kim, T.H.; Tae, S.H.; Lee, J.S. A Study on Development of a CO2 assessment Program of Concrete,
International Conference on Sustainable Building Asia (SB10). 2010, 1, 303-310.