International Journal of Computer Science and Mobile Computing
A Monthly Journal of Computer Science and Information Technology
ISSN 2320–088X
IMPACT FACTOR: 6.017
IJCSMC, Vol. 6, Issue. 1, January 2017, pg.213 – 220
Control of Shunt Active Power Filter for
Improvement of Power Quality
Ronak Mistry
1, Dr. Ami Patel
2 1ME 2nd Year 2Assitant Professor
1
MGITER, Navsari 2 GEC Bharuch
Abstract: Presence of Harmonics, voltage & frequency variations deteriorates the performance of the system. Quality of Power supplied is affected by various factors of the power system. Most of the Power Quality problems are introduce in to the system by the Power Electronics equipment because of its fast switching and non-linear characteristics. In the market competition Power Quality issues become very large because of using more sensitive equipment. This sensitive equipment will introduce more problems due to the built in compensation and sometimes lack of enforced regulations. Thus, Power quality improvement is become more important factor as a point of view for reliable & continuous Power System operation. Power quality may be improved by using filters and compensators. For improvement of Power Quality active power filters are used. This paper present the Simulink model of Shunt Active filters for improvement of Power Quality.
Keyword: Harmonics, THD, Active Filters, Shunt Active Filter.
I. INTRODUCTION
Most of the power quality problems are introduce by the Power Electronics devices because of its fast switching & non-linear characteristics. Because of increase in non-non-linearity causes different undesirable features like low system efficiency and poor power factor. It also causes disturbance to other consumers and interference in nearby communication networks. Hence, it is very important to overcome these undesirable features. Any Power Quality problem manifested in voltage and/or current deviations result into failure or disoperation of customer equipment. Both electric utility and end users of electric power are becoming increasingly concerned about the quality of electric power.
II. ACTIVE POWER FILTER
III. SHUNT ACTIVE POWER FILTER
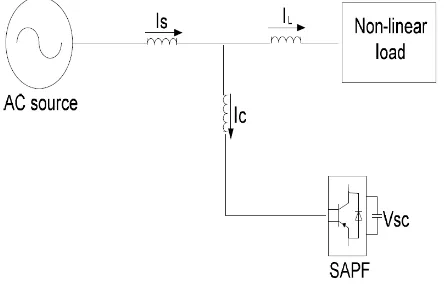
Fig.1 shows the basic block diagram of the shunt active filter, it is highly reliable with adequate compensation abilities. Shunt active filter has the capability for compensating load harmonic currents and reactive power requirement of the non-linear loads in power network. It is connected in parallel to power system network at a point of common coupling (PCC) between supply authority and consumers.
Figure 1:Shunt Active Filter
IV. SYSTEM CONFIGURATION
The configuration model of shunt active power filter using a voltage source converter (VSC) is shown in Fig.2. In this
model; the resistance Rf in series with the voltage source inverter represents the sum of the coupling inductor resistance
losses and the inverter conduction losses. The inductance Lf represents the leakage inductance of the coupling inductor.
The sum of the switching losses of the inverter and the power losses in the capacitor is represented by Rdc which is in
shunt with the DC-link capacitor Cdc. In Fig. 1, Vfa , Vfb , and Vfc are the three-phase Shunt Active Power Filter output
voltages; VLa ,VLb , and VLc are the three phase bus voltages at load-side; ifa, ifb , and ifc are the three-phase Shunt Active
Power Filter output currents.
Figure 2: Equivalent circuit of SAPF
V. MODELING OF SHUNT ACTVE FILTER
In order to analyses the balanced three-phase system more conveniently, the three-phase voltages and currents are
converted to synchronous rotating frame by abc/dq0 transformation. The dq-frame rotate with an angle Ө = ωt from the
reference axis of the abc-frame. By this transformation, the control problem is greatly simplified since the system
variables become DC values under the balanced condition. The transformation from phase variables to d and q coordinates is given as follows:
√
[
√ √ √ ]
A linear mathematical model for each phase of the SAPF shown in Fig.2 can be written as:
(2)
Equations (2) can be written in following form:
* + * + * + [
] (3)
With dq-transformation from equation (1),
( * +) * + * + * +
The above equation can be simplified as:
( * + * +) * + * + *
+ (4)
Where, √ [ ] [ ]
Applying all the above relation in equation (4)
* + [ ] * + * + *
+ (5)
Suppose, the output voltage of the SAPF can be expressed as:
(6) (7)
Using the relation (6) and (7), the equation (5) can be modified as
[ ] [
] [
] *
+ (8)
From the SAPF input-output power balance equation, it can be written as:
Or,
Or,
Or,
(9)
From the equations (8) and (9), the relation for the dynamic model of the SAPF can be derived and is given below:
[
]
[
]
[
] [
] (10)
VI. SIMULATON MODEL OF SHUNT ACTVE FILTER
The model used in Simulink to study with Shunt Active Filter is shown below:
Figure 3: Simulation model of shunt active filter
Figure 4 depicts SIMULINK model of with shunt active filter, whereas Figure 3 shows the implementation details of
shunt active filter which consist the four block such as Universal bridge, PQ & I-compensation, PI-controller and DC
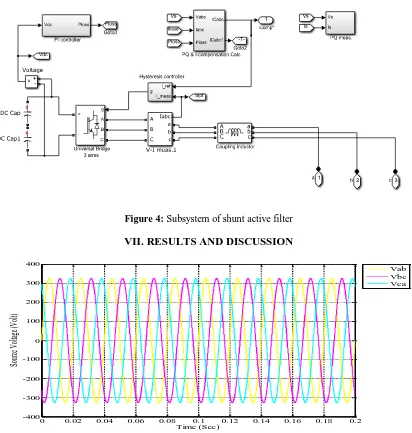
Figure 4: Subsystem of shunt active filter
VII. RESULTS AND DISCUSSION
Figure 5: Waveform of Source Voltage
Fig (5) and (6) shown the waveform of source voltage and current respectively.
Figure 6: Waveform of Source Current
0 0.02 0.04 0.06 0.08 0.1 0.12 0.14 0.16 0.18 0.2
-400 -300 -200 -100 0 100 200 300 400
Time (Sec)
So
ur
ce
V
ol
tag
e (
Vo
lt)
Vab Vbc Vca
0 0.02 0.04 0.06 0.08 0.1 0.12 0.14 0.16 0.18 0.2
-100 0 100
Time (Sec)
Isa
(A
m
p)
0 0.02 0.04 0.06 0.08 0.1 0.12 0.14 0.16 0.18 0.2
-200 0 200
Time (Sec)
Isb
(A
m
p)
0 0.02 0.04 0.06 0.08 0.1 0.12 0.14 0.16 0.18 0.2
-200 0 200
Time (Sec)
Isc
(A
m
Figure 7: Waveform of Load Current
Figure (8) and (9) THD analysis of the load current before and after CB is ON respectively.
Figure 8: THD of Load Current before CB ON
0 0.02 0.04 0.06 0.08 0.1 0.12 0.14 0.16 0.18 0.2
-100 0 100
Time (Sec)
IL
a
(A
m
p
)
0 0.02 0.04 0.06 0.08 0.1 0.12 0.14 0.16 0.18 0.2
-100 0 100
Time (Sec)
IL
b
(
A
m
p
)
0 0.02 0.04 0.06 0.08 0.1 0.12 0.14 0.16 0.18 0.2
-100 0 100
Time (Sec)
IL
c
(A
m
p
)
0 0.01 0.02 0.03 0.04 0.05
-50 0 50
FFT window: 3 of 10 cycles of selected signal
Time (s)
0 100 200 300 400 500 600 700 800 900 1000
0 5 10 15 20
Frequency (Hz)
Fundamental (50Hz) = 58.19 , THD= 30.26%
M
a
g
(
%
o
f
F
u
n
d
a
m
e
n
ta
Figure 9: THD of Load Current after CB ON
When Shunt Active Filter is not connected to the system, the THD at the load Side is calculated as 30.26%. After Shunt
Active Filter involve in to the system the THD is decrease to 30.26% to 4.42% which is shown in Table-1.
Table: 1 THD analysis
Without Shunt Active Filter 30.26%
With Shunt Active Filter 4.48%
VIII. CONCLUSION
Performance of shunt active power filter is checked with the use of MATLAB software. In the proposed scheme one type of load has been considered as nonlinear loads. Fig. 9 shows the performance of shunt active power filter under restive rectifier load. In this case the before the insertion of the shunt active power filter, Total Harmonic Distortion (THD) of source current was 30.26 % and after the insertion it comes down up to 4.42 %. Output result of load current for this case is shown in fig. 7.The shunt active filter was inserted at 0.06 second in the system.
IX. FUTURE WORK
The three phase active filter based on p-q theory can be implemented for harmonic mitigation and power factor correction. The PI controllers are applied to control the injection of the compensating currents and the DC bus voltage following on the command value. The design method of these controllers is completely presented in the paper.
REFERENCES
[1] U. R. M. a. R. K, "Dynamic Modeling and Control of Shunt Active Power Filter," IEEE, 2014.
[2] I. B. a. M. H. N. T. Musa Yusup Lada, "Simulation a Shunt Active Power Filter using MATLAB/Simulink," IEEE, pp. 371-375, 2010.
[3] Mika Salo and Heikki Tuusa, “A novel Open Loop Control Method for a Current–Source Active Power Filter”, IEEE Trans on Industrial Electronics, Vol. 50, No. 2, April 2003.
[4] Moleykutty George and Kartik Prasad Basu, “Three-Phase Active Power Filter”, 2008.
0.06 0.07 0.08 0.09 0.1 0.11
-50 0 50
FFT window: 3 of 10 cycles of selected signal
Time (s)
0 100 200 300 400 500 600 700 800 900 1000
0 0.1 0.2 0.3 0.4 0.5
Frequency (Hz)
Fundamental (50Hz) = 59.36 , THD= 4.48%
M
ag
(
%
o
f
F
u
n
d
am
en
ta
[5] I. Zamora, P. Eguia, A. J. Mazon, E. Torres and K. J. Sagasteita, “Using Active Filters to reduce THD in Traction System”.
[6] Roger C. Dugan, Mark F. McGranaghan, Surya Santoso, and H.Wayne Beaty, “Electrical Power systems Quality”, The McGraw-Hill, Second Edition, 2004.