Article
Technique of Gene Expression Profiles Extraction
based on the Complex Use of Clustering and
Classification Methods
Sergii Babichev1,2,†,‡ and Jiˇrí Škvor1,‡
1 Jan Evangelista Purkynˇe University in Ústí nad Labem, Ústí nad Labem, Czech Republic;
[email protected], [email protected]
2 Kherson State University, Kherson, Ukraine
* Correspondence: [email protected]; Tel.: +420-777-843-785
† Current address: Pasteurova 3632/15, 400 96 Ústí nad Labem, Czech Republic
‡ The authors contributed to this work as follows: the first author – 80%, the second one – 20%.
1
2
3
4
5
6
7
8
9
10
11
12
13
14
15
16
17
18
19
20
21
22
23
24
25
26
27
28
29
30
31
Abstract:Inthispaper,wepresenttheresultsoftheresearchconcerningextractionofinformative geneexpression profiles from high-dimensional arrayof gene expressionsconsidering the state of patients’ health using clustering method, ML-based binary classifiers and fuzzy inference system.Applyingoftheproposedstepwiseprocedurecanallowustoextractthemostinformative genestakingintoaccountboththe subtypesofdiseaseor stateofthepatient’s healthforfurther reconstructionofgeneregulatorynetworksbasedontheallocatedgenesandfollowingsimulationof thereconstructedmodels.Weusedthepubliclyavailablegeneexpressionsdataastheexperimental oneswhichwereobtainedusingDNAmicroarrayexperimentsandcontainedtwotypesofpatients’ geneexpressionprofiles: thepatientswithlungcancertumorandhealthypatients. Thestepwise procedureofthedataprocessingassumesthefollowingsteps:inbeginning,wereducethenumberof genesbyremovingnon-informativegenesintermsofstatisticalcriteriaandShannonentropy;then, weperformthestepwisehierarchicalclusteringofgeneexpressionprofilesathierarchicallevelsfrom 1to10usingSOTAclusteringalgorithmwithcorrelationdistancemetric.Thequalityoftheobtained clusteringwasevaluatedusingcomplexclusteringqualitycriterionwhichisconsideredboththe geneexpressionprofilesdistributionrelativetocenteroftheclusterswerethesegeneexpression profilesareallocatedandthecentersoftheclustersdistribution.Theresultofthisstageexecution wasselectionoftheoptimalclusterateachofthehierarchicallevelswhichcorrespondedtominimum valueofthequalitycriterion. Atthenextstep,wehaveimplementedclassificationprocedureof theexaminedobjectsusingfourwellknownbinaryclassifiers: logisticregression,support-vector machine,decisiontreesandrandomforestclassifier.Theeffectivenessoftheappropriatetechnique wasevaluatedbasedontheuseofROCanalysisusingcriteriaincludedasthecomponentstheerrors ofboththefirstandthesecondkinds.Thefinaldecisionconcerningextractionofthemostinformative subsetofgeneexpressionprofileswastakenbasedontheuseoffuzzyinferencesystem,theinputsof whicharetheresultsoftheappropriatesingleclassifiersoperationandoutputisthefinalsolution concerningstateofthepatient’shealth. Toourmind,theimplementationoftheproposedstepwise procedureoftheinformativegeneexpressionprofilesextractioncreatetheconditionsforincreasing effectivenessofthefurtherprocedureofgeneregulatorynetworksreconstructionandthefollowing simulationofthereconstructedmodelsconsideringthesubtypesofthediseaseand/orstateofthe patient’shealth.
Keywords: gene expression profiles; lung cancer; clustering; classification; ML-based binary classifiers; SOTA clustering algorithm; clustering qualitycriteria; ROC analysis; fuzzyinference system
32
1. Introduction 33
The use of gene expression datasets for reconstruction of gene regulatory networks (GRN) and 34
simulation of the reconstructed models is one of the topical directions of current bioinformatics [1–4]. 35
GRN in this case is a group of molecular elements interconnections that determines the functional 36
possibilities of biological organism. Qualitatively reconstructed GRN allows us to understand the 37
particularities of genes interconnections, differences of these interconnections for healthy and ill 38
cells in order to create both new effective medicines and methods to treat complex diseases, such as 39
Alzheimer, Parkinson, various types of cancer, etc. The results of both DNA microchip experiments 40
and mRNA molecules sequencing methods are used to form the gene expression data nowadays 41
[5,6]. In the first case, we have as a result the matrix of light intensities, the values of which are 42
proportional to expression of appropriate gene (level of gene activity). Transformation of these light 43
intensity into expression values assumes implementation of four steps: background correction [7–10], 44
normalization [7,11–15], PM correction and summarization [7,13,16,17]. In the second case, the initial 45
data is presented as a matrix of genes count, the values of which are varied in very wide range. In 46
this case, the first step of the data processing involves a transform of this matrix into gene expression 47
matrix using appropriate mathematical functions [18]. However, in any case, we receive as a result 48
the high dimensional matrix of gene expressions, where quantity of genes is varied from 50 to 60 49
of thousands of genes. Under the gene expression profile in this case, we understand a set of gene 50
expressions, the values of which are evaluated for various samples or under dissimilar conditions of 51
the experiment carrying out. Each of the profile values corresponds to appropriate sample. Informative 52
genes extraction in terms of current problem is the first task which should be solved at the stage of 53
the experimental data pre-processing. The informative genes extraction in this case means that it is 54
necessary to extract mutually correlated gene expression profiles in terms of resolving ability of the 55
studied samples (healthy and not-healthy patients or subtypes of disease). Biclustering technique is 56
applied to solve this problem in the most cases nowadays [19–21]. Each of the biclusters contains a set of 57
mutually correlated genes and samples. However, direct applying this technique to high-dimensional 58
array of gene expressions leads to large number of biclusters and the choice from them the informative 59
sets is very difficult and unsolved task nowadays. Moreover, in the most cases biclusters contains not 60
complete set of samples. This fact also limits the range of the gene expression values variation during 61
further simulation process. 62
Hereinbefore presented facts indicates the relevance of the research concerning extraction of groups 63
of informative genes considering particularities of the investigated objects for purpose of further 64
reconstruction of GRN based on the extracted genes and simulation of the reconstructed models. Within 65
the framework of this research, we solve this problem based on the complex apply of classification 66
and clustering techniques with the use of fuzzy inference system at the final step of decision making 67
concerning extraction of set of the informative gene expression profiles. 68
1.1. Problem Statement 69
The initial dataset is presented as a matrix of gene expressions: (eij) ∈ Rn×m, wherenandm 70
are the number of samples and genes respectively. We suppose that the samples can be divided into 71
previously known classes. The main problem consists of extraction of genes which allow us to divide 72
the samples into classes maximally correctly in terms of the used criteria. 73
1.2. Literature Survey 74
There are a lot of works which are devoted to gene expression data processing nowadays. So, 75
in [22] the authors considered reducing the non-informative genes expression profiles using both 76
from the data if its Shannon entropy value is larger and variance and average of absolute values are less 78
in comparison with appropriate boundary values. To determine the boundary values the authors used 79
fuzzy inference system and clustering quality criteria. The result of the proposed technique applying is 80
removing genes which has zero or low expression values for all samples (lowly expressed genes), low 81
level of gene expression variation for samples various types (do not allow distinguishing samples) and 82
chaotic variation of the expression values for investigated samples (high value of Shannon entropy). 83
In this study, we have applied the results of the authors research. 84
The papers [23,24] considered the issues concerning bicluster analysis of genes expressions data. 85
Implementation of this technique allows extracting groups of mutually correlated rows and columns. 86
In [23] the reserchers presented an enhanced version of Pearson’s correlation coefficient (PCC) to 87
achieve better biclustering-enabled co-expression analysis. the obtained results were established both 88
statistically and biologically using benchmarked gene expression data. In [24] the authors proposed a 89
novel approach for gene expression data biclustering with the use of fusion of differential evolution 90
framework and self-organizing Kohonen’s map (SOM). The proposed approach was applied on two 91
real-life microarray gene expression datasets and the obtained results were compared with various 92
current techniques. The papers [25,26] presents the research results concerning implementation of 93
various clustering techniques for single-cell RNA sequencing data processing. Within the framework 94
of the research, the authors carried out four experiments using two big scRNA-seq datasets with the 95
use of twenty models. The obtained results allowed authors to conclude that the proposed feature 96
extraction increased the quality of high-dimensional and sparse scRNA-seq data. The authors have 97
also shown that proposed feature-extraction techniques can promote to the clustering performance. 98
The issues concerning genes extraction to solve the problem of cancer types classification are 99
considered in [27]. The authors proposed a new hybrid wrapper procedure applying of which allows 100
combining the parameters of teaching learning-based algorithm and gravitational search algorithm. 101
They have shown also that proposed technique is expressively outmatch existing metaheuristic 102
methods relating to convergence rate, classification accuracy and optimal quantity of used features. 103
A new multi-classification technique based on combining the probabilistic support vector machine 104
and elastic net was described in [28]. Applying this technique can allow solving the problem of 105
cancer detection using gene expression profiles data of platelets. The authors applied within the 106
framework of the research the probabilistic support vector machine in order to produce the outputs of 107
the binary classifiers with class-specific features matching. The obtained results have shown that the 108
presented technique is well-suited for traditional multi-classification tasks in the case using datasets 109
with high-dimension of features and small quantity of samples. 110
In [29], the authors proposed a new approach for semi-supervised classification of time-series. The 111
proposed technique techniques learn both from labeled and unlabeled data. The authors have shown 112
that the proposed approach approach substantially outperforms the state-of-the-art semi-supervised 113
time-series classifier. The results of the research concerning the use of hubness-aware semi-supervised 114
approach for classification of high dimensional gene expression data are presented in [30]. The author 115
proposed a self-training semi-supervised extension of Naive Hubness-Bayesian k-Nearest Neighbor. 116
The author has also shown that the proposed approach can increase the classification accuracy and 117
reduce computational costs. In [31], the authors considered issues focused to classification of gene 118
expression data using extreme learning machines with regularization. The authors compared the 119
proposed technique with different regularization strategies in context of a binary classification task 120
related to gene expression data. The [32] presents the results of the research concerning development 121
of non-invasive method of recognition of finger skin based on K-NN classifier. The authors have 122
shown that the proposed approach can help us to diagnose pathologies of human skin. 123
However, we would like to note that accuracy of the classifier operation in the case of the use of 124
high dimensional gene expression data depends on the vector of the extracted genes which are used as 125
the classifier inputs. The perspective of our research is reconstruction of gene regulatory network based 126
of optimal subset of gene expression profiles can increase the informativity of the reconstructed gene 128
regulatory network and, as a result, it can create the conditions for better understanding the character 129
of genes interconnections during the following simulation process considering both the state of the 130
patient’s health or subtype of disease. In [35], we solve this problem based on stepwise apply of 131
clustering and biclustering techniques. Implementation of this procedure allowed us to remove gene 132
expression profiles which were identified as noise using density based DBSCAN clustering algorithm. 133
Then, we divided the set of remaining genes into two subsets using SOTA clustering algorithm. At the 134
final step, we applied the bicluster analysis to the obtained subset of gene expression profiles. To our 135
mind, the main disadvantage of this technique is the following: the gene expression data were divided 136
without considering the type of the used samples (state of the patients’ health or subtype of the disease). 137
We used in this case only appropriate quantitative criteria. This fact can influence the quality of the 138
reconstructed gene regulatory networks. This problem can be solved by using current techniques, 139
models and information technologies which are used successfully in various fields of scientific research 140
nowadays [33,34]. Within the framework of this research, we propose the solution of this problem 141
based on the complex use of clustering techniques, ensemble of binary classifiers and fuzzy inference 142
system using various quantitative quality criteria of both the clustering and classification procedures 143
implementation. 144
The aim of the paper is the development of a technique of stepwise gene expression data 145
extraction on the basis of complex use of cluster analysis, binary classifiers and fuzzy inference 146
system. To our mind, it can contribute to increase the objectivity of informative genes selection 147
considering the state of the patients’ health for purpose of both further gene regulatory networks 148
reconstruction based on the allocated genes and simulation of the reconstructed models. 149
2. Materials and Methods 150
2.1. General Procedure of the Problem Solving 151
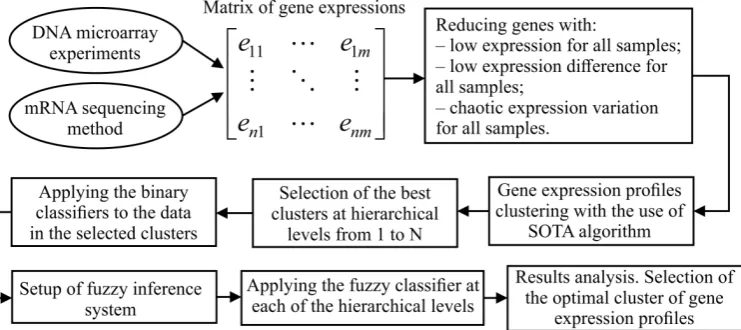
Figure1shows the structure chart of stepwise procedure of gene expression data processing 152
which was implemented within the framework of current research. As it can be seen from Figure1, 153
implementation of this procedure assumes solving the following tasks: 154
Figure 1.A structural chart of stepwise procedure of gene expression data processing
• formation of the matrix of gene expressions for the investigated samples. In the case of the use of 155
DNA microarray experiments technique, this step involves background correction, normalization, 156
PM correction and summarization. In the case of mRNA molecules sequencing method use, this 157
step assumes allocation of genes count matrix and following transforming the values of this 158
• extraction of genes which are identified as informative in terms of absolute value of gene 160
expressions, variance and Shannon entropy. 161
• hierarchical clustering of gene expression profiles at the levels from 1 to N using SOTA clustering 162
algorithm with correlation distance metric; 163
• division of the samples in allocated clusters of gene expression values into previously known 164
classes and calculation of the quality criteria considering both the samples distribution within the 165
appropriate classes and the distance between the samples in different classes; 166
• selection of the best clusters in terms of the used criteria at each of the hierarchical levels. These 167
clusters correspond to the extreme values of the used quality criteria; 168
• applying the binary classifiers to the data in obtained clusters at each of the hierarchical levels. 169
Formation of the intermediate solutions for each of the used classifiers and for each of the selected 170
clusters; 171
• setup of fuzzy inference system. Definition of the membership functions for both the input and 172
output variables, setup of ranges of the input and output parameters variation, knowledge base 173
formation; 174
• applying the fuzzy classifier at each of the hierarchical levels; 175
• results analysis. Selection of the optimal cluster of gene expression profiles in terms of the used 176
criteria. 177
2.2. Gene Expression Profiles Reducing 178
Implementation of this stage assumes removing genes, expressions profile of which were 179
identified as non-informative in terms of variance, average of absolute values of gene expressions and 180
Shannon entropy. We assumed that if gene expressions for all samples (averages of gene expressions 181
are small) and differences of gene expression values for different samples (variances) are small, and if 182
expression values for various samples are varied chaotically and this fact does not allow us to identify 183
correctly the classes of the examined samples (Shannon entropy values are large), then, this gene can 184
be removed from dataset as non-informative one. The value of Shannon entropy for each of the gene 185
expression profiles was calculated using James-Stein shrinkage estimator technique [36]. 186
To evaluate the appropriate criteria boundary values, we apply the technique presented in [22]. 187
Applying this technique involves the following: 188
• calculation of variance, average of absolute values and Shannon entropy for each of the genes 189
expression profiles. Formation of both the ranges of these criteria variation and steps of their 190
values chang; 191
• formation of clusters of the examined samples considering the data annotation. In the case of our 192
dataset use, the samples can be divided into two clusters (with tumor and healthy samples); 193
• Determination of clustering quality criterion which is calculated at each step of change of the used criteria. Within the framework of our research, we used as the clustering quality criterion the multiplicative combination ofWB-index [38] and Calinski Harabasz criterion [37]:
QCint= QCWB QCCH
= K(K−1)QCW
2
(N−K)QCB2 ; (1)
whereQCWandQCBare calculated as an average distance from objects to centers of the clusters where these objects are allocated and between centers of the clusters respectively:
QCW = 1 N
K
∑
s=1
Ns
∑
i=1
d(xsi,Cs) (2)
QCB= 2
K(K−1) K−1
∑
i=1
K
∑
j=i+1
Here,Kis the clusters quantity; Nis the number of samples;Nsis the number of samples in 194
the clusters;xsi is thei-th sample in the clusters;Ci,CjandCsare the centers of the clustersi,j 195
andsrespectively;d(·)is the distance metric between vectors of gene expressions. Considering 196
high dimension of the gene expressions vectors, we used the correlation distance as the distance 197
metric. Minimum value of the criterion (1) corresponds to the optimal clustering; 198
• increasing the boundary values of variance and average of absolute values from minimum 199
to maximum ones and Shannon entropy values from maximum to minimum one within the 200
admissible ranges and removing genes for which the variance and average of absolute values 201
are less and Shannon entropy is larger than appropriate boundary values. Calculation of the 202
clustering quality criterion at each step of this procedure execution by the formula (1); 203
• result analysis. Fixation of the used criteria boundary values which correspond to minimum 204
value of the clustering quality criterion; 205
• final removing the non-informative genes using determined boundary values of the statistical 206
criteria and Shannon entropy. 207
Below, we present the algorithm for this step implementation. 208
Algorithm 1:Gene expression profiles reducing Initialization:
Formation of the vectors of: variance (var), average of gene expression profiles absolute values (abs) and Shannon entropy (entr); set: ranges and steps of these parameters change; fix: iteration countert=1,m=1,var1=varmin,abs1=absmin,entr1=entrmax;
Create: the empty subsetsAandBfor allocation of informative and non-informative gene expression profiles; empty vector of clustering quality criterionQC;
whilet≤length(var)do
fix the bounrary values of the statistical criteria and Shannon entropy:varb =vart, absb =abst,entrb =entrt;
whilem≤ncol(dataset)do
calculation ofvarm,absm,entrm;
ifvarm ≤varband absm≤absband entrm≥entrbthen
distribution of the gene expression profile into the subsetA; else
distribution of the gene expression profile into the subsetB; end
m = m+1; end
formation of clusters of the examined samples based on subsetAconsidering the data annotation;
calculation of the clustering quality criterionQC[t]by the formulas (1)-(3); t=t+1;
end
Results analysis and final decision making: making the chart: QC = F(t);
fixation oftoptwhich corresponds to the minimum value of the quality criterionQC;
final division of the gene expression profiles into informative and non-informative subsetsA andBconsidering the determined boundary values of both the statistical criteria and Shannon entropy (vartopt,abstopt,entrtopt);
Returnthe subsetsAof the informative gene expression profiles. 209
2.3. Stepwise Hierarchical Gene Expression Profiles Clustering 210
As was noted hereinbefore, the main objective of this research is extraction of the most informative 211
the state of the patient’s health or subtype of the disease. For this reason, the next stage of the 213
hereinbefore presented procedure executing is stepwise gene expression profiles clustering at the 214
hierarchical levels from 1 toN. We used Self-Organizing Tree clustering Algorithm (SOTA) [40] with 215
correlation distance metric for this step implementation. This algorithm is a variety of self-organizing 216
neural networks and it is based on the complex apply of Kohonen maps and Fritzke algorithm of 217
spatial cell structure growing [41]. The simulation results have shown that SOTA clustering algorithm 218
with correlation distance metric divides the set of high dimensional gene expression profiles into two 219
clusters at one step of this procedure execution. Thus, the number of clusters is varied from 2 to 2Nat 220
the first and theN-th hierarchical levels respectively. Then, we calculated the quality criterion values 221
for each of the allocated clusters at each of the hierarchical levels using formulas (1)-(3). The vectors of 222
genes expressions which correspond to the studied samples are used in this case as the investigated 223
data. In other words, we evaluate in this case the proximity level of the samples, the attributes of 224
which are the values of genes expressions which are grouped in the cluster. One cluster at each of the 225
hierarchical levels was selected for the further research. These clusters correspond to the minimum 226
value of the used quality criterion. The algorithm for this step implementation is presented below. 227
Algorithm 2: Stepwise hierarchical gene expression profiles clustering using SOTA clustering algorithm
Initialization:
setup of SOTA clustering algorithm parameters:scell=0.001, pcell=scell×5, wcell=scell×2,distance = correlation;
fix: iteration countert=1, maximal clustering hierarchical leveltmax =N; create the empty vector of the clustering quality criterionQC;
whilet≤ Ndo
applying the SOTA clustering algorithm. Allocation of the clusters of gene expression profiles for the examined samples;
formation of subsets of the examined samples based on the obtained clusters;
calculation of the clustering quality criteria for the allocated clusters using the formulas (1)-(3);
fixation of the optimal cluster which corresponds to the minimum value of the clustering quality criterion;
t=t+1; end
Results analysis and final decision making: making the chart: QC = F(t);
selection of the clusters for the following processing. These clusters correspond to less values of the clustering quality criterion.
Returnthe list of the optimal clusters. 228
2.4. Binary Classification of the Investigated Samples 229
Four binary classifiers were used to evaluate the resolving ability of gene expression profiles in 230
the selected clusters: 231
• Logistic Regression classifier (GLM) [42]; 232
• Support-Vector Machine classifier (SVM) [43]; 233
• Decision Tree classifier (CART) [44]; 234
• Random Forest classifier (RF) [45]. 235
The quality criteria based on the errors of both the first and the second kinds were used to evaluate the 236
appropriate classifier effectiveness within the framework of the research. We used the gene expression 237
data of patients, which were investigated on lung cancer disease. The data contained two type of 238
states: 0 - healthy; 1 - tumor. The obtained results in this case can be represented using confusion 240
matrix as follows (Table 1): 241
Table 1.Confusion matrix for lung cancer disease diagnostic
Real state of test-objects Testing result
Tumor predicted Norm predicted (healthy)
Tumor (1) True positives (TP) False negatives (FN)
Healthy (0) False positives (FP) True negatives (TN)
The following criteria were used to evaluate the classifiers effectiveness: 242
• Accuracy(AC) determines the total probability that classifier predicts true results:
AC= TP+TN
TP+FP+TN+FN (4)
• F-measure(F) is defined as a harmonic mean ofPrecision(PR - positive predicted values) and Recall(RC or Sensitivity) [46]:
F= 2·PR·RC
PR+RC (5)
where:
PR= TP
TP+FP; RC= TP TP+FN
• Matthews correlation coefficient(MCC) used in machine learning as a measure of the quality of binary classifiers [47]:
MCC= p (TP·TN)−(FP·FN)
(TP+FP)·(TP+FN)·(TN+FP)·(TN+FN) (6) Larger value of each of the criteria corresponds to higher classifier effectiveness.
243
2.5. Fuzzy Inference System Implementation 244
Necessity of the use of fuzzy inference system [48] is determined by the possible contradiction of the different classifiers results for individual samples. To solve this problem, we propose to form the final solution using fuzzy inference system. Within the framework of our research the mathematical model can be presented as follows:
FS= f(xGLM,xSV M,xCART,xRF), (7) where FSis the output parameter of the fuzzy inference system characterized a final state of the 245
investigated object (tumor or health);xGLM,xSV M,xCART,xRF are the input parameters or the results 246
ofGLM,SV M,CARTandRFclassifiers respectively. The values of both the input and output variables 247
were varied within the range from 0 to 1. The fuzzy inference process executing assumes the following 248
stages: 249
1. Setup of the system: 250
• transforming the values of both the input and output variables into linguistic estimates. 251
Formation of the membership functions for each of the variables; 252
• formation of a basic term-set with appropriate membership function for each of the terms; 253
• formation of a set of fuzzy rules which are agreed between input and output variables. 254
2. Fazzification procedure. This step assumes evaluation of the membership functions values for each 255
3. Fuzzy inference process. This step involves the following: 257
• aggregation or determination of the conditions truth degree by clipping the levels for the 258
prerequisites of each of the rules using theminoperation; 259
• activation or determining the truth degree for each of the fuzzy rules; 260
• accumulation or forming the resulting membership function for output variable usingmax 261
operation. 262
4. Defuzzificationor determining the output variable crisp value. 263
3. Experiment 264
The publicly available gene expression dataGSE19188of patients examined at early stage of lung 265
cancer [49] was used as the experimental data within the framework of the research. This dataset was 266
obtained as a result of DNA microchip experiments. 156 of DNA microchips were obtained during the 267
experiment performing. The data annotation analysis has shown that the examined samples can be 268
divided into two groups: 65 of the patients were healthy and 91 of the patients have lung cancer tumor. 269
Thermamethod of data preprocessing (background correction, normalization, PM correction and 270
summarization) was used to form the array of gene expression profiles. Initially, the data contained 271
54675 of genes (maximum number of genes at each of the microchips). Thus, the initial dataset was 272
formed as a matrix in size (156×54675). 273
At the first step, the non-informative genes in terms of variance, Shannon entropy and average of 274
absolute values were reduced in accordance with technique described hereinbefore in the section 2.1. 275
The simulation process assumed changing the boundary values of Shannon entropy from maximum to 276
minimum value and appropriate statistical criteria values from minimum to maximum ones within 277
the admissible ranges. Then, the gene expression profiles were identified as informative profiles for 278
the following processing, if their average of absolute values and variance were larger and Shannon 279
entropy was less than appropriate boundary values. Two clusters considering the state of the patients’ 280
health were formed with following computation of the quality criterion by formulas (1)–(3) at each 281
stage of this procedure execution. Figure2presents the diagrams of both the quantity of genes in 282
clusters and the clustering quality criterion values versus the step of the boundary parameters change. 283
An analysis of the obtained charts allows concluding that the quality criterion achieves its 284
minimum value at 31-ststep. 21431 of genes are identified in this case as informative ones. Thus, the 285
initial matrix was transformed into matrix in size (156×21431) as a result of this step implementation. 286
At the next stage, we performed the stepwise gene expression profiles clustering at hierarchical levels 287
from 1 to 10 using SOTA clustering algorithm with following selection of the most informative groups 288
of genes at each of the hierarchical levels in accordance with technique described in the section 3. At 289
the final step, we have performed binary classification of the examined samples and have carried out 290
the fuzzy inference procedure for final solution making. 291
4. Results and Discussion 292
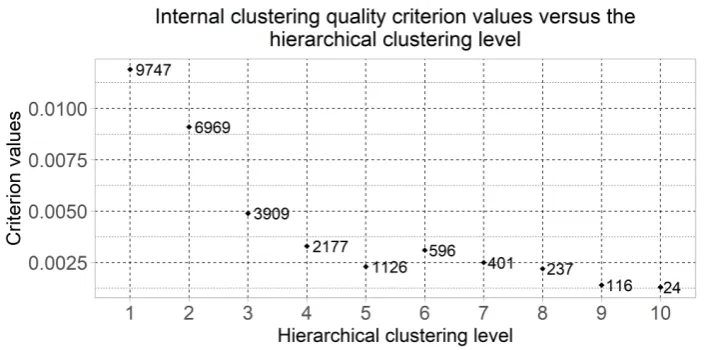
Figure3displays the dot plot of the clustering quality criterion values of which were computed 293
using the formulas (1)-(3) for the most informative clusters considering the minimum value of the 294
quality criterion at each of the hierarchical levels. This chart also shows the number of genes in the 295
selected clusters. The clusters quantity was changed from 2 to 210 = 1024 at the first and the tenth 296
hierarchical clustering levels respectively. Six of clusters were selected for the following research as the 297
result of the obtained chart analysis: the clusters which were allocated at hierarchical levels from 5 to 298
10. The cluster which was allocated at the fourth hierarchical level was not considered due to large 299
Figure 2.Diagrams of the number of genes in the clusters and the quality criterion values versus the step of the boundary parameters change
Figure 3.Dot plot of the clustering quality criterion calculated for the most informative clusters and the number of genes in this cluster versus the hierarchical clustering level
The simulation process concerning examined samples classification was performed using "Caret" 301
[50], "AER" [51], and "e1071" [52] packages of R software [53]. In the case of SVM classifier use, we 302
used the "linear" kernel (this choice was done empirically. Considering the high dimension of the 303
experimental data, the use of "radial" kernel gave significantly worse classification results). The 304
optimal parameters "gamma" and "cost" were determined in each of the cases empirically using 305
cross validation by the use of tune.svm() function of "e1071" package. The examined samples were 306
divided into two subsets considering the class to which belong the appropriate samples. 60% of 307
samples contained data for the model treaning and the remaining 40% were used for testing process 308
perform. In the case of logistic regression classifier (GLM) apply, we used glm() function with 309
f amily = binomial(link = ”logit”). Decision tree and random forest classifiers were implemented 310
Tables2–5present the simulation results concerning application ofGLM,SVM,CARTandRF 312
binary classifiers to classify the data in the selected clusters. The tables contain the results of the test 313
datasets classification using previously trained classifiers. 314
Table 2.Results of logistic regression classifier operation (GLM)
Hierarchical level Quality criteria
AC PR RC F MCC
5 0.543 0.474 0.450 0.462 0.066
6 0.565 0.526 0.476 0.500 0.118
7 0.565 0.632 0.480 0.545 0.148
8 0.522 0.579 0.440 0.500 0.060
9 0.587 0.579 0.500 0.537 0.169
10 0.804 0.895 0.708 0.791 0.629
Table 3.Results of support-vector machine classifier operation (SVM)
Hierarchical level Quality criteria
AC PR RC F MCC
5 0.913 0.842 0.941 0.889 0.821
6 0.935 0.895 0.944 0.919 0.865
7 0.935 0.895 0.944 0.919 0.865
8 0.913 0.842 0.941 0.889 0.821
9 0.913 0.895 0.895 0.895 0.821
10 0.848 0.842 0.800 0.821 0.689
Table 4.Results of decision tree classifier operation (CART)
Hierarchical level Quality criteria
AC PR RC F MCC
5 0.968 1.000 0.929 0.963 0.936
6 0.968 1.000 0.929 0.963 0.936
7 0.968 1.000 0.929 0.963 0.936
8 0.952 0.885 1.000 0.939 0.904
9 0.952 0.885 1.000 0.939 0.904
10 0.790 0.846 0.710 0.772 0.588
Table 5.Results of random forest classifier operation (RF)
Hierarchical level Quality criteria
AC PR RC F MCC
5 0.952 0.885 1.000 0.939 0.904
6 0.968 0.923 1.000 0.960 0.935
7 0.968 0.923 1.000 0.960 0.935
8 0.952 0.885 1.000 0.939 0.904
9 0.968 0.923 1.000 0.960 0.935
10 0.903 0.923 0.857 0.889 0.805
The obtained results analysis allows concluding that classifier based on logistic regression model 315
(GLM) is not effective to process high-dimensional vectors of gene expressions. The classification 316
results are not satisfactory in all cases. A little better result in terms of the used criteria was obtained in 317
the case of the use of cluster which was allocated at the tenth hierarchical level. This cluster contained 318
data classification. Significantly better results were obtained in the cases of other binary classifiers 320
applying. It should be noted that all classifiers show worse classification results in the case of the use 321
of data in the smallest cluster (24 of genes). In other cases, the results of the classifications almost 322
agree under the use ofSV M,CARTandRFclassifiers. Some better results were obtained in the case 323
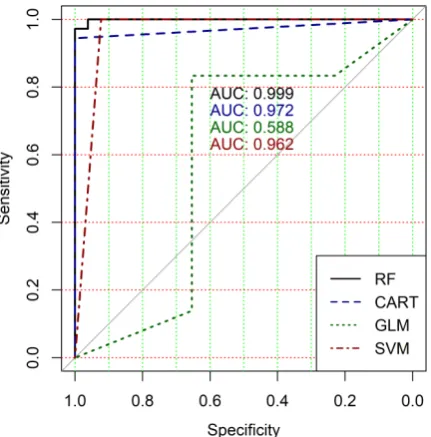
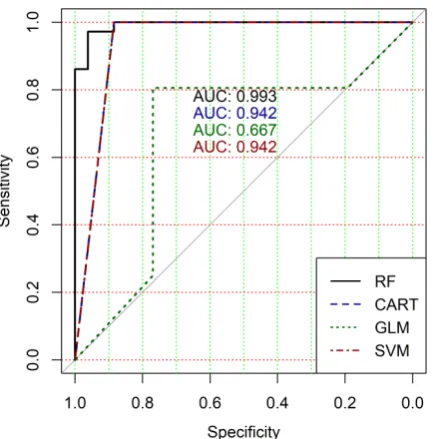
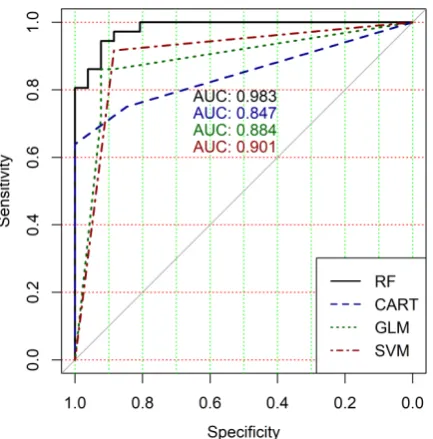
ofCARTandRFclassifiers use in comparison with the use ofSV Mclassifier. Figures4-9show the 324
ROC curves of classification results for datasets allocated at hierarchical clustering levels from 5 (1126 325
of genes) to 10 (24 of genes) in the case of the use of all ML-based binary classifiers. 326
Figure 4.ROC curves for models of ML-based binary classifiers at the hierarchical clustering level 5
Figure 6.ROC curves for models of ML-based binary classifiers at the hierarchical clustering level 7
Figure 8.ROC curves for models of ML-based binary classifiers at the hierarchical clustering level 9
Figure 9.ROC curves for models of ML-based binary classifiers at the hierarchical clustering level 10
The analysis of the ROC curves confirms the conclusion concerning low effectiveness of GLM 327
classifier (areas under the curves are 0.696, 0.588, 0.649, 0.667, 0.743 and 0.884 for clusters obtained at 328
hierarchical levels from 5 to 10 respectively) and high effectiveness of RF, CART and SVM classifiers 329
(areas under the roc-curves are significantly larger in comparison with areas obtained using GLM 330
classifier). For this reason, we will use only the results of RF, CART and SVM classifiers as the input 331
parameters of the fuzzy inference system at the next step of the simulation process. 332
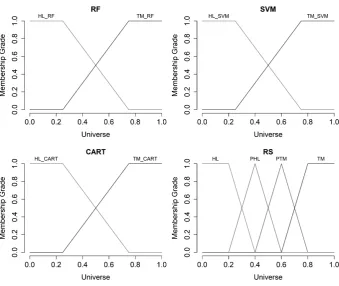
We defined the terms "Healthy" (HL) and "Tumor" (TM) for input variables (result of appropriate 333
classifier operation) and we used trapezoidal membership function for each of the terms. For output 334
Figure 10.The charts of the membership functions for input and output variables
Tumor" (PTM); and "Tumor" (TM). We used also trapezoidal membership function for termsHLand 336
TMand triangular membership function for termsPHLandPTMrespectively. 337
Figure10shows the charts of the hereinbefore defined membership functions for input and output 338
variables. 339
Table6presents the various combinations of the terms values which were used during the fuzzy 340
rules formation. We applied Mamdani inference algorithm for fuzzy inference procedure performing 341
and centroid method (mass center of the resulting membership function) for implementation of the 342
defuzzification process. 343
Table 6.Terms values of the input and output variables
Number of fuzzy rules Input and output variables
xSV M xCART xRF FS
rule 1 T T T T
rule 2 T T H PT
rule 3 T H T PT
rule 4 H T T PT
rule 5 H H T PH
rule 6 H T H PH
rule 7 T H H PH
rule 8 H H H H
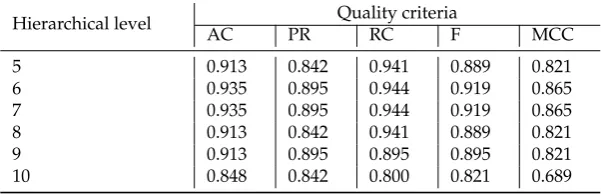
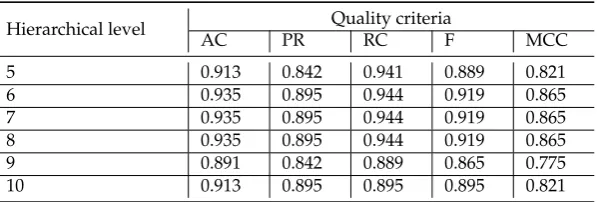
Table 7.Results of fuzzy inference system operation
Hierarchical level Quality criteria
AC PR RC F MCC
5 0.913 0.842 0.941 0.889 0.821
6 0.935 0.895 0.944 0.919 0.865
7 0.935 0.895 0.944 0.919 0.865
8 0.935 0.895 0.944 0.919 0.865
9 0.891 0.842 0.889 0.865 0.775
10 0.913 0.895 0.895 0.895 0.821
The obtained results analysis allows us to conclude that in the case of fuzzy inference system use, 345
we get some worse results for clusters obtained at hierarchical level from 5 to 9 and significantly better 346
result for cluster obtained at hierarchical level 10. Moreover, an analysis of the classification result for 347
cluster at ninth hierarchical level shows disagree of various binary classifiers applied at previously 348
step of our research in spite of very good classification results in the case of binary classifiers apply. 349
This fact indicates that the use of this cluster is not reasonable for the following research. Moreover, 350
the complex analysis of both Figure4and Tables3–5and Table7indicates the reasonability using 351
for the further research the cluster obtained at hierarchical level 7. The cluster contains 401 of gene 352
expression profiles, the values of the clustering quality criterion are not large too, and classification 353
results in the terms of the used quality criteria are suitable in the case of the use of both separate binary 354
classifiers and hybrid model based on fuzzy inference system. 355
5. Conclusions 356
In this paper, we have presented the results of the research concerning extraction of set of 357
informative gene expression profiles in terms of their mutually correlation based on the complex use 358
of both the clustering and classification techniques. The initial data has been presented as a matrix of 359
gene expressions(eij)∈Rn×m, wherenandmare the number of samples and genes respectively. The 360
publicly available gene expression dataGSE19188of patients examined at early stage of lung cancer 361
disease has been used as the experimental data. This data contained 156 of DNA microchips. The 362
annotation of the data has shown that the examined samples can be divided into two groups: 65 of the 363
samples for healthy patients and 91 of the samples belong to patients with lung cancer tumor. 54675 of 364
genes (maximal quantity of genes at DNA microchips) contained the initial dataset. 365
At the first step, we have extracted the informative gene expression profiles by removing 366
low-informative genes in terms of statistical criteria and Shannon entropy. In this case, we have 367
used the clustering quality criterion as the main measure to evaluate the boundary values of the 368
appropriate criteria. The initial matrix has been transformed into matrix in size (156×21431) as a result 369
of this step implementation. At the next stage, we have performed the step-by-step gene expression 370
profiles clustering at hierarchical levels from 1 to 10 with the use of SOTA clustering algorithm with 371
following selection of the most informative clusters in terms of the used clustering quality criterion 372
at each of the hierarchical levels. The number of clusters was changed from 2 to 210 =1024 at the 373
first and at the tenth hierarchical clustering levels respectively. Six of clusters have been selected for 374
the following research as the result of this step implementation: the clusters that were allocated at 375
hierarchical levels from 5 to 10. 376
Then, we have carried out the classification of the examined samples using four well known binary 377
classifiers: Logistic regression classifier (GLM); Support-vector machine classifier (SV M); Decision 378
tree classifier (CART); Random forest classifier (RF). The quality criteria based on errors of both the 379
first and the second kinds have been used to evaluate the appropriate classifier effectiveness. The 380
analysis of the obtained results has shown that classifier based on logistic regression model is not 381
effective to process the high-dimensional vectors of gene expressions. Significantly better results have 382
classifiers have shown worse classification results in the case of the use of data in the smallest cluster 384
(24 of genes). In other cases, the results of the classifications almost agree under the use ofSV M,CART 385
andRFclassifiers. Some better results have been obtained in the case ofCARTandRFclassifiers use 386
in comparison with the use ofSV Mclassifier. The simulation results have shown also that some of 387
the examined samples were identified differently and applying the fuzzy classifier to increase the 388
objectivity of the gene expression profiles extraction at the final step is reasonable. 389
The analysis of the results of fuzzy inference system operation allows concluding that we have 390
some worse results for clusters obtained at hierarchical level from 5 to 9 and significantly better result 391
for cluster obtained at 10-th hierarchical level. Moreover, an analysis of the classification result for 392
cluster at ninth hierarchical level has shown disagree of various binary classifiers in spite of very good 393
classification results in the case of the use of individual classifiers. This fact indicates that the use of 394
this cluster is not reasonable for the following research. The analysis of the obtained results has also 395
shown the reasonability using for the further research the cluster obtained at the hierarchical level 7. 396
This cluster contains 401 of genes, the value of the clustering quality criterion is not large, and the 397
classification results in terms of the used quality criteria are suitable in terms of both separate binary 398
classifiers and hybrid model based on fuzzy inference system. 399
To out mind, the conducted research can allow us to increase the objectivity for extraction of genes 400
which can be used for reconstruction of gene regulatory networks and simulation of the reconstructed 401
models considering the subtype of disease and/or state of the patient’s health. In further, we are 402
going to use the obtained results for both the gene regulatory networks reconstruction based on 403
allocated genes and simulation of the reconstructed models in order to better understanding the gene 404
interconnection in the cases of various state of the patient’s health. This is the perspective of our 405
research. 406
Author Contributions: The individual contributions of the authors are the following: Conceptualization,
407
formal analysis, resources, writing–review and editing: Sergii Babichev and Jiˇrí Škvor; methodology,
408
software (R-programming), validation, statistical analysis and investigation, writing–original draft preparation,
409
visualization: Sergii Babichev.
410
Funding:This research was funded by IGA UJEP, grant number UJEP-IGA-TC-2019-53-02-2.
411
Acknowledgments: We thank team of the researchers from Cell Biology, Erasmus University Medical Center,
412
Rotterdam, The Netherlands Hou J, Aerts J, den Hamer B, et al. who have performed a genome-wide gene
413
expression analysis on a cohort of 91 patients with tumor and 65 adjacent normal lung tissue samples. We would
414
like also to acknowledge the support from IGA UJEP (grant number UJEP-IGA-TC-2019-53-02-2)
415
Conflicts of Interest:The authors declare no conflict of interest.
416
Abbreviations 417
The following abbreviations are used in this manuscript:
418 419
DNA Deoxyribonucleic Acid
RNA Ribonucleic Acid
SOTA Self-Organizing Tree Algorithm ROC Receiver Operating Characteristic
PM Perfect-Match
GRN Gene Regulatory Network
PCC Pearson’s Correlation Coefficient
GLM Generalized Linear Model
SVM Support-Vector Machine
CART Classification And Regression Trees
RF Random Forest
References 421
1. Lesage, R., Kerkhofs, J., Geris, L. Computational modeling and reverse engineering to reveal dominant
422
regulatory interactions controlling osteochondral differentiation: Potential for regenerative medicine.
423
Frontiers in Bioengineering and Biotechnology2008,6, art. no. 165.https://doi.org/10.3389/fbioe.2018.00165 424
2. Alexiou, A., Chatzichronis, S., Perveen, A., Hafeez, A., Ashraf, G.M. Algorithmic and stochastic
425
representations of gene regulatory networks and protein-protein interactions.Current Topics in Medicinal
426
Chemistry2019,19(6), 413–425.https://doi.org/10.2174/1568026619666190311125256 427
3. Liu, Z.P. Towards precise reconstruction of gene regulatory networks by data integration.Quantitative Biology
428
2018,6(2), 113–128.https://doi.org/10.1007/s40484-018-0139-4 429
4. Byron, K., Wang, J.T.L. A comparative review of recent bioinformatics tools for inferring gene regulatory
430
networks using time-series expression data.International Journal of Data Mining and Bioinformatics2018,20(4),
431
320–340.https://doi.org/10.1504/IJDMB.2018.094889 432
5. Schena, M., Davis, R.W. InMicroarray biochip technology; Eaton Publishing, 2008; pp. 1–18.
433
6. Heather, J.M., Chain, B. The sequence of sequencers: The history of sequencing DNA.Genomics,2016,
434
107, 1–8.
435
7. Bolstad, B.M., Irizarry, R.A., Åstrand, M., Speed, T.P. A comparison of normalization methods for high
436
density oligonucleotide array data based on variance and bias.Bioinformatics,2003,19(2), 185–193.https: 437
//doi.org/10.1093/bioinformatics/19.2.185 438
8. Affymetrix: Statistical algorithms description document.Affymetrix,2002.http://tools.thermofisher.com/ 439
content/sfs/brochures 440
9. Irizarry, R.A., Hobbs, B., Collin, F., et al. Exploration, normalization, and summaries of high density
441
oligonucleotide array probe level data.Selected Works of Terry Speed2012, pp. 601–616.https://doi.org/10. 442
1007/978-1-4614-1347-9_15 443
10. Chen, Z., McGee, M., Liu, Q., Kong, M., Deng, Y., Scheuermann, R.H. A distribution-free convolution model
444
for background correction of oligonucleotide microarray data. BMC Genomics,2009,10(1), art. no. 19.
445
https://doi.org/10.1186/1471-2164-10-S1-S19 446
11. Gentleman, R., Carey, V., Huber, W., Irizarry, R., Dudoit, S. Bioinformatics and Computational Biology
447
Solutions Using R and Bioconductor.Springer2005.
448
12. Park, T., Yi, S.G., Kang, S.H., Lee, S.Y., Lee, Y.S., Simon, R: Evaluation of normalization methods for
449
microarray data.BMC Bioinformatics,2003,4, art. no. 13.https://doi.org/10.1186/1471-2105-4-33 450
13. Raddatz, B.B., Spitzbarth, I., Matheis, K.A., et al. Microarray-based gene expression analysis for
451
veterinary pathologists: A review. Veterinary Pathology,2017,54(5), 734–755. https://doi.org/10.1177/ 452
0300985817709887 453
14. Astrand, M. Contrast normalization of oligonucleotide arrays.Journal of Computational Biology,2003,10(1),
454
95–102.https://doi.org/10.1089/106652703763255697 455
15. Chen, Y.J., Kodell, R., Sistare, F., Thompson, K.L., Morris, S., Chen, J.J. Normalization methods for analysis
456
of microarray gene-expression data.Journal of Biopharmaceutical Statistics,2003,13(1), 57–74.https://doi. 457
org/10.1081/BIP-120017726 458
16. Barbara, D., Wu, X. An approximate median polish algorithm for large multidimensional data sets.
459
Springer-Verlag London Ltd. Knowledge and Information Systems,2003,5, 416–438.
460
17. Lazaridis, E.N., Sinibaldi, D., Bloom, G., Mane, S., Jove, R. A simple method to improve probe set estimates
461
from oligonucleotide arrays.Mathematical Biosciences,2002,176(1), 53–58. https://doi.org/10.1016/S0025-462
5564(01)00100-6 463
18. Babichev, S., Durnyak, B., Senkivskyy, V., Sorochynskyi, O., Kliap, M., Khamula, O. Exploratory analysis of
464
neuroblastoma data genes expressions based on bioconductor package tools.CEUR Workshop Proceedings,
465
2019,2488, 268–279.
466
19. Helgeson, E.S., Liu, Q., Chen, G., Kosorok, M.R., Bair, E. Biclustering via sparse clustering.Biometrics,2020,
467
76(1), 348–358.https://doi.org/10.1111/biom.13136 468
20. Xie, J., Ma, A., Zhang, Y., et al. Qubic2: A novel and robust biclustering algorithm for analyses and
469
interpretation of large-scale rna-seq data.Bioinformatics,2020,36(4), 1143–1149.https://doi.org/10.1093/ 470
21. Karim, M.B., Kanaya, S., Altaf-Ul-Amin, M. Implementation of bicluso and its comparison with other
472
biclustering algorithms.Applied Network Science,2019,1(1), art. no. 79. https://doi.org/10.1007/s41109-019-473
0180-x 474
22. Babichev, S., Barilla, J., Fišer, J., Škvor, J. A hybrid model of gene expression profiles reducing based on the
475
complex use of fuzzy inference system and clustering quality criteria. In:2019 Conference of the International
476
Fuzzy Systems Association and the European Society for Fuzzy Logic and Technology (EUSFLAT 2019). Atlantis
477
Press2019.https://doi.org/10.2991/eusflat-19.2019.20 478
23. Patowary, P., Sarmah, R., Bhattacharyya, D.K. Developing an effective biclustering technique using an
479
enhanced proximity measure.Network Modeling Analysis in Health Informatics and Bioinformatics2020,9(1),
480
art. no. 6.https://doi.org/10.1007/s13721-019-0211-7 481
24. Saini, N., Saha, S., Soni, C., Bhattacharyya, P. Automatic evolution of bi-clusters from microarray data
482
using self-organized multi-objective evolutionary algorithm. Applied Intelligence2020,50(4), 1027–1044.
483
https://doi.org/10.1007/s10489-019-01554-w 484
25. Feng, C., Liu, S., Zhang, H., et al. Dimension reduction and clustering models for single-cell rna sequencing
485
data: A comparative study. International Journal of Molecular Sciences2020, 21(6), art. no. 2181. https: 486
//doi.org/10.3390/ijms21062181 487
26. Babichev, S., Taif, M.A., Lytvynenko, V. Estimation of the inductive model of objects clustering stability
488
based on the k-means algorithm for different levels of data noise.Radio Electronics Computer Science Control
489
2016,4, 54–60.https://doi.org/10.15588/1607-3274-2016-4-7 490
27. Shukla, A.K., Shukla, P., Vardhan, M. Gene selection for cancer types classification using novel hybrid
491
metaheuristics approach.Swarm and Evolutionary Computation2020,54, art. no. 100661.https://doi.org/10. 492
1016/j.swevo.2020.100661 493
28. Yuan, L.M., Sun, Y., Huang, G. Using class-specific feature selection for cancer detection with gene expression
494
profile data of platelets.Sensors (Switzerland)2020,20(5), art. no. 1528.https://doi.org/10.3390/s20051528 495
29. Marussy, K., Buza, K. SUCCESS: A new approach for semi-supervised classification of time-series.Lecture
496
Notes in Computer Science (including subseries Lecture Notes in Artificial Intelligence and Lecture Notes in
497
Bioinformatics)2013,7894 LNAI (PART 1), 437–447.https://doi.org/10.1007/978-3-642-38658-9_39 498
30. Buza, K. Classification of gene expression data: A hubness-aware semi-supervised approach. Computer
499
Methods and Programs in Biomedicine2016,127, 105–113.https://doi.org/10.1016/j.cmpb.2016.01.016 500
31. Varkonyi, D.T., Buza, K. Extreme learning machines with regularization for the classification of gene
501
expression data.CEUR Workshop Proceedings2019,2473, 99–103.
502
32. Glowacz, A., Glowacz, Z. Recognition of images of finger skin with application of histogram, image filtration
503
and K-NN classifier.Biocybernetics and biomedical engineering2016,36(1), 95–101.https://doi.org/10.1016/j. 504
bbe.2015.12.005 505
33. Tkachenko, R., Doroshenko, A., Izonin, I., Tsymbal, Y., Havrysh, B. Imbalance data classification via
506
neural-like structures of geometric transformations model: Local and global approaches. Advances in
507
Intelligent Systems and Computing,2019,754, 112–122.https://doi.org/10.1007/978-3-319-91008-6_12 508
34. Izonin, I., Trostianchyn, A., Duriagina, Z., et al. The combined use of the wiener polynomial and SVM for
509
material classification task in medical implants production.International Journal of Intelligent Systems and
510
Applications,2018,10(9), 40–47.https://doi.org/10.5815/ijisa.2018.09.05 511
35. Babichev, S., Lytvynenko, V., Skvor, J., Korobchynskyi, M., Voronenko, M. Information Technology of Gene
512
Expression Profiles Processing for Purpose of Gene Regulatory Networks Reconstruction.In Proceedings of
513
the 2018 IEEE 2nd International Conference on Data Stream Mining and Processing, DSMP 2018,2018, 336–341.
514
https://doi.org/10.1109/DSMP.2018.8478452 515
36. Hausser, J., Strimmer, K. Entropy inference and the james-stein estimator, with application to nonlinear gene
516
association networks.Journal of Machine Learning Research2009,10, 1469–1484.
517
37. Calinski, T., Harabasz, J. A dendrite method for cluster analysis.Communication in statistics1974,3, 1–27.
518
38. Zhao, Q., Xu, M., Fränti, P. Sum-of-squares based cluster validity index and significance analysis. In
519
Lecture Notes in Computer Science (including subseries Lecture Notes in Artificial Intelligence and Lecture Notes in
520
Bioinformatics)2009,5495, 313–322.https://doi.org/10.1007/978-3-642-04921-7_32 521
39. Babichev, S., Lytvynenko, V., Skvor, J., Fiser, J. Model of the objective clustering inductive technology of
522
gene expression profiles based on sota and dbscan clustering algorithms.Advances in Intelligent Systems and
523
40. Dorazo, J., Carazo, J.M. Phylogenetic reconstruction using an unsupervised growing neural network that
525
adopts the topology of a phylogenetic tree. Journal of Molecular Evolution 1997, 44(2), 226–260. https: 526
//doi.org/10.1007/PL00006139 527
41. Fritzke, B. Growing cell structures a self-organizing network for unsupervised and supervised learning.
528
Neural Networks,1994,7(9), 1441–1461.https://doi.org/10.1016/0893-6080(94)90091-4 529
42. Tolles, J., Meurer, W.J. Logistic regression: Relating patient characteristics to outcomes.JAMA - Journal of the
530
American Medical Association2016,316(5), 533–534.https://doi.org/10.1001/jama.2016.7653 531
43. Pedregosa, F., Varoquaux, G., Gramfort, A., et al. Scikit-learn: Machine learning in Python.Journal of Machine
532
Learning Research2011,12, 2825–2830.
533
44. Arunachalam, A.S., Thirumurthi Raja, A., Perumal, S. Enhanced constructive decision tree classification
534
model for engineering students data. International Journal of Recent Technology and Engineering2019,8(1),
535
2414–2420.
536
45. Breiman, L. Random forests.Machine Learning2001,45(1), 5–32.https://doi.org/10.1023/A:1010933404324 537
46. Sasaki, Y. The truth of the f-measure. InResearch Fellow2007, pp. 1–5.
538
47. Matthews, B.W. Comparison of the predicted and observed secondary structure of t4 phage lysozyme.BBA
-539
Protein Structure1975,405(2), 442–451.https://doi.org/10.1016/0005-2795(75)90109-9 540
48. Zadeh, L.A., Abbasov, A.M., Shahbazova, S.N.: Fuzzy-based techniques in human-like processing of social
541
network data.International Journal of Uncertainty, Fuzziness and Knowlege-Based Systems2015,23, 17–14.
542
49. Hou, J., Aerts, J., den Hamer, B., van Ijcken, W., et al. Gene expression-based classification of non-small cell
543
lung carcinomas and survival prediction.PLoS ONE,2010,5(4), art. no. e10312.
544
50. Kuhn, M., Wing, J., Weston, S., et al. Classification and Regression Training.https://github.com/topepo/ 545
caret/.
546
51. Kleiber, C., Zeileis, A. Applied Econometrics with R.https://cran.r-project.org/web/packages/AER/AER. 547
pdf.
548
52. Meyer, D., Dimitriadou, E., Hornik, K., et al. Misc Functions of the Department of Statistics, Probability
549
Theory Group (Formerly: E1071), TU Wien.https://cran.r-project.org/web/packages/e1071/e1071.pdf.
550
53. Ihaka, R,. Gentleman, R. R:a linguage for data analysis and graphic.Journal of Computational and Graphical
551
Statistics1996,5(3), 299–314.