EVIDENCE OF CLIMATE CHANGE IN THE MIDDLE EAST
Nada I. B. Jallo
Department of Physics, College of Science, Baghdad University, Baghdad - Iraq
ABSTRACT
Simple linear fitting of not less than fifty years monthly temperature data for thirty three weather
stations in the Middle East extracted from the HadCRUT3 database shows an interesting monthly
pattern. The fitted slope values tend to show oscillation type behaviors which are much similar to
the monthly carbon dioxide atmospheric concentration due to the global change in vegetation level.
The estimated rate of yearly temperature is also calculated.
Keywords:
Climate change, Global Warming, HadCRUT31.
INTRODUCTION
It can be argued that Intergovernmental Panel on Climate Change IPCC 2007 report (Climate,
2007) was the warning bell to the potential dangers associated with effect of increasing CO2
atmospheric concentrations on Global temperatures. Based on conclusion of huge numbers of
research articles, the report concluded that the world temperatures may rise by as much as 4-5 oC
by the end of this century. Chronic failures of world political leaders to reach agreement on how to
contain and then reduce CO2 emissions resulting from burning of fossils fuels has resulted in
atmospheric CO2 concentrations reaching the 400 ppm level for the first time in three million years
during March 2013 (http://www.esrl.noaa.gov/gmd/ccgg/trends/). This is compared with only 280
ppm level prior to the start of the industrial revolution. The effect is simple. CO2 while almost
transparent to light, it is opaque to infrared (heat) radiation. Increase in atmospheric CO2 levels will
act to increase the opaqueness of the atmosphere to infrared radiation causing the trapping of heat within the earth’s atmosphere. This is known as the “Green House effect (GW)”. Many researchers argue that many if not all of climatological changes observed in many parts of the world in recent
years are direct consequences of GW. This theory was confronted by some skeptics who argue that
these climate changes can be accommodated within the natural trends of earth climate, and there
are no conclusive evidences that they must be attributed to increasing CO2levels (Balling, 2003;
Journal of Asian Scientific Research
1149 the main concerns include anticipated changes in water resources (Easterling et al.; Arnell, 1998;
Roenberg et al., 1999; Arnell and Delaney, 2006), agricultural croup productions(Thomson et al.; Brown and Rosenberg, 1999), spread of infectious diseases (Martens et al., 1997; Ebi et al., 2005), …etc. Investigations related to the establishment of a direct relation between most recent record heat waves and high degree hurricanes in some parts the world are gaining increased interest
(Meehl and Washington, 1993; Meehl and Tebaldi, 2004).
Following the arguments surrounding the conclusions of the IPCC2007 report and the consequent Lord Russell’s inquiry findings (Russell et al., 2010), the British Metrological Office made the decision in 2010 to make all compiled world surface temperatures data freely available
for all researchers.
These data are now available under the name HadCRUT3
(http://www.cru.uea.ac.uk/cru/data/temperature/#sciref).
It is the purpose here to use the part of these data related to Middle East temperatures to
establish if there are any evidences of climate changes in this part of the world.
2.
THE DATA
(The part associated with) The Middle East monthly temperature data are extracted from the
HadCRUT3 world surface temperatures database which contains 3780 world data files. The Middle
East region is defined in this work as the geographical region enclosed within the rectangle defined
by latitudes and longitudes 20-40 North, and 35-52 East. This area includes regions from the east
cost of Mediterranean Sea reaching the west of Iran, southern parts of Turkey to the Gulf. The over
all number of data files related to this region contained in the HadCRUT3 data base belong to 72
weather stations. These were converted to Matlab data files. However, the analysis presented in this
work is based on data from 33 stations only. Stations with temperature data covering less than 50
years are not included in the analysis.
3.
DATA ANALYSIS
In order to look for any systematic trends in climate changes in the above mentioned
geographical boundary, all monthly mean temperatures
T
for every station over the availablenumber of years from that particular station for the particular month under consideration are
studied against the atmospheric year number.. Linear correlation fitting between the temperature
and year number Y is carried out by attempting to fit the data to the equation:
Y
T
(2)
and
being free fitting parameters.
, being positive, negative or zero is taken as indication that temperatures are increasing, decreasing, with time. Typical three such fits are shown in figureFigure-1. Three mean monthly temperature data samples. Circles are data points. Solid line is the result of fit to equation (1)
(a)
1151 Every fitted value of the linear regression coefficient
obtained with over 95% confidencelevel is obtained and the monthly dependence of the slope parameter is plotted against month's
number. Furthermore, each
value is considered to be a statistical event. Each station will thuscontribute 12 non weighted events to the pool of all
values deduced after assigning a properweight for each value obtained. These events are plotted on a histogram. .
Beside, restricting the analysis to stations which have more than 50 years records, the
valuenumber of events is weighted by the reciprocals of the mean of the fits residues. This ensures that
not only data sets with larger time span coverage are given larger weight, but also more scattered
data sets are given less weight.
4.
RESULTS AND DISCUSSION
The fitted values of the slope parameter
in equation (1) for each month’s set of data fromeach of the 33 weather stations considered are plotted. These 33 stations are distributed over nine
courtiers in the region. For reasons related to space considerations, results for one station from each
country are selected for presentation here. These are shown in figure (2). All other figures produced
are much similar. Including both costal and non costal locations was a consideration in this
selection. The first interesting feature observed in all plots is the seasonal variation of the rate of
the yearly temperature increases. The value of
tends to be systematically peak up during theperiod between May and August. The effect seems to be highly systematic with all other stations,
not presented here. It may be interesting to attempt to link this almost cyclic effect with the annual
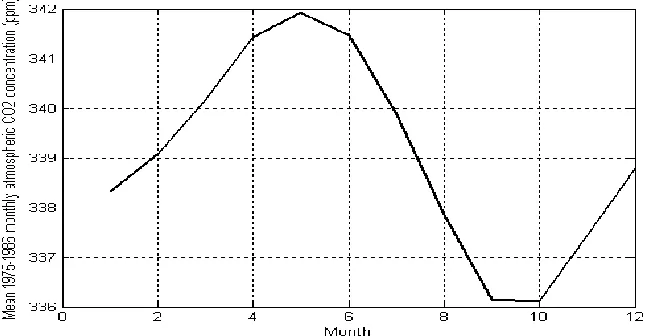
atmospheric CO2 concentration cycle which is usually attributed to changes in vegetation activity
during spring season. For such purpose, numerical CO2 monthly data for the period 1975-1986
obtained from reference (CO2) are plotted in figure (3). Apart from a time lag of about two months,
the similarity between the monthly behaviors of both
and CO2 concentration is striking. Thissimilarity may be worth further investigation with more global sets of data.
Figure -3. Atmospheric averaged monthly CO2 concentration variations for the years 1975-1986
1155 clearly indicates that the Middle East region weather is moving towards higher temperatures.
Although this is not new in its self, the final result of the overall average value of
obtained fromthis weighted histogram is
0
.
005
oC/year, with about 70% overall probability of acceptance.
This can be translated to indicate that the global temperatures in the Middle East have risen by as
much as 0.75 oC since the start of the industrial revolution. This is in good agreement with the
value of 0.076 oC/year suggested in the IPCC2007 report based on data for the whole world.
Figure-4. (a) Histogram showing the distribution of
values for all stations. (b) Distribution of probabilities of accepting the fitted values in (a)(a)
5.
CONCLUSIONS
Analysis of available historical temperature data for the Middle East region indicates that the
region has been moving towards a higher temperature climate with an average of 0.0036 oC/year.
This rate of increase, tend to show monthly trends similar to a delayed CO2 atmospheric
concentration variation. Further more detailed studies of this effect may produce a first hand strong
direct evidence of the relation between CO2 and recent year's climate changes