| FLYBOOK ECOLOGY AND EVOLUTION
Molecular Population Genetics
Sònia Casillas*,†and Antonio Barbadilla*,†,1
*Institut de Biotecnologia i de Biomedicina, andyDepartament de Genètica i de Microbiologia, Campus Universitat Autònoma de Barcelona (UAB),
08193 Cerdanyola del Vallès, Barcelona, Spain ORCID IDs: 0000-0001-8191-0062 (S.C.); 0000-0002-0374-1475 (A.B.)
ABSTRACT Molecular population genetics aims to explain genetic variation and molecular evolution from population genetics principles. Thefield was born 50 years ago with thefirst measures of genetic variation in allozyme loci, continued with the nucleotide sequencing era, and is currently in the era of population genomics. During this period, molecular population genetics has been revolutionized by progress in data acquisition and theoretical developments. The conceptual elegance of the neutral theory of molecular evolution or the footprint carved by natural selection on the patterns of genetic variation are two examples of the vast number of inspiring findings of population genetics research. Since the inception of thefield,Drosophilahas been the prominent model species: molecular variation in populations wasfirst described inDrosophilaand most of the population genetics hypotheses were tested inDrosophilaspecies. In this review, we describe the main concepts, methods, and landmarks of molecular population genetics, using the Drosophilamodel as a reference. We describe the different genetic data sets made available by advances in molecular technologies, and the theoretical developments fostered by these data. Finally, we review the results and new insights provided by the population genomics approach, and conclude by enumerating challenges and new lines of inquiry posed by in-creasingly large population scale sequence data.
KEYWORDS Drosophila; molecular population genetics; population genomics; neutral theory; distribution offitness effects; genetic draft; linked selection; Hill–Robertson interference; population multi-omics; FlyBook
TABLE OF CONTENTS
Abstract 1003
1966–2016: 50 Years of Molecular Population Genetics 1004
Drosophila as a Model Organism for Population Genetics 1005
The Data: From Empirical Insufficiency to the Present Flood of Genome Variation 1005 The allozyme era: setting the stage for the neutralist–selectionist debate 1006
The nucleotide sequence era 1007
The current population genomics era 1008
Genome variation 1008
Genome recombination 1012
Continued
Copyright © 2017 Casillas and Barbadilla doi: 10.1534/genetics.116.196493
Manuscript received October 3, 2016; accepted for publication November 8, 2016 Available freely online through the author-supported open access option.
This is an open-access article distributed under the terms of the Creative Commons Attribution 4.0 International License (http://creativecommons.org/licenses/by/4.0/), which permits unrestricted use, distribution, and reproduction in any medium, provided the original work is properly cited.
1Corresponding author: Institut de Biotecnologia i de Biomedicina and Departament de Genètica i de Microbiologia, Parc de Recerca, Mòdul B, Despatx MRB/014, Campus
CONTENTS,continued
The Theory: Population Dynamics of Genetic Variation 1012
The (nearly) neutral theory as the paradigm 1012
The distribution offitness effects 1014
Genetic draft as a selectionist alternative to the neutral theory 1018
Patterns of Genome Variation 1019
The inquiry power of population genomics 1019
Population genomics in Drosophila 1019
Nucleotide variation 1020
Indel variation 1020
TE variation 1020
Mapping natural selection throughout the genome 1020
Prevalence of weakly negative selection 1021
Wide evidence of adaptive evolution 1021
Idiosyncrasy of the Xchromosome: the faster-Xhypothesis 1021
Geographic differentiation and demographic history 1022
Determinants of Patterns of Genome Variation 1023
Recombination and linked selection 1023
Pervasive selection and the HRi 1023
Quantifying the adaptive potential of a genome 1024
Population Genomics Challenges 1025
Baseline models of genome variation 1025
The HRi block as the unit of selection 1025
Positive selection and adaptation 1026
Nonequilibrium theory 1026
Nevs. Nc 1026
The Future: Toward a Population -Omics Synthesis 1026
1966–2016: 50 Years of Molecular Population Genetics
H
ALF a century ago, two seminal articles inaugurated the field of molecular population genetics. Applying the tech-nique of protein gel electrophoresis to several allozyme loci, the first measures of genetic variation in the species Drosophilapseudoobscura(Lewontin and Hubby 1966) and humans (Harris
1966) were provided. At this time, population genetics had built an extensive and sophisticated theoretical foundation; integrating principles of Mendelian inheritance with forces affecting changes in allele frequency in populations that sought to formalize the Darwinian view that biological evolution is a population process by which genetic variation within species is transformed into genetic variation between species (Mayr 1963). But because of the technical inability to measure genetic variation for all but a few loci, this exhaustive formal exercise occurred in a virtual factual vacuum. With almost no data, models were totally general; unre-stricted by the contingent world (Lewontin 1974). After decades of struggling to measuring genetic variation, copious data on elec-trophoretic variation initiated at last the necessary dialog between data and theory. Since then, this dialog has continued to catalyze the main advances in thefield.
How far are we today, 50 years later? The genomic revo-lution has generated detailed population genetic data, far exceeding the dreams of any premolecular population genet-icist. Big data samples of complete genome sequences of many individuals from natural populations of many species have transformed population genetics inferences on samples of loci to population genomics: the analysis of genome-wide patterns of DNA variation within and between species. Catalogs of nearly all polymorphic variants are currently available for model species such asD. melanogaster(Langleyet al.2012; Mackayet al.2012; Huanget al.2014; Grenieret al.2015;
Lacket al.2015), yeasts (Litiet al.2009; Stropeet al.2015),
Arabidopsis thaliana (Caoet al.2011; Ganet al.2011; 1001
Genomes Consortium 2016),Caenorhabditis elegans(Andersen
et al.2012), as well as humans (Durbinet al.2010; 1000
(SNPs and indels) have been described (Huanget al.2014) to date. What is the power of these millions of segregating variants in the genomes of species to solve thefield’s great obsession (Gillespie 1991) about the evolutionary forces causing the ob-served patterns of genetic variation? Is this vast information all we need to explain molecular evolution?
In his influential book,The Genetic Basis of Evolutionary
Change, Lewontin (1974) assesses thefirst impact of
electro-phoretic variation data on the body of theory developed previ-ously. He wonders if the population genetics machinery is empirically insufficient, no more because of lack of data, but because of an incompleteness in the theoretical parameters that made it incapable of accounting for the observations. The ad-vances in molecular evolutionary genetics have subsequently enriched thefield with many new concepts, terms, processes, molecular techniques, and statistical and computational meth-ods. But remarkably, the fundamental forces of evolution estab-lished by the founding fathers of thefield (Fisher 1930; Wright 1931; Haldane 1932; Kimura 1955), namely natural selection, genetic drift, mutation, recombination, and geneflux, are still the essential explanatory factors used for understanding the population genetic basis of evolutionary change (Lynch 2007; Charlesworth 2010).
In the next pages, we focus largely on what we have learned about the intragenomic component of genetic variation; showing that genome variation at a given genomic region depends not only on the sequence functional class (synony-mous, nonsynony(synony-mous, intron, etc.) but also on the under-lying genomic context such as level of recombination or mutation rate, gene density, chromosomal region, or chromo-some associated with such a region. We first describe the main landmarks along the 50 years of molecular population genetics. For clarity, we consider separately advances in data acquisition and theory development. We describe the different genetic data sets that the successive molecular technologies have made available, and then the theoretical contributions and improvements fostered by the data. The relevance of
Drosophila in this journey will be emphasized. Finally, we
review the results and new insights provided by the popu-lation genomics approach, followed by the enumeration of challenges and new lines of inquiry posed by the present population genomics (multi-omics) momentum.
Drosophila as a Model Organism for Population Genetics
First introduced as a research tool in the early 20th century (Morganet al.1915; Muller 1927),Drosophilahas played a crucial role in allfields of genetic analysis, including ecology, speciation, development, and also population genetics (Powell 1997). Following early studies of chromosomal inversion poly-morphisms (Dobhansky 1937; Dobzhansky and Sturtevant 1938), Drosophilists pioneered the initial surveys of molecular genetic variation (see next section) and Drosophila was used extensively to study the forces shaping genetic variation in nat-ural populations (Ayalaet al.1974; Singh and Rhomberg 1987).
As the third eukaryote and the second metazoan to be fully sequenced,D. melanogasterwas chosen to explore the appli-cation of complete genome sequencing by whole-genome shotgun in eukaryotic genomes (Rubin 1996; Adams et al.
2000). More recently, the development of high-throughput sequencing technologies allowed the sequencing of .200 complete genomes ofD. melanogasterfrom a population sam-pled in Raleigh (RAL), NC [Drosophila Genetic Reference Panel (DGRP)] (Mackay et al. 2012; Huang et al. 2014). Following this study, 100s of individuals from many other populations were sequenced [DrosophilaPopulation Geno-mics Project (DPGP); Global diversity lines] (Langleyet al.
2012; Grenieret al.2015; Lacket al.2015) and today.1000 complete genomes are available for D. melanogaster (Lack
et al. 2015, 2016) (Figure 1). In addition, several other
Drosophilaspecies have been completely sequenced and used
for comparative genomic studies (Drosophila 12 Genomes Consortiumet al.2007; Haleset al.2015). Population geno-mic resources are available for 27 lines ofD. simulans(Begun
et al.2007; Rogerset al.2014), 21 lines ofD. yakuba(Begun
et al.2007; Rogerset al.2014), and 117 pooled samples ofD.
mauritiana(Nolteet al.2013; Garriganet al.2014) (Figure
1). The availability of these sequence data provides the fly lineage with a unique resource on which to test the molecular population genetics hypotheses and eventually understand the evolutionary dynamics of genetic variation in populations.
The Data: From Empirical Insufficiency to the Present Flood of Genome Variation
A primary concept of the modern evolutionary synthesis period (1930s–1960s) was the primary role of natural selec-tion to explain evoluselec-tion (Mayr and Provine 1980), while largely ignoring effects of genetic drift. Two different views emerged. The so-calledclassical hypothesissupported the role of natural selection in purging the population of most genetic variation, predicting that most loci are homozygous for the wild-type allele (Muller and Kaplan 1966). Thebalance
hy-pothesispostulated that natural selection actively maintained
high levels of genetic diversity in populations, and that a large proportion of loci are therefore polymorphic (Dobzhansky 1970; Ford 1971). Note that under the second hypothesis, evolution in the face offluctuations in environmental con-ditions over time may be rapid since selection can act on existing variants; while under thefirst hypothesis evolution may be constrained by the availability of new advantageous mutations.
sequencing of complete genomes (Begunet al.2007; Langley
et al.2012; Mackayet al.2012). In this section we describe
these three stages to survey molecular genetic variation dur-ing the last 50 years, which range from the empirical insuffi -ciency of allozymes to the presentflood of genome variation data.
The allozyme era: setting the stage for the neutralist– selectionist debate
Population genetics entered the molecular age with the pub-lication of seminal articles describing electrophoretically de-tectable variation—or allozymes (i.e., proteins differing in electrophoretic mobility as a result of allelic differences in the protein sequence, which ultimately result from the exis-tence of variation in the corresponding DNA sequence)—in
D. pseudoobscura (Lewontin and Hubby 1966) and also in
humans (Harris 1966). A few dozen different soluble proteins were studied in 100s of species, mostly enzymes with well-understood metabolic roles. Genetic diversity was measured
in two ways: the average proportion of loci that are hetero-zygous in an individual [heterozygosityorgene diversity(H)], and the average proportion of loci that are polymorphic in the population [gene polymorphism(P)]. The results of such elec-trophoretic surveys revealed a large amount of genetic vari-ation in most populvari-ations (Lewontin 1974, 1985), much more than had been predicted, and seemed to unequivocally support the balance rather than the classical hypothesis. Spe-cifically, 43% of loci were found to be polymorphic in
Dro-sophila, and H is 12%. Furthermore, levels of genetic
population genetics and the neutral theory was derived to account for molecular evolution [Box 1; see The (nearly)
neutral theory as the paradigm], setting the stage for the
long-lasting neutralist vs. selectionist debate. While large populations are expected to accumulate more variation, the small differences in the levels of genetic diversity seen among distant species were not sufficient to explain the large differ-ences in their population sizes (Lewontin 1974). In particu-lar, even though the total range in population sizes over all species exceeds 20 orders of magnitude (Lynch 2006), allo-zyme diversity varies by less than a power of 4 (Bazinet al.
2006), an observation which is often known as Lewontin’s paradox (Lewontin 1974).
While protein electrophoresis was extensively used to perform large-scale surveys of genetic diversity in a wide range of species (Nevo et al. 1984), the limitations of the method were well known. First, allozyme polymorphisms can only be observed for DNA variation that alters the amino acid sequence. Second, only those amino acid changes that affect the mobility of a protein in a gel (mostly associated with charge changes) can be detected by electrophoresis, and these represent only about one-fourth of all possible mu-tational changes that lead to an amino acid substitution (Lewontin 1991). Ohta and Kimura (1973) proposed the charge-state model (or stepwise mutation model) to explain the results of electrophoretic studies while accommodating these limitations of allozyme markers, and this model was further followed by some extensions (Brown et al. 1981). However, Barbadilla et al.(1996) showed that if charge is considered synonymous with electrophoretic mobility, as in the charge-state model, then we expect, for almost any given scenario, a symmetrical bell-shaped distribution of mobilities where charge classes with the highest frequency have an in-termediate mobility. They conclude that the commonly ob-served frequency pattern of electrophoretic variants is purely a consequence of statistical relations and conveys no infor-mation about the underlying evolutionary forces. Also, they show that the discriminatory power of electrophoresis to detect protein variation is a decreasing function of the number of segregating sites. In summary, and given the lim-itations of protein electrophoresis to measure genetic vari-ation, Lewontin (1991) assesses this initial stage in the analysis of genetic diversity not only as amilestoneof evo-lutionary genetics, representing the initial stage in a journey to survey genetic variation in the populations; but also as a frustrating millstone because the boom of electrophoresis swamped the previous diversity of empirical work in evolu-tionary genetics, and because of the lack offit of empirical data to the evolutionary genetics theory. It was apparent, then, that the direct study of DNA variation would be nec-essary to answer the questions that population genetics had already posed. In the words of Lewontin (1991):“Those of us who now study DNA sequence variation believe that at this level we will resolve the problems generated by electro-phoretic studies and thatfinally, because the structure of the observation of DNA sequences is qualitatively different from
observations of amino acid variation, that the ambiguities will disappear.”
The nucleotide sequence era
Before the invention of PCR amplification and automated Sanger sequencing, thefirst surveys of DNA sequence varia-tion were done in the 1980s using restricvaria-tion enzymes to detect variation at restriction sites; an approach that was extensively used in Drosophila(Langley et al. 1982, 1988; Aquadro et al.1986; Langley and Aquadro 1987; Schaeffer
et al.1988; Miyashita and Langley 1988; Aguadéet al.1989b,
1992; Stephan and Langley 1989). A large number of phylo-geographic studies were published, often analyzing one or several mitochondrial DNA (mtDNA) loci (Avise et al.
1987). Restriction mapping was the starting point for the development of new summary statistics to represent genetic diversity on DNA sequences, including thenucleotide site
di-versity(p), the equivalent ofHfor nucleotide sites (Nei and
Li 1979). Furthermore, studies inDrosophilauncovered an intriguing pattern: regions of the genome with low recombi-nation have very low levels of genetic variability (Aguadé
et al. 1989a; Stephan and Langley 1989; Berryet al.1991;
Begun and Aquadro 1992; Martin-Campos et al. 1992; Stephan and Mitchell 1992; Langley et al. 1993). Begun and Aquadro (1992) published a landmark study reporting one of the most far-reaching observations in molecular evo-lution: the local rate of recombination is strongly positively correlated to the level of genetic variation. A mechanistic relationship between recombination and mutation seemed an obvious explanation. If recombination is indeed muta-genic, then regions of low recombination should also have a low mutation rate, and hence lower interspecific divergence according to the neutral theory (K=m0, see below). How-ever, levels of divergence were shown to be independent of local recombination rates, and thus the correlation between recombination rate and levels of polymorphism was attrib-uted to thefixation of advantageous mutations and the asso-ciated hitchhiking effect. The lower the recombination of a region, the larger the hitchhiking effect, and thus the reduc-tion of linked neutral variareduc-tion; accounting for the observed correlation. This hitchhiking hypothesis seriously jeopar-dized the Kimura’s neutral theory of molecular evolution
(see Genetic draft as a selectionist alternative to the neutral
theoryandRecombination and linked selection).
either coding or noncoding regions that had been previously invisible to protein electrophoresis. Apart from these SNP variants, four indel polymorphisms and two homopolynu-cleotide runs were found outside the coding region of the gene. These data uncovered an unforeseen wide spectrum of different types of genetic variants segregating in popula-tions, and supported the view that most amino acid changes were selectively deleterious. Years after Kreitman’s revolu-tionary study, the advent of automated Sanger sequencing brought new variation data for dozens of genes in several species, including Drosophila(Powell 1997). These studies showed that levels of variation at silent sites vary among different taxa by less than a factor of 10 (compared to allo-zymes, which vary by,104; see previous section), that SNPs outnumber all kinds of structural variants, and that transpos-able element (TE) insertions segregate as low-frequency polymorphisms. More recently, Leffleret al.(2012) have es-timated genetic diversity levels by compiling polymorphism data across 167 species in 14 phyla, determining that auto-somal nucleotide diversity varies by only two to three orders of magnitude, compared to the population census (Nc, the actual number of individuals in a population), which proba-bly varies by a factor of 108–1010. Among the different eco-logical factors and life-history traits, reproductive strategy has been found to be strongly correlated with the genetic diversity of species (Leffler et al. 2012; Romiguier et al.
2014).
The data from resequencing studies are homologous and independent sequences (or haplotypes) sampled in a DNA region of interest (Kreitman 1983). InD. melanogaster, hap-lotypes can be obtained directly because we can extract single chromosomes using balancers, while they need to be inferred in other outbreeding organisms. The availability of these hap-lotypic sequences allowed the development of more powerful statistical metrics to quantify variation than did the previous generation of allozyme data (Table 1). On the one hand, one can estimate nucleotide diversity in the region by taking each nucleotide site as an independent unit (one-dimensional measures of variation). However, tests that only use informa-tion on the frequency distribuinforma-tion of segregating sites are clearly ignoring a significant source of information: associa-tions between segregating sites, or the haplotype structure of the sample. It has been shown that nearby nucleotide sites are not independent of each other; instead, alleles are clus-tered in blocks from 100–150 bp (Huanget al.2014; Grenier
et al.2015) to 2 kb in theDrosophilagenome (Miyashita and
Langley 1988; Langleyet al.2012), and.100 kb in the hu-man genome (1000 Genomes Project Consortium 2015). This haplotype structure is influenced by recombination as well as selective and demographic forces, and it can be de-scribed by the use of multi-dimensional measures of genetic variation, such as estimators of linkage disequilibrium (LD) (Table 1). These multi-dimensional diversity measures pro-vide key information on the history and evolution of a DNA region, including the effective recombination rater=4Ner underlying the region (whereNeis the effective population
size and r is the recombination rate per locus) (Table 1) (Hudson 1987; Nordborg and Tavare 2002; McVean et al.
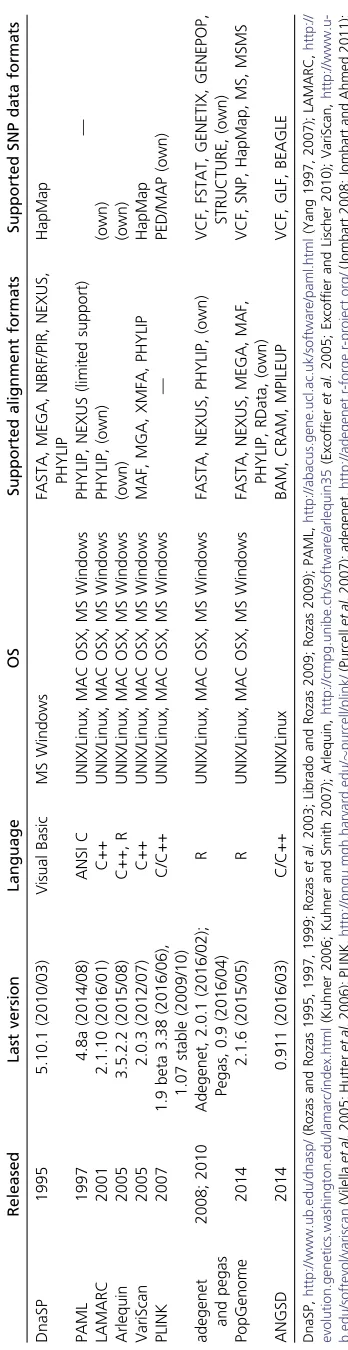
2004). Both one-dimensional and multi-dimensional diver-sity components are necessary for a complete description of sequence variation, and thus haplotypic data provide the maximum level of genetic resolution to make inferences about evolutionary history and about the evolutionary pro-cess. With all this rich data in hand and an extensive arsenal of population genetics statistics already available (Table 1), different software applications were developed to automate the data analyses, including DnaSP (Rozas and Rozas 1995) and PAML (Yang 1997), which are still widely used software packages for population genetics (Table 2).
After.30 years of surveys of nucleotide variation in either particular loci (Kreitman 1983; Hassonet al.1998; Balakirev and Ayala 2003a,b, 2004) or in 100s of genomic regions at a time (Andolfatto 2007; Hutteret al.2007), very large num-bers of sequences in many genes and species accumulated in the databases (Clarket al.2016), and tools were developed to make use of these publicly available data to characterize genetic diversity at a large scale (Casillas and Barbadilla 2004, 2006; Casillaset al.2005). However, even the largest compilations of surveys of genetic diversity were limited by the fact that they showed genetic diversity in particular sam-pled regions of the genome rather than providing unbiased genome-wide measurements. It was clear that the next nat-ural step toward the characterization of genetic variation would be the resequencing of complete genomes.
The current population genomics era
Genome variation:Even though the term population geno-mics started to appear in the literature from the late 1990s in the context of large-scale polymorphism studies at multiple genomic loci (Blacket al.2001; Luikartet al.2003), the pure sense of the term refers to the resequencing and analysis of complete genomes within and/or between populations. While this was economically prohibitive by Sanger se-quencing in most cases, Drosophilists again pioneered thefield by publishing one of thefirst large-scale popula-tion genomics studies inD. simulans(Begun et al.2007) (note that in this case the lines had diverse origin, which implies that this was not a “pure” population genomics study in the sense that the individuals studied did not come from a single population).
During the last decade, the development of next generation sequencing (NGS) technologies (Metzker 2010; Goodwin
et al.2016) has allowed the deciphering of complete genome
sequences of 100s of individuals in many populations of
Dro-sophila(Langleyet al.2012; Mackayet al.2012; Huanget al.
2014; Lacket al.2015), as well as 10s to 1000s of individuals of other species (Durbinet al.2010; Caoet al.2011; Ganet al.
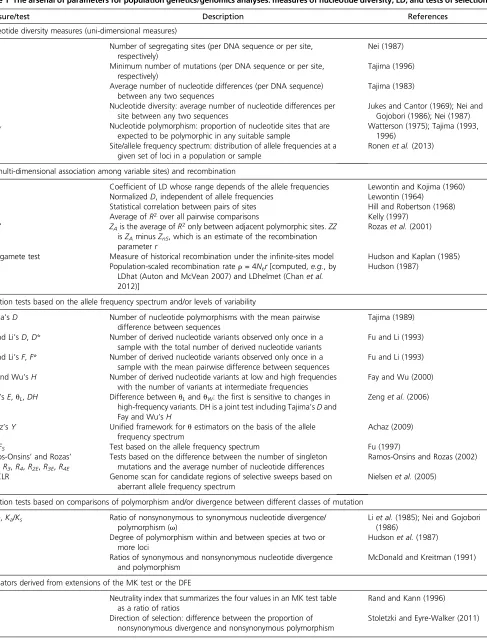
Table 1 The arsenal of parameters for population genetics/genomics analyses: measures of nucleotide diversity, LD, and tests of selection
Measure/test Description References
Nucleotide diversity measures (uni-dimensional measures)
S,s Number of segregating sites (per DNA sequence or per site,
respectively)
Nei (1987)
H,h Minimum number of mutations (per DNA sequence or per site,
respectively)
Tajima (1996)
k Average number of nucleotide differences (per DNA sequence)
between any two sequences
Tajima (1983)
p Nucleotide diversity: average number of nucleotide differences per
site between any two sequences
Jukes and Cantor (1969); Nei and Gojobori (1986); Nei (1987)
u,uW Nucleotide polymorphism: proportion of nucleotide sites that are
expected to be polymorphic in any suitable sample
Watterson (1975); Tajima (1993, 1996)
SFS Site/allele frequency spectrum: distribution of allele frequencies at a
given set of loci in a population or sample
Ronenet al.(2013)
LD (multi-dimensional association among variable sites) and recombination
D Coefficient of LD whose range depends of the allele frequencies Lewontin and Kojima (1960)
D9 NormalizedD, independent of allele frequencies Lewontin (1964)
R,R2 Statistical correlation between pairs of sites Hill and Robertson (1968)
ZnS Average ofR2over all pairwise comparisons Kelly (1997)
ZA/ZZ ZAis the average ofR2only between adjacent polymorphic sites.ZZ
isZAminusZnS, which is an estimate of the recombination
parameterr
Rozaset al.(2001)
Four-gamete test Measure of historical recombination under the infinite-sites model Hudson and Kaplan (1985)
r Population-scaled recombination rater=4Ner[computed,e.g., by
LDhat (Auton and McVean 2007) and LDhelmet (Chanet al. 2012)]
Hudson (1987)
Selection tests based on the allele frequency spectrum and/or levels of variability
Tajima’sD Number of nucleotide polymorphisms with the mean pairwise
difference between sequences
Tajima (1989)
Fu and Li’sD,D* Number of derived nucleotide variants observed only once in a sample with the total number of derived nucleotide variants
Fu and Li (1993)
Fu and Li’sF,F* Number of derived nucleotide variants observed only once in a sample with the mean pairwise difference between sequences
Fu and Li (1993)
Fay and Wu’sH Number of derived nucleotide variants at low and high frequencies with the number of variants at intermediate frequencies
Fay and Wu (2000)
Zeng’sE,uL,DH Difference betweenuLanduW: thefirst is sensitive to changes in
high-frequency variants. DH is a joint test including Tajima’sDand Fay and Wu’sH
Zenget al.(2006)
Achaz’sY Unified framework foruestimators on the basis of the allele frequency spectrum
Achaz (2009)
Fu’sFS Test based on the allele frequency spectrum Fu (1997)
Ramos-Onsins’and Rozas’ R2,R3,R4,R2E,R3E,R4E
Tests based on the difference between the number of singleton mutations and the average number of nucleotide differences
Ramos-Onsins and Rozas (2002)
CL, CLR Genome scan for candidate regions of selective sweeps based on
aberrant allele frequency spectrum
Nielsenet al.(2005)
Selection tests based on comparisons of polymorphism and/or divergence between different classes of mutation
dN/dS,Ka/Ks Ratio of nonsynonymous to synonymous nucleotide divergence/
polymorphism (v)
Liet al.(1985); Nei and Gojobori (1986)
HKA Degree of polymorphism within and between species at two or
more loci
Hudsonet al.(1987)
MK Ratios of synonymous and nonsynonymous nucleotide divergence
and polymorphism
McDonald and Kreitman (1991)
Estimators derived from extensions of the MK test or the DFE
NI Neutrality index that summarizes the four values in an MK test table
as a ratio of ratios
Rand and Kann (1996)
DoS Direction of selection: difference between the proportion of
nonsynonymous divergence and nonsynonymous polymorphism
Stoletzki and Eyre-Walker (2011)
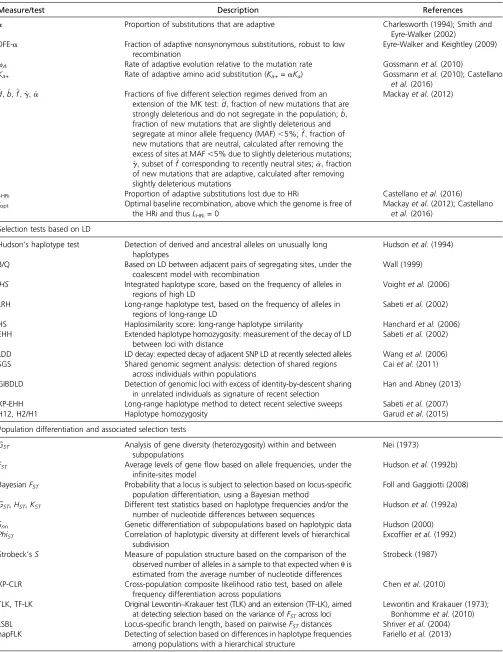
Table 1,continued
Measure/test Description References
a Proportion of substitutions that are adaptive Charlesworth (1994); Smith and
Eyre-Walker (2002)
DFE-a Fraction of adaptive nonsynonymous substitutions, robust to low
recombination
Eyre-Walker and Keightley (2009)
vA Rate of adaptive evolution relative to the mutation rate Gossmannet al.(2010)
Ka+ Rate of adaptive amino acid substitution (Ka+=aKa) Gossmannet al.(2010); Castellano
et al.(2016) ^
d;^b;^f;^g;^a Fractions offive different selection regimes derived from an extension of the MK test:^d;fraction of new mutations that are strongly deleterious and do not segregate in the population;b^; fraction of new mutations that are slightly deleterious and segregate at minor allele frequency (MAF),5%;^f;fraction of new mutations that are neutral, calculated after removing the excess of sites at MAF,5% due to slightly deleterious mutations; ^
g;subset of^f corresponding to recently neutral sites;a^;fraction of new mutations that are adaptive, calculated after removing slightly deleterious mutations
Mackayet al.(2012)
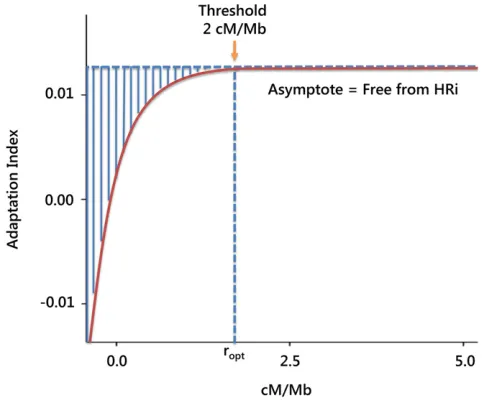
LHRi Proportion of adaptive substitutions lost due to HRi Castellanoet al.(2016)
ropt Optimal baseline recombination, above which the genome is free of
the HRi and thusLHRi= 0
Mackayet al.(2012); Castellano et al.(2016)
Selection tests based on LD
Hudson’s haplotype test Detection of derived and ancestral alleles on unusually long haplotypes
Hudsonet al.(1994)
B/Q Based on LD between adjacent pairs of segregating sites, under the
coalescent model with recombination
Wall (1999)
iHS Integrated haplotype score, based on the frequency of alleles in
regions of high LD
Voightet al.(2006)
LRH Long-range haplotype test, based on the frequency of alleles in
regions of long-range LD
Sabetiet al.(2002)
HS Haplosimilarity score: long-range haplotype similarity Hanchardet al.(2006)
EHH Extended haplotype homozygosity: measurement of the decay of LD
between loci with distance
Sabetiet al.(2002)
LDD LD decay: expected decay of adjacent SNP LD at recently selected alleles Wanget al.(2006)
SGS Shared genomic segment analysis: detection of shared regions
across individuals within populations
Caiet al.(2011)
GIBDLD Detection of genomic loci with excess of identity-by-descent sharing
in unrelated individuals as signature of recent selection
Han and Abney (2013)
XP-EHH Long-range haplotype method to detect recent selective sweeps Sabetiet al.(2007)
H12, H2/H1 Haplotype homozygosity Garudet al.(2015)
Population differentiation and associated selection tests
GST Analysis of gene diversity (heterozygosity) within and between
subpopulations
Nei (1973)
FST Average levels of geneflow based on allele frequencies, under the
infinite-sites model
Hudsonet al.(1992b)
BayesianFST Probability that a locus is subject to selection based on locus-specific
population differentiation, using a Bayesian method
Foll and Gaggiotti (2008)
GST,HST,KST Different test statistics based on haplotype frequencies and/or the
number of nucleotide differences between sequences
Hudsonet al.(1992a)
Snn Genetic differentiation of subpopulations based on haplotypic data Hudson (2000)
PhiST Correlation of haplotypic diversity at different levels of hierarchical
subdivision
Excoffieret al.(1992)
Strobeck’sS Measure of population structure based on the comparison of the
observed number of alleles in a sample to that expected whenuis estimated from the average number of nucleotide differences
Strobeck (1987)
XP-CLR Cross-population composite likelihood ratio test, based on allele
frequency differentiation across populations
Chenet al.(2010)
TLK, TF-LK Original Lewontin–Krakauer test (TLK) and an extension (TF-LK), aimed at detecting selection based on the variance ofFSTacross loci
Lewontin and Krakauer (1973); Bonhommeet al.(2010)
LSBL Locus-specific branch length, based on pairwiseFSTdistances Shriveret al.(2004)
hapFLK Detecting of selection based on differences in haplotype frequencies
among populations with a hierarchical structure
amount and accuracy of the data. We now need to deal with millions or billions of short sequencing reads that contain a relatively high proportion of erroneous nucleotides, and bio-informatics has become essential in addressing the specific needs of all the steps from data acquisition, quality checking, and analysis, as well as storage and representation. Specifi -cally, even though the statistics to measure genetic variation have remained basically the same (Table 1), the availability of such massive data collections has obliged the development of new data formats and methods to be able to preprocess the data (i.e., assemble or map the sequences against a reference and call nucleotide polymorphisms), to manage and represent huge amounts of nucleotide variation data, as well as to deal with new problems of fragmented, noisy data, including missing nu-cleotides (i.e., regions of the genome not sequenced in one or more individuals, which implies that the sample size varies across the genome) or sequencing errors (i.e., incorrectly typed nucleotides) (Chaisson et al. 2015).The variant call format (VCF) has emerged as the de facto standard to represent whole-genome variation data (Daneceket al.2011), although whole-genome alignment formats are also used as input to pop-ulation genomics analyses, including compressed binary align-ment map (BAM) files. Table 2 compiles a selection of the population genetics/genomics software developed from the re-lease of DnaSP two decades ago (Rozas and Rozas 1995), with newly developed software offering solutions to deal with the complexities and data types of the current genomics era.
The whole-genome sequencing of pools of individuals (Pool-seq) has recently emerged as an approach that provides population genomics data at considerably lower costs than the resequencing of separate individuals (Schlöttereret al.2014). With the availability of custom-tailored software tools, Pool-seq gives reasonably reliable SNP calls while dropping both sequencing and library preparation costs. Some limitations of Pool-seq include the unequal representation of individuals in small pools, the more difficult detection of sequencing or alignment errors, or the inability to provide haplotype or LD information above the read length (Schlötterer et al.
2014). Pool-seq has been applied toDrosophilato study the genome-wide patterns of polymorphism and its relationship with recombination (Nolteet al. 2013), to characterize the genomic distribution and population frequencies of TEs
(Kofler et al.2012), and to detect selective sweeps (Nolte
et al. 2013), among others. Other approaches based on
NGS that have been designed to reduce the costs of rese-quencing populations include exome serese-quencing (Warr
et al. 2015) and restriction site-associated DNA sequencing
(Davey and Blaxter 2010; Andrews et al. 2016), although both strategies give biased representations of polymorphisms in the genome (polymorphisms in transcribed regions or in restriction sites, respectively).
All in all, while the main aim of population genomics is still the description and interpretation of genetic variation within and between populations (Lewontin 2002), the technological approaches of genetic diversity studies have revolutionized thefield.
Genome recombination:In parallel with the growing amount of population genomics data, increasingly more detailed es-timates of the pattern of recombination rate along the genome are being provided. Fine-scale recombination estimates are essential not only to understand the molecular mechanism underlying variation in recombination but also to gain precise knowledge about the relationships between recombination and population genetics parameters to infer its relevance on genome evolution. The ability to detect linked selection, for example, depends crucially on the variance of the recombi-nation rate across a genome.
InD. melanogaster, two new high-resolution
recombina-tion estimates have recently been added to the classical coarse recombination map based on genetic crosses (Fiston-Lavier et al. 2010). Thefirst is a statistical approach that infers the historical population recombination parameter, r=4Ner, from LD patterns at multiple sites across the genome (Hudson 1987). Numerous sophisticated and computationally intensive methods have been developed for estimatingr(Lin
et al.2013). The software LDhat (McVeanet al.2002, 2004;
Auton and McVean 2007) scales well to large data sets and it has been applied to estimate recombination rates in humans (McVean et al. 2004; Myerset al.2005; Frazer et al. 2007; Durbinet al.2010),Drosophila(Langleyet al.2012), and other species (Johnson and Slatkin 2009; Tsai et al.2010; Auton
et al. 2012; Axelssonet al.2012). LDhat was developed in
the context of patterns of genome variation and recombination in humans. However, theDrosophilagenome contains a much higher density of SNPs and registers higher recombination rates. The model underlying LDhat assumes a neutrally evolv-ing population of constant size. Contrary to humans, where the footprints of positive selection are rather sparse (Hernandez
et al.2011),Drosophilagenomes undergo rampant adaptation
(see section Determinants of Patterns of Genome Variation), which could invalidate the inferences of recombination ofr based on LDhat (Reed and Tishkoff 2006; Stephanet al.2006). For this reason, Chanet al.(2012) proposed a new computa-tional method, LDhelmet, for estimatingfine-scale recombina-tion rates in Drosophila, which has shown to be robust to the effects of natural selection. LDhelmet has been applied to Langleyet al.’s (2012) genome variation data ofD.
mel-anogasterto obtain afine-scale recombination map of the
genome (Chanet al.2012).
Using an ingenious technique which integrates the power of classical genetics with NGS, Comeronet al.(2012) achieved thefirst integrated high-resolution description of the recombi-nation patterns of both intragenomic and population variation. Recombinant advanced intercross lines (RAIL) were generated from 8 crosses among 12 wild-derived lines. RAIL females were individually crossed to D. simulans and the D.
mela-nogasterhaploid genome of single hybrid progeny was inferred
using bioinformatics. A total of .100,000 recombination events at a resolution down to 2 kb were reported, distinguish-ing between crossdistinguish-ing over (CO) and gene conversion (GC) events. CO rates exhibit highly punctuated variation along the chromosomes, with hot and cold spots, while GC rates
are more uniformly distributed. This resource has become an essential data set for further population genetics studies deal-ing with recombination in this species (Campos et al.2014; Comeron 2014; Huanget al.2014; Kaoet al.2015; Castellano
et al.2016).
All three kinds of maps show patterns of recombination at different scales, showing substantial variation in different regions of the genome depending on the scale. Broad-scale maps of recombination give an overview of the distribution of recombination along each arm (Myerset al.2005); while at thefine-scale recombination rate, variation has been shown to be widespread throughout the human andD. melanogaster
genomes, across all chromosomes, and among populations. Recombination events cluster in narrow hot spots of around 2 kb (McVean et al.2004; Myers et al. 2005; Frazeret al.
2007; Comeronet al.2012). Fine-scale analyses relating se-lection and linkage implicitly assume that the recombination map is afixed genome property. Consequently, linked selec-tion could be obscured if polymorphism from one species is analyzed with recombination rates calculated from a differ-ent species (Cutter and Payseur 2013).
Recombination estimates of Fiston-Lavieret al.(2010) and Comeronet al.(2012) are integrated into theD. melanogaster
recombination rate calculator (http://petrov.stanford.edu/ cgi-bin/recombination-rates_updateR5.pl).
The Theory: Population Dynamics of Genetic Variation
The (nearly) neutral theory as the paradigm
reproduction (the so-called Wright–Fisher model), the strength of genetic drift is inversely proportional toNc. However, real populations typically depart from the Wright–Fisher assump-tions in several respects; hence the concept of effective popu-lation size (Ne), the size of the idealized Wright–Fisher population that would show the same amount of genetic di-versity or other parameters of interest as the actual population. By formulating a revolutionary new concept, Kimura’s neutral theory encapsulates molecular evolution in one of the most elegant mathematical expressions of science:
K¼m0 (Box 1). This simple equation combines the three levels of variation from its origin to its substitution in the population [mutation (individual level), polymorphism (pop-ulation level), and divergence (species level)] in the same unifying framework. If variants are neutral, the population level is irrelevant to molecular evolution, because the evolu-tionary rate depends on the mutational rate only; intrapop-ulation polymorphism is just a random walk of variants in their process tofixation or loss. The linear accumulation of substitutions over time predicted by the neutral theory is the basis of the molecular clock hypothesis, which considers that
the number of substitutions among divergent sequences is a linear function of their divergence times.
A serious challenge posed to Kimura’s neutral theory was that rates of protein evolution are proportional to absolute time, in years, and not to generation time. Noting that pop-ulation size is generally inversely proportional to generation time, Tomoko Ohta refined Kimura’s neutral theory by intro-ducing a new class of mutation: nearly neutral mutations (Ohta 1973). Theirfitness lies in the interval between Kimu-ra’s strictly neutral mutations and strongly deleterious muta-tions, and they might account for an important fraction of all mutations (Figure 2B). Ohta’s (1973) nearly neutral theory predicts that nearly neutral mutations are mostly eliminated by natural selection in large populations, but that a substan-tial fraction of them behave as effectively neutral and are randomlyfixed in small populations. As a result of this pro-cess, the strength of purifying selection acting on slightly deleterious mutations and the generation time effect com-pensate, and protein evolution is fairly insensitive to genera-tion time, contrary to what happens in Kimura’s strictly neutral DNA. In the early 1990s, Ohta developed a model that included both slightly deleterious and slightly beneficial mutations (Ohta 1972; Ohta and Gillespie 1996) (Figure 2B), which predicted the following dynamics in the popula-tion (Li 1978):
Mutations with fitness effects much smaller in magnitude than 1/Ne(measured in the heterozygous state with the wild type, in the case of a diploid, randomly mating pop-ulation) are considered effectively neutral (Figure 3A, gray), and their fate is basically at the mercy of genetic drift.
Mutations that havefitness effects on the order of 1/Neare nearly neutral [slightly deleterious if the selection coeffi -cients is negative (Figure 3A, red), or slightly advanta-geous whens is positive (Figure 3A, light green)], they have small effects on fitness, and their fate hinges on a combination of natural selection and genetic drift. Mutations withfitness effects.1/10Neare strongly
delete-rious (if s is negative; Figure 3A, maroon) or strongly advantageous (ifsis positive; Figure 3A, dark green), and their fates are mainly determined by natural selection.
Note that in a small population, the range between21/Ne and 1/Neis larger than in a large population, and therefore there are more effectively neutral mutations. In contrast, in a large population most mutations are subject to some sort of natural selection. Therefore, the tight relationship betweens
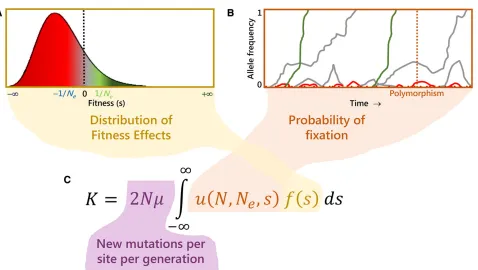
andNenicely explains why the same mutation can behave as effectively neutral in one species with a smallNe[ifsis within the range (21/Ne, 1/Ne)], while it can be subject to selection in another species with a largeNe[becausesis outside the range (21/Ne, 1/Ne)]. In particular, asNeincreases, genetic drift becomes less important in determining the fate of new mutations, while natural selection becomes more powerful in the elimination of deleterious mutations and increasing Figure 2 DFE according to the (nearly) neutral theory of molecular
the frequency of those that are advantageous, even if these have smalls.Neis thus the key parameter determining the relative importance of selectionvs.genetic drift. The range |Nes| = 1 delimitates the decisive borderline: ifNesis,1, genetic drift dominates; if it is .1, selection dictates the fate of mutations.
Because of its simplicity, intelligibility, robustness, and feasible theoretical predictions about the expected pattern of molecular polymorphism and evolutionary rate; the (nearly) neutral theory of molecular evolution became tremendously attractive, enthroned as the universal stochastic null model against which to test any selective or alternative nonneutral hypothesis (Box 2 and Table 1).
The distribution offitness effects
Typically, we categorize a new mutation that enters the population as being neutral when it does not affect thefitness
of the individual bearing it, deleterious when the mutation is detrimental (or even lethal), or advantageous when the mutation increases the fitness of the individual. However, there is a continuum of selective effects, the distribution of fitness effects (DFE) (Eyre-Walker and Keightley 2007; Lanfearet al.2014), such that the effects of mutations range from those that are strongly deleterious (Figure 3A, ma-roon), weakly deleterious (Figure 3A, red), effectively neu-tral (Figure 3A, gray), and weakly (Figure 3A, light green) and highly advantageous (Figure 3A, dark green) muta-tions. In fact, there is not a unique DFE that applies to all nucleotide sites in the genome; each type of nucleotide, depending on the functional class to which it belongs, has its own DFE.
A number of mathematical distributions with two parame-ters, including the normal, lognormal, and gamma distribu-tions, have been used to model the DFE; although a distribution Box 1. Implications of Kimura’s Neutral Theory
In the late 1960s, Motoo Kimura suggested that patterns of protein polymorphism seen in nature were consistent with the view that most polymorphisms andfixed differences between species are either strongly deleterious or selectively neutral (Figure 2A). This proposal was called the neutral theory of molecular evolution (Kimura 1968) (also known as the mutation-drift balance hypothesis) with the following principal assertions (Kimura 1968, 1983):
1. Strongly deleterious mutations are rapidly removed from the population (Figure 3B, small maroon dots close to the
x-axis), and adaptive mutations are rapidlyfixed (Figure 3B, green); therefore, most variation within species (Figure 3B, dotted vertical line) is the result of neutral mutations (Figure 3B, gray).
2. Polymorphisms are transient (on their way to loss orfixation) rather than balanced by selection.
3. The level of polymorphism in a population (u) is a function of the neutral mutation rate (m0) and the effective population size (Ne):u¼4Nem0(in diploids). Larger populations are expected to have a higher heterozygosity, as reflected in the greater number of alleles segregating at a time.
4. A steady-state rate at which neutral mutations arefixed in a population (K) equals the neutral mutation rate:K¼m0. Therefore, the average time between consecutive neutral substitutions is independent of population size (1/m0).
with a goodfit to the data has not yet been resolved (Loewe
et al.2006; Loewe and Charlesworth 2006; Eyre-Walker and
Keightley 2007; Keightley and Eyre-Walker 2010; Tamuriet al.
2012; Kousathanas and Keightley 2013; Lanfearet al.2014). One procedure to estimate the DFE is by comparing the levels of synonymous and nonsynonymous variability across species with very differentNe’s. The extent to which the levels of non-synonymous variability differ compared to the corresponding difference in the levels of synonymous variability (assumed to evolve neutrally), reflects the nature of the DFE on nonsynon-ymous variants (Loeweet al.2006; Haddrillet al.2010). The results of these and other studies inDrosophila, withNein the millions, suggest a wide and highly skewed DFE toward weakly and strongly deleterious variants with values of the strength of selection, Nes, ranging from 1–10 (Sawyeret al. 2003),12 (Keightleyet al.2016),40 (Andolfatto 2007), 350–3500 (Eyre-Walker 2006, reanalyzing Andolfatto’s 2005 data),2000 (Li and Stephan 2006; Jensenet al.2008), to
10,000 (Macphersonet al.2007). These disparate estima-tions are in part due to several assumpestima-tions made by the dif-ferent methods, such that advantageous mutations are weakly selected (Sawyeret al.2003), or that the correlation between diversity and recombination rate is solely due to genetic hitch-hiking (Eyre-Walker 2006, reanalyzing Andolfatto’s 2005 data). In other cases, the differences are due to subtler differ-ences in the methodology used, such as the size of the geno-mic windows considered in the analyses (Andolfatto 2007; Macphersonet al.2007), or the misassignment of the ancestral
state in the unfolded site frequency spectrum (SFS) (Keightley et al. 2016). Interestingly, Sattath et al.
(2011) reveal a substantial variation in thefitness effects of adaptive amino acid substitutions in Drosophila. According to their model, a minority of amino acid sub-stitutions appears to have had large selective effects and ac-count for most of the reduction in diversity, while the majority of amino acid substitutions are only weakly selected. Thisfi nd-ing might also account for the disparate estimates of the strength of selection published for this species.
The rate of molecular evolution (K) is the speed at which genome changes are incorporated (fixed) in a given species in each generation. If genome divergence is thefinal evolution-ary consequence of the molecular population dynamics, then
Box 2. Genome-Wide Signatures of Selection and Tests of Selection Based on Polymorphism and/or Divergence Data
Looking for evidence of positive selection is a widely used strategy for identifying adaptive variants (Bamshad and Wooding 2003; Nielsen 2005; Vittiet al.2013; Haasl and Payseur 2016) and quantifying the impact of selection on the genome. During the process offixation of adaptive variants, linked neutral variation is dragged along with the selected site; thus reducing the levels of genetic diversity in the region, while simultaneously new mutations accumulate in the region (see sectionGenetic draft as a selectionist alternative to the neutral theory). These mutations represent most of the genetic variation in the region depauperated by the selective sweep, and their initial frequency is low, so that a region harboring a positively selected variant will also harbor an excess of rare derived alleles. Furthermore, if an allele influenced by recent positive selection increases in frequency faster than local recombination reduces the range of LD between the allele and linked markers, then the region will also show unusually long-range LD (Nielsen 2005; Franssen
et al.2015; Garudet al.2015; Garud and Petrov 2016). As a whole, natural selection leaves signatures in the genome that
can be used to identify the regions that have been selected, including:
1. A reduction in the genetic diversity. 2. A skew toward rare derived alleles. 3. An increase in the LD.
and many instances of selective sweeps have been found inDrosophila(Schlötterer 2002; Kaueret al.2003; Akeyet al.
2004; Wieheet al.2007; Poolet al.2012; Brandet al.2013; Garudet al.2015), as well as other species (Haasl and Payseur 2016).
Another selective process also reduces the level of genetic variation in the region:BGS(i.e., the recurrent elimination of chromosomes carrying strongly deleterious mutations) (Charlesworthet al.1993; Bravermanet al.1995; Charlesworth
et al.1995). The effect in this case is to reduce the number of chromosomes that contribute to the next generation, thus
reducing the levels of genetic diversity in the region. In contrast to a hitchhiking event, it neither skews the distribution of rare polymorphisms, nor generates LD blocks. In this sense, the result is identical to that of a reduction in population size, except that the reduction applies not to the genome as a whole, but to a tightly linked region (Charlesworthet al.1993). Finally, balancing selection and local adaptation leave other particular signatures of selection in the genome that include haplotypes at an intermediate frequency, with strong population differentiation, and a high level of LD with respect to variants at surrounding sites (Charlesworthet al.1997).
Several tests have been developed to quantify the amount of selection in the genome using polymorphism and/or divergence data (Table 1). We will focus here on standard tests that have been the basis of today’s most sophisticated statistical methods to spot genomic regions modeled by natural selection, and we direct the reader to Vittiet al.(2013) for a more comprehensive review of all the methods available.
dN/dS(orKa/Ks) ratio
Assuming that silent substitutions are neutral, if advantageous mutations have been frequent among nonsynonymous sites and have spread through the population faster than neutral mutations, then the rate of nonsynonymous substitution—dN
orKa—will be significantly greater than the rate of silent substitution—dSorKs. On the other hand, if replacement
substitutions are mostly removed by negative selection,dNwill be significantly lower thandS. Thus, the ratiov¼dN/dS
(Yang and Bielawski 2000) is used as a common measure of functional constraint:dN/dS¼1 under neutrality, is,1 under
functional constraint, and is.1 under positive selection. Note that the method assumes that (1) synonymous substitutions are neutral; and (2) all substitutions have the same biological effect, which might not be the case. This test is conservative because most nonsynonymous mutations are expected to be deleterious anddNtends to be much lower thandS. Thus, the
proportion of adaptive substitutions needs to be high for adaptive evolution to be detectable using this method.
The MK test
The MK test (McDonald and Kreitman 1991) was developed as an extension of the Hudson–Kreitman–Aguadé test (Hudson et al. 1987). It was designed to be applied to protein coding sequences, combining both between-species divergence (D) and within-species polymorphism (P) sites, and categorizing mutations as synonymous (Ps,DS) and
nonsynonymous (Pn,DN). If all mutations are either strongly deleterious or neutral, thenDN/DSis expected to roughly
equalPn/Ps. In contrast, if positive selection is operating in the region, adaptive mutations rapidly reachfixation and thus
contribute relatively more to divergence than to polymorphism when compared to neutral mutations, and thenDN/DS. Pn/Ps. We can summarize the four values as a ratio of ratios termed the neutrality index (NI) as NI¼[(Pn/Ps)/(DN/DS)]
(Rand and Kann 1996) and quantify the significance of the effect using a simple 232 contingency table. The MK test can also be extended to other functional regions of the genome, such as noncoding DNA, assuming that one of the two classes compared evolves neutrally (Casillaset al.2007; Egeaet al.2008).
Furthermore, assuming that adaptive mutations contribute little to polymorphism but substantially to divergence, data from an MK test can be easily used to estimate the proportion of nonsynonymous substitutions that have beenfixed by positive selection asa¼12(DSPn/DNPs) (Charlesworth 1994; Smith and Eyre-Walker 2002). However, this estimate can
be easily biased by the segregation of slightly deleterious nonsynonymous mutations (Eyre-Walker 2002) and different demographic histories. If the population size has been relatively stable,ais underestimated, because slightly deleterious mutations tend to contribute relatively more to polymorphism than they do to divergence when compared with neutral mutations. On the contrary, slightly deleterious mutations can lead to an overestimate ofaif population size has expanded, because those slightly deleterious mutations that could becomefixed in the past by genetic drift due to the
the overall molecular evolutionary rate (K) taking into account all mutations is determined by the general expression:
K¼2Nm
Z N
2NuðN;Ne;sÞfðsÞds:
Now, let us consider the assumptions of the neutral theory that mutations are either effectively neutral (s0, the fractionm0) or strongly deleterious. For simplicity, let us also consider that the effective population size equals the population census (Ne¼N). The general expression simplifies toK¼2N½m0uðN;s¼0Þþ
ðm2m0ÞuðN;s¼ 2NÞ. If the probability of fixation of strongly deleterious mutations is null ½uðN;s¼ 2NÞ ¼0; thenK¼2Nm0uðN;s¼0Þ ¼2Nm0 1=2N¼m0, getting back the Kimura’s minimalist equationK¼m0. Note that the proba-bility offixation of a neutral mutation equals its initial frequency in the population,uðN;s50Þ ¼1=2N.
Genetic draft as a selectionist alternative to the neutral theory
Even though the Kimura’s neutral theory predicts a linear relation-ship between the extent of genetic diversity and population size (u=4Nem; Box 1), data unambiguously show that the wide range in population sizes over all species is not linearly reflected in their relatively similar genetic diversities (see sections The allozyme
era: setting the stage for the neutralist–selectionist debateandThe
nucleotide sequence era). Smith and Haigh (1974) proposed
ge-netic hitchhikingas an explanation for the apparent population
size paradox. In this process, neutral alleles that are sufficiently tightly linked to a favorable mutation go tofixation along with the favorable mutation, resulting in a reduction of linked genetic var-iation (what was later called aselective sweep; Berryet al.1991). In the late 1980s, when allozyme polymorphism studies were replaced by DNA-based markers, genetic variation was shown to be reduced in regions of low recombination in
Dro-sophila, such as in the centromeres or within chromosome
rearrangements (see sectionThe nucleotide sequence era). Af-ter excluding mutation as the explanation for this correlation, Begun and Aquadro (1992) invoked recurrent natural selec-tion to explain the observed pattern: within-species variaselec-tion had to be more rapidly eliminated in regions of low recom-bination. John Gillespie revised the hitchhiking hypothesis and developed a stochastic model of the process he calls
ge-netic draft(Gillespie 2000a,b, 2001). Like genetic drift, draft
removes genetic variation from the population, although in this case the effect increases with population size. In partic-ular, asNeincreases, genetic drift is less effective in removing alleles from the population and genetic variation tends to increase. But at the same time, more adaptive mutations oc-cur (since there are more alleles to mutate) and selection is more prevalent, so more genetic hitchhiking events occur that reduce the level of genetic diversity in the region linked to the event. OnceNeis sufficiently large, genetic draft dom-inates and genetic variation becomes insensitive to popula-tion size. Thus, through this alternative model, Gillespie was able to uncouple population size and the levels of genetic diversity (Gillespie 2004; Lynch 2007).
The genetic draft effect is more prominent in regions of the genome with reduced recombination, where hitchhiking events leave a trace in a larger region which is linked to the selected variant. In the case of the mitochondrial chromosome (mtDNA), the levels of recombination are much lower than in the nuclear DNA, and this tightly linked region spans the whole chromosome. For this reason, selectively advantageous mutations that arise in the mtDNA constantly remove all previously existing variation in the chromosome and levels of mtDNA diversity appear to be similar across distant species, independently of their population size (Bazinet al.2006). As a result, 58% of amino acid substitutions in invertebrate mtDNA are selectively advantageous (12% in vertebrate mtDNA), and mtDNA diversity is essentially unpredictable very high (Charlesworth and Eyre-Walker 2008). Eyre-Walker and Keightley (2009) developed the DFE-aas an unbiased estimate of the percentage of adaptation occurring in the genome, even in regions of little or no recombi-nation. They estimatedaby simultaneously estimating the DFE at selected sites from the SFS and the number of adaptive substitutions.
The coalescence theory
by population size and may only reflect the time since the last hitchhiking event rather than population history and demog-raphy (Bazinet al.2006).
Thus, a byproduct of selection acting on an adaptive variant is the reduction of nearby genetic diversity. Charlesworth et al. (1993) proposed that a similar effect should be observed around deleterious variants, a process known as background selection (BGS) (Box 2). Selective sweeps are expected to dominate when selection is strong, and adaptive mutations are common. On the contrary, BGS will predominate when selection is relatively weak and mu-tations are recessive. While both mechanisms have long been proposed as being responsible for wiping out the expected relationship between genetic diversity and popu-lation size, i.e., Lewontin’s paradox, it has not been until recently that a wealth of population genomics data from a wide range of species has been available to empirically test the effects of linked selection on the surrounding levels of genetic diversity. Corbett-Detiget al.(2015) have modeled the expected reduction in neutral diversity by BGS and hitchhiking under different recombination rates for 40 dif-ferent eukaryotic species, showing that while the effects of selection on neutral diversity can be substantial, they vary between species according toNc;i.e., natural selection has a greater impact on the levels of linked neutral variation in species with largeNcthan in those with smallNc. It is con-cluded that in species with a large population size, such as
D. melanogaster, natural selection truncates the upper tail of
the distribution of neutral variation. This study provides direct empirical evidence that natural selection in large pop-ulations constrains the levels of neutral genetic diversity and contributes to explain the long-standing paradox of population genetics.
In one of the most attractive hypotheses of the last decade, Michael Lynch (2006, 2007) proposes that not only genetic variation, but also the very complexity of the genome is a consequence of population genetic processes. In very large populations, selection is so effi -cient that genomes cannot leave their adaptive peak to investigate new landscapes. In contrast, in small eukary-otic populations, inefficient selection allows the genome to accumulate slightly deleterious mutations that will eventually be the source for adaptive innovations. Thus, the complexity of the eukaryotic genome would be initi-ated by nonadaptive processes, which in turn would pro-vide a new substrate to secondarily build novel forms of organismal complexity through the action of natural selection.
Patterns of Genome Variation
The immense outpouring of genome variation data precipi-tated by NGS techniques has made the empirical aim of population genetics a reality (Lewontin 1991). Detailed genome-wide descriptions of the nucleotide, indel, and TE variation patterns of several model species are already
available [forD. melanogaster(Langleyet al.2012; Mackay
et al.2012; Huanget al.2014; Lacket al.2015), yeasts (Liti
et al.2009; Stropeet al.2015),A. thaliana(Caoet al.2011),
C. elegans(Andersenet al.2012), as well as humans (Durbin
et al.2010; 1000 Genomes Project Consortium 2012, 2015)].
Population genetics studies prior to the population genomics era were based on fragmentary and often biased nonrandom samples of the genome, but the genomic dimension has provided us with the complete variational census along any chromosome and functional region of the genome. Popula-tion genomics surveys have allowed refining, improving, and clarifying patterns and processes of nucleotide variation pre-viously studied in smaller data sets (Smith and Eyre-Walker 2002; Andolfatto 2005; Presgraves 2005; Casillaset al.2007; Sacktonet al.2009; Sellaet al.2009); but more importantly, the genome perspective has provided qualitative new insights about the action of selection and the limits imposed by the architecture of the genome on adaptation. The 40-year-long neutralist–selectionist debate has shifted toward a new per-spective: recombination has become a decisive parameter, determining the relative importance of genetic drift vs. ge-netic draft at the intragenomic variation level.
The inquiry power of population genomics
Thefirst step in any population genomics study is estimating the parameters that capture the evolutionary properties of the analyzed sequences (e.g., polymorphism and divergence measures, proportion of adaptivefixations; see Table 1). This parameter inventory confers a large integrative capacity in both the level of genomic explanation and in the multi-omics level.
At the genomic level, these population parameters can be correlated throughout the genome with other genomic vari-ables such as the local recombination rate, GC bias, gene density, chromosome arm, or chromosomal region, to assess the relative impact of the genomic determinants of genetic variation. Which part of the within-genome variation is ascrib-able to each genomic determinant? How much do these genomic variables constrain the adaptive capacity of the genome? Especially relevant is the interaction between selec-tion and recombinaselec-tion and its relaselec-tionship with the Hill– Robertson interference (HRi) process (seePervasive selection
and the HRi).
At the multi-omics level, the patterns of genomic diversity can be correlated with annotations of large sets of“-omics” data (e.g., transcriptomics, epigenomics) allowing the inte-gration of large sets of -omics data to gain a global (systemic) view of the causes and evolutionary and functional effects of genome variation (Wagner 2008; Loewe 2009).
Population genomics in Drosophila
The first population genomics study in aDrosophilaspecies was carried out by Begunet al.(2007) inD. simulans. Seven inbred lines of diverse origin were sequenced by whole-genome shotgun and the whole-genome assemblies were com-pared with the sequences of the closely related species,
lines, large-scale fluctuations of polymorphism and diver-gence were found along chromosome arms, there was signif-icantly less polymorphism and faster divergence on the X
chromosome, a correlation between recombination rates and sequence variation was found, and there was evidence of adaptive protein evolution at 19% of 6702 analyzed genes. The study provided the first direct genome-wide evidence showing that natural selection is pervasive in the genome
of aDrosophilaspecies.
InD. melanogaster, a preliminary study by Sacktonet al.
(2009) surveyed natural variation in nine strains from Afri-can (n= 3) and North American (n= 6) populations based on low-coverage sequencing. Later, two ambitious population genomics projects have allowed two independent population genomics studies in the same species. The DGRP (Mackay
et al.2012), a community resource for the analysis of
popu-lation genomics and quantitative traits, has fully sequenced 158 inbred lines (Mackay et al.2012), later extended to a total of 205 lines (Huanget al.2014), derived from a North American natural population (RAL). From a pure population genetics perspective, the availability of 205 deep-coverage genomes from a single natural population represented an unprecedented opportunity to perform the most comprehen-sive population genetics study done so far in any species. Using an integrated genotyping strategy, 4,853,802 SNPs and 1,296,080 non-SNP variants were identified. The popu-lation genome browser, PopDrowser (Ràmiaet al.2012), has been designed for visualizing and querying the summary sta-tistics, LD parameters, and several neutrality tests along the chromosome arms of the DGRP sequence data. The DPGP (Langley et al.2012) independently analyzed the genome-wide polymorphism of two natural populations of D.
mela-nogaster: 37 DGRP lines and 6 from a population of Malawi
(Africa, MW data). The genome sequences ofD. simulansand
D. yakuba(Drosophila 12 Genomes Consortiumet al.2007)
were used to estimate the divergence pattern. Variation pat-terns along the chromosome arms were measured (1) through different nonoverlapping window-sized units, and (2) for different DNA functional regions [coding (synony-mous and nonsynony(synony-mous), 59and 39UTR, intron, and inter-genic]. Here, we will focus on the following results of these studies: (1) Description of the patterns of polymorphism and divergence (nucleotide, indels, and TE) along chromosome arms and for different functional classes; (2) mapping natu-ral selection throughout the genome; (3) local recombination rate and patterns of variation and selection; and (4) quanti-fying the cost of linked selection, i.e., the Hill–Robertson effect.
Nucleotide variation:Nucleotide heterozygositypis around 41% larger in the ancestral geographical MW population (p = 0.00752) than in the North America RAL population (p= 0.00531). The genome patterns of polymorphism differ manifestly along chromosome arms, mainly between centro-meric vs. noncentromeric regions within autosome arms; while divergence is rather homogeneous along the whole
chromosome arms. Autosomal nucleotide diversity is reduced on average two- to fourfold in centromeric regions relative to noncentromeric regions, as well as at the telomeres; whereas it is relatively constant along theXchromosome. Average poly-morphism on the X chromosome is reduced relative to the autosomes in the RAL population, but not in the MW popula-tion. Genes on theXchromosome evolve faster than autosomal genes (X:autosome ratio = 1.131 in the RAL population). Common inverted and standard karyotypes are genetically di-vergent and account for most of the variation in relatedness among the DGRP lines (Huanget al.2014).
The pattern of polymorphism and divergence by site func-tional class is consistent within and among chromosomes
(psynonymous.pintron.pintergenic.pUTR.pnonsynonymous),
in agreement with previous studies on smaller data sets (Andolfatto 2005; Sella et al. 2009). Polymorphism levels between synonymous and nonsynonymous sites differ by an order of magnitude (psynonymous= 0.0120;pnonsynonymous= 0.0016) (Mackay et al.2012; Barrón 2015). Polymorphism and divergence patterns within the site functional classes gen-erally follow the same patterns observed overall.
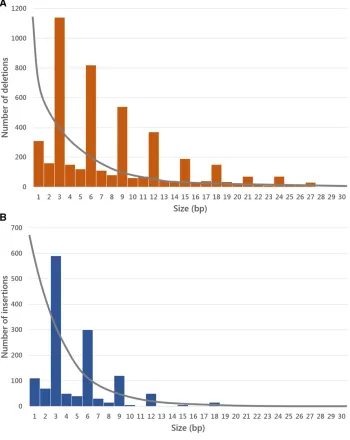
Indel variation:A measure analogous to nucleotide hetero-zygosity, pindel, is used to describe indel polymorphism (Huanget al.2014). This measure does not take indel size into account. The pattern of pindel along chromosomes is similar to that of SNP nucleotide diversity. There is a strong positive correlation between indel and nucleotide diversity for all chromosome arms (Massouraset al.2012; Huanget al.
2014).
Evolutionarily derived deletions outnumber insertions, the deletion:insertion ratio forD. melanogasteris 2.2:1. This es-timate is consistent with previous eses-timates that indicate a bias toward higher deletion than insertion rates (Petrov 2002; Ometto et al. 2005; Assis and Kondrashov 2012; Leushkinet al.2013). There are on average 60% fewer dele-tions and 74% fewer inserdele-tions on theXchromosome than on the major autosomal chromosomal arms, consistent with stronger selection against indels on theXchromosome (see below).
TE variation: Barrónet al.(2014) have recently reviewed different evolutionary models to explain the diversity of TEs present in the Drosophilagenome, where they account for
20% of the genomic sequence. Most TEs are present at low population frequencies, especially those found in high-recombining regions of the genome (Bartoloméet al.2002; Lee and Langley 2010; Petrovet al.2011; Kofleret al.2012; Cridland et al. 2013), and reside mainly outside exons or untranslated regions.
Mapping natural selection throughout the genome