ISSN(Online): 2320-9801
ISSN (Print): 2320-9798
I
nternational
J
ournal of
I
nnovative
R
esearch in
C
omputer
and
C
ommunication
E
ngineering
(An ISO 3297: 2007 Certified Organization)
Vol. 3, Issue 6, June 2015
Quality Analysis and Grading of Rice Grain
Images
Vidya Patil, V. S. Malemath
M Tech Student
,
Department of CSE, KLE Dr M S Sheshgiri College of Engg. & Tech., Udyambag Belgaum,Karnataka India
Professor and Head, Department of CSE, KLE Dr M S Sheshgiri College of Engg. & Tech., Udyambag
Belgaum, Karnataka India
ABSTRACT: The quality of the food grain we consume is of more importance, as people are becoming educated their demand for quality of grains is increasing. There is possibility of adulteration of food grains by the traders. Generally the quality assessment is carried by visual inspection which is manual process. In this work an image processing technique is used as an attempt to automate the process which overcomes the drawbacks of manual process. This paper provides the quality assessment of rice grains based on its size. Based on the size the grains are graded as (grade 1, grade 2 and grade3). Here we considered different varieties of rice grains for testing like Basmati, sona masuri, boiled rice, egg rice etc. The system is developed using 105 set of images and are classified using decision tree based classification technique. The results are found to be encouraging.
KEYWORDS: food grain Grading, Extraction, Morphological Operations, quality analysis I. INTRODUCTION
The demand for quality of food products we consume is increasing day by day. As the literacy rate is increasing in India so is the need for quality of food products is increasing. India is the second largest producer of rice grains first being China. As the production of rice is increasing so is the demand for its quality. This demand for quality of food grains is increasing because some of the traders cheat the shopkeepers by selling poor quality food grains which contains foreign particles like stones, sand, leaf, broken and damaged seeds etc. This kind of low quality of rice is sold without being noticed even and moreover there is no special scheme to find such poor quality grains. Therefore it is been a problem for both consumers and sellers.
As the technology is growing wider people are adopting the new technologies rather than using the old techniques. The growth in technology is making people more demanding towards the things they use and consume, this is the reason why everything is becoming automated. The use of Image processing techniques for testing the quality of rice grains is inexpensive and is less time consuming. The quality of grain is tested based on its color, size, shape and texture features in this method.
Further, biological methods (DNA technique etc) and chemical methods (alkaline tests etc) can be used for the identification of rice grain seed varieties and quality. But these methods are very expensive and time consuming. On the other hand the machine vision or the digital image processing is a non destructive method (i. e. after assessment the grains can be used), it is a very fast and inexpensive process compared to the biological methods.
ISSN(Online): 2320-9801
ISSN (Print): 2320-9798
I
nternational
J
ournal of
I
nnovative
R
esearch in
C
omputer
and
C
ommunication
E
ngineering
(An ISO 3297: 2007 Certified Organization)
Vol. 3, Issue 6, June 2015
include biological tests, alkaline tests, test for pesticide content etc on products like groundnuts, maize, wheat, jowar etc
II. RELATED WORK
In this context number of author proposed their work and is what follows. Kaur and Verma, [1] have proposed computer vision techniques for grading of rice kernels based on their sizes (full, medium, half). The images are acquired using a digital camera having high pixel resolution. The camera is located at a position normal to the object. This algorithm is tested on images placed under different illumination & background colour characteristics.
The poor illumination effects were removed from the background and the image is converted to binary image, then successive erosion and dilation operations are performed to separate the touching kernels. By labelling the connected components the grains were counted and area of each connected components is found using region props, the maximum grain length found is used as a structuring element and morphological operations were performed to extract the grains which have length less than the structuring element. Then finally grading formulae is applied which gives the percentage of full length grains in the given sample. The grading formula & standards were acquired from the analysis procedure for grading rice followed in India.
Jagdeep Singh and Banga [2] have proposed image processing techniques for grading of rice samples based on their sizes. The images were captured using a Flat Bed Scanner (FBS) and they even say that high resolution digital cameras may also be used. Image thus acquired is then converted to binary image to which they apply morphological operations and by finding the properties of the connected components in the image the objects features were extracted. Based on the objects features, stem graphs were plotted and the grain kernels which have lesser values than a threshold were discarded. Finally they calculate the percentage of full length grains in the sample image to grade the quality.
Maheshwari [3] proposed image processing techniques for identifying two varieties of rice based on their shape and size. Image of a sample grains spread on the black or butter paper were captured using a digital camera, the edge detection operation were performed to calculate the Geometric parameters. Based on these parameters they classified rice seeds into three parts namely normal, long and small rice seeds and displayed the count of normal, long and small rice seeds on screen.
Harpreet Kaur and Baljit Singh have proposed a technique for classification and grading of rice grains using multi-class SVM. He collected the images of sample by spreading the grains on glass of scanner and using black sheet of paper as background. The images were preprocessed to remove noise. The images subdivided into its parts by using segmentation methods. We get a binary image of segmentation. The content of chalky grains were calculated, further the chalky degree is calculated. The length of the grain is analyzed the grain shape is defined based on its length and width. Based on this length the purity of the grain is calculated. If its length is greater than 75% than it’s considered as unbroken of else it’s taken as broken. Here an SVM (support vector machine) which is a new type of classifier, where the grains were classified as grade A, grade B, grade C. An RBF kernel handles nonlinear classification problems.
ISSN(Online): 2320-9801
ISSN (Print): 2320-9798
I
nternational
J
ournal of
I
nnovative
R
esearch in
C
omputer
and
C
ommunication
E
ngineering
(An ISO 3297: 2007 Certified Organization)
Vol. 3, Issue 6, June 2015
(Megha and Kulkarni, [6] have proposed Classification and Quality Analysis of Food Grains. The intension of the work was to develop a real time application which was used to identify and classify the food grains and to grade the rice grains. In order to carry out this work the image samples were captured using a high resolution camera and the images were stored in a database. The color feature and geometric features were considered in their work. Geometric features include the shape, length and the width of the grain.
Ajay et. al [7] have proposed a quality evaluation of rice grains Using morphological methods. Physical features play a vital role in classification and grading of rice grains. Features like length, width, and perimeter are considered. The steps like capturing of the image, image extraction followed by removing of noise and other illuminations from the image, image segmentation, and morphological feature extractions are carried out here. Features like length, width, area etc are computed. Morphological operations like erosion and dilations are carried out here. The command im2bw is used to convert an image to gray scale image. Once the morphological features are extracted and the length of the grains are obtained they set a threshold value for the length. The grains whose values are less than this threshold were considered as broken where as those greater than the threshold value were considered as whole grains. Thus the use of morphological features to separate the broken grains was considered more efficient than the previous methods. This proposed method is faster compared to the previous grading techniques.
From the literature it is evident that the moderate amount of work is visible is found to be on identification of different types of food grains but very less amount of work has been reported on the grading of rice. Hence it is essential that a automated process is essential to replace manual process of grading rice is required to be replaced with an automation therefore I define the problem statement as “To design and implement a method for grading (full, medium, small) and identification of different varieties of rice grains by extracting the features of the grain such as colour, length, shape and texture properties from the images obtained from flat bed scanning of the grains by using digital image processing technique”
III.PROPOSED METHODOLOGY
In the proposed method we have considered three varieties of rice grains namely Basmati, Delhi and Boiled. Each of these grains are further classified and graded into grade 1, grade 2 and grade3. In the Manual process an expert inspects the individual grains. Based on the features like major axis length, minor axis length and its area, experts grade the grains. The same features are used in automated method for grading of the grains.
Fig 1 to show grading of rice grains
Images are acquired using high resolution. The rice samples are placed on the sheet of the paper and the images were captured. The camera was placed at a position normal to the rice samples. The images were stored in JPG format. A data set of different set of images was created manually classified. Fig 1 shows the flow diagram for grading of rice grains , the steps involved here are input image, pre processing, grain extraction, counting, analysis and results. Figure 1 (a) and (b) shows two qualities of rice grains used for grading.
Grains extraction
Pre-processing
Result Analysis Counting
ISSN(Online): 2320-9801
ISSN (Print): 2320-9798
I
nternational
J
ournal of
I
nnovative
R
esearch in
C
omputer
and
C
ommunication
E
ngineering
(An ISO 3297: 2007 Certified Organization)
Vol. 3, Issue 6, June 2015
(a) (b)
Fig. 2 The two qualities of rice grains
(a) Sample image of Basamati rice (b) Sample image of Delhi rice
The above fig. 2 shows two qualities of rice grains we consider for grading, here we have considered Basamati rice and Delhi rice for grading.
.
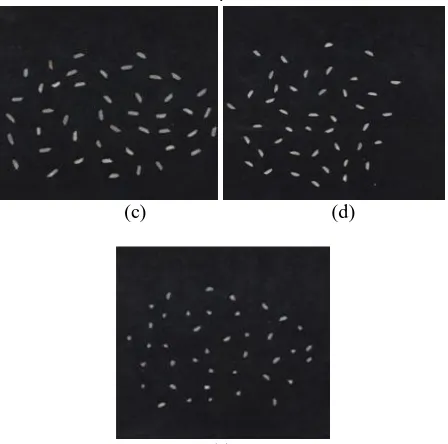
(c) (d)
(e)
Fig 3 shows Grading of rice grains (c) Sample image of Basamati grade1 (d) Sample image of grade2 and
(e) Sample Image of grade3 rice.
Figure (c), (d) and (e) shows the rice grains graded as grade 1, grade 2 and grade 3.
Pre-processing is an important step. The images acquired from the first step were pre-processed here for background subtraction, and are converted into binary image.
ISSN(Online): 2320-9801
ISSN (Print): 2320-9798
I
nternational
J
ournal of
I
nnovative
R
esearch in
C
omputer
and
C
ommunication
E
ngineering
(An ISO 3297: 2007 Certified Organization)
Vol. 3, Issue 6, June 2015
Based on the following criteria the grains were graded:
If the length of grain is >=3/4th the length of grain then it’s considered a whole grain and is graded as grade 1. If the length of grain<=3/4th the length of grain then it’s considered as broken grain and is graded as grade 2.
Counting of grains is done using region props, which gives the count of grains present in the object.
Figure 5 shows individual rice grains extract.
Counting of connected components using region props. Count of number of full, medium and broken grains.
Percentage of whole sound grains in the sample is given by, Percentage of whole sound grains = (N * 100) / W where, N = Number of whole sound grains (i.e. grains having area ≥ 3/4th biggest grain area are considered as whole sound grains) present in an image, W= Total number of grains in a given sample image.
If percentage of whole sound grains is ≥ 75% then it is graded as ‘A’, between 50-75% means grade ‘B’, below 50% means grade ‘C’.
IV.ALGORITHM
Input:
Rice sample input image.
Output:
Classified grain quality grade.
Steps of algorithm:
Step1: Pre-process the images of rice to remove background noise
Step2: Convert the pre processed image to binary image using Otsu method. Step3: Region label the binary image. .
Step4: Segment/crop the individual grains present in the image.
Step5: Extract the geometric features major axis, minor axis and area of all the individual grains Step6: Perform analysis on the quality using the average values of the features extracted Step7: Classify the sample for the Type and grade based on the analysis
Stop.
V. EXPERIMENTS AND RESULTS
For experimentation we have considered 105 images of each type with different types as specified out of 105 images 35 each images are of Basamati, Delhi and Boiled rice. We have used decision tree classifier for classifying the grains and grading them as grade 1, grade2 and grade3.
Table 1 Testing Results of Quality analysis and grading of rice
Rice Quality Number of samples Classification Results Accuracy (%) Basmati 15 14 are classifies as
basmati
98 Boiled 15 12 are classifies as boiled 92 Delhi 15 11 are classified as Delhi 90
ISSN(Online): 2320-9801
ISSN (Print): 2320-9798
I
nternational
J
ournal of
I
nnovative
R
esearch in
C
omputer
and
C
ommunication
E
ngineering
(An ISO 3297: 2007 Certified Organization)
Vol. 3, Issue 6, June 2015
The above table gives the testing results of quality analysis and grading of rice grains. Here the rice is graded based on the size of individual grain. The number of samples tested here are 15 images of each type and the results obtained were satisfactory.
Table 2 Testing Results for Quality analysis and grading of rice
Rice Grade Number of samples Classification Result Accuracy (%) Grade1 20 18 are classified as
grade1
98 Grade2 20 13 are classified as
grade2
91 Grade3 20 11 are classified as
grade3
88
VI.CONCLUSION
Today’s consumers are very quality conscious about the food grains they buy and consume as more and more
adulteration in the food grains are reported in the media. In this paper an attempt is made to grading of rice grains based on morphological techniques using image processing. The image is initially subjected to preprocessing and the individual grains are segmented. The geometric features of the grain such as area, major axis length and the minor axis length are extracted and are subjected to classification The result are found to be encouraging. Based on the length of the grain the rice is graded as grade 1, grade 2 and grade 3. Even though the problem being worked upon is not completely new, the earlier approaches employed very large number of color, textural and morphological features which made the algorithm extremely slow because of the intensive computation. The average accuracy of classification is found to be 93%.REFERENCES
1. Gurpreet Kaur & Bhupinder Verma[1], Measurement standards based grading of rice kernels by separating touching kernels for embedded imaging applications, International Journal of Electronics, Communication & Instrumentation Engineering Research and Development (IJECIERD) ISSN 2249-684X, Vol. 3, Issue 1, pp 127-134, Mar 2013.
2. Jagdeep Singh Aulakh, Dr. V.K. Banga [2]: grading of rice grains by image processing. International Journal of Engineering Research & Technology (IJERT) Vol. 1 Issue 4, pp 1-4, June – 2012 ISSN: 2278-0181.
3. Chetna V. Maheshwari,[3] Q-CURVE APPROACH FOR QUALITY ANALYSIS OF INDIAN ORYZA SATIVA SSP INDICA(RICE),
International Journal of Advanced Technology in Engineering and Science, Volume No.01, Issue No. 03, March 2013.
4. Harpreet Kaur, Baljit Singh, ijsrp,[4] classification and grading of rice grains using multi-class SVM. Volume 3, Issue 4 April 2013. 5. Megha R. Siddagangappa A. H. Kulkarni,[6] Classification and Quality Analysis of Food Grains. IOSR-JCE, Volume 16, Issue 4, Ver.
III, pp 01-10 jul-aug 2014.
6. G.Ajay, M.Suneel,[7] QUALITY EVALUTION OF RICE GRAINS USING MORPHOLOGICAL METHODS, International Journal of
Soft Computing and Engineering (IJSCE) ISSN: 2231-2307, Volume-2, Issue-6, pp 35-37, January 2013.
7. Basavaraj S. Anami, Dayanand G. Savakar,[5] Effect of Foreign Bodies on Recognition and Classification of Bulk Food Grains Image Samples. Journal of Applied Computer Science, no. 6 (3), pp 77-83 2009.
8. R.Kiruthika, S.Muruganand , Azha Periasamy “MATCHING OF DIFFERENT RICE GRAINS USING DIGITAL IMAGE
PROCESSING” International Journal of Advanced Research in Electrical, Electronics and Instrumentation Engineering Vol. 2, Issue 7, July 2013.
9. Bhavesh B. Prajapati1, Sachin Patel2 “Algorithmic Approach to Quality Analysis of Indian Basmati Rice Using Digital Image Processing” International Journal of Emerging Technology and Advanced Engineering Website: www.ijetae.com (ISSN 2250-2459, ISO 9001:2008 Certified Journal, Volume 3, Issue 3, March 2013).
10. ABDELLAOUI Mehrez , DOUIK Ali, Hybrid method for cereal grain identification using morphological and color features, 1-4244-0395-2/06/$20.00 ©2006 IEEE.
11. H.K. Mebatsion, J. Paliwal, D.S. Jayas,”Automatic classification of non-touching cereal grains in digital images using limited morphological and color features” Elsevier ,Computers and Electronics in Agriculture 90,2013.
ISSN(Online): 2320-9801
ISSN (Print): 2320-9798
I
nternational
J
ournal of
I
nnovative
R
esearch in
C
omputer
and
C
ommunication
E
ngineering
(An ISO 3297: 2007 Certified Organization)
Vol. 3, Issue 6, June 2015
BIOGRAPHY
Vidya Patil is a M Tech student in the Department of Computer Science & Engineering, KLE DR M S Sheshgiri College of Engineering Belgaum. She completed her Bachelor of Engineering in Computer Science & Engineering from Rural Engineering College in the year 2012.