KHANAL, PIUSH. Genomic Selection of Meat Quality and Carcass Composition Traits of Crossbred Swine. (Under the direction of Dr. Christian Maltecca).
by Piush Khanal
A dissertation submitted to the Graduate Faculty of North Carolina State University
in partial fulfillment of the requirements for the degree of
Doctor of Philosophy
Animal Science and Poultry Science
Raleigh, North Carolina 2019
APPROVED BY:
__________________________ __________________________ Dr. Christian Maltecca Dr. Francesco Tiezzi Committee Chair
__________________________ __________________________ Dr. Mark Knauer Dr. Alison Motsinger-Reif
__________________________ Dr. Nick VL Serao
ii DEDICATION
iii BIOGRAPHY
iv ACKNOWLEDGMENTS
I would like to express my sincere gratitude to Dr. Christian Maltecca for his guidance and professional advises during my academic program. Through his guidance I have learned the skills necessary to conduct the research in professional manner. I would like to thank Dr. Francesco Tiezzi for his valuable and constructive comments, suggestions, criticisms and continuous support during my Ph.D. program. This thesis would have not been possible without his continuous support. Also, I would like to thank Dr. Nick VL Serao for allowing me to gain valuable experience in fescue toxicosis project in Angus cows. This project was a great opportunity to learn and be involved in analyzing RNA seq data. My humble thanks and admiration go to Dr. Mark Knauer and Dr. Alison Motsinger-Reif for allowing me the support during my Ph.D.
I would like to thank my co-workers Emmanuel, Jason, Hanna, Yuqing and Elif for their help and support during my Ph.D. I appreciate the help and support that I receive from my colleagues of Department of Animal Science and Department of Statistics at North Carolina State University. I would also like to thank the Animal Science Department’s faculty and staff for all the help during this time for making this time memorable in life.
v TABLE OF CONTENTS
LIST OF TABLES ... vii
LIST OF FIGURES ... xi
Chapter 1: Literature Review ... 1
1.1Introduction ... 1
1.2Genomic selection ... 2
1.2.1 Genomic Best linear Unbiased Prediction (GBLUP) ... 3
1.2.2 Ridge regression... 4
1.2.3 Bayesian methods ... 5
1.2.4 Single step versus multiple step BLUP for genomic selection ... 7
1.2.5 Factors affecting genomic selection... 7
1.3Genetics of meat quality and carcass traits ... 8
1.4Microbiome ... 9
1.4.1 Development of gut microbiome in pigs ... 10
1.4.2 Diversity of gut microbiome ... 11
1.4.3 Microbiome genomics and bioinformatics ... 13
1.4.4 Data processing of microbiome count data ... 16
1.4.5 Function of gut microbiome in pig ... 17
1.4.6 Effect of microbiome on host ... 19
1.5Conclusion ... 21
Chapter 2: Genetic parameters of meat quality, carcass composition and growth traits in commercial swine ... 25
2.1 Abstract ... 25
2.2 Introduction ... 26
2.3 Materials and Methods ... 27
2.4 Results and Discussions ... 36
2.5 Conclusions ... 47
2.6 Tables ... 49
2.7 Figures... 56
Chapter 3: Microbiability of meat quality and carcass composition traits in swine ... 58
3.1 Abstract ... 58
3.2 Introduction ... 58
3.3 Materials and Methods ... 60
3.4 Results and Discussions ... 67
3.5 Conclusions ... 75
3.6 Tables ... 77
3.7 Figures... 83
Chapter 4: Modeling host by microbiome interaction for the prediction of meat quality and carcass composition traits in swine ... 86
4.1 Abstract ... 86
vi
4.3 Materials and Methods ... 88
4.4 Results ... 96
4.5 Discussions ... 102
4.6 Conclusions ... 105
4.7 Tables ... 107
4.8 Figures... 109
Chapter 5: Conclusions and Future Directions... 118
5.1 Conclusions ... 118
5.2 General recommendations ... 120
References ... 121
Appendices ... 153
Appendix A ... 154
Appendix B ... 172
vii LIST OF TABLES
Table 1.1 Heritability of meat quality and carcass composition traits ...23 Table 2.1 Descriptive statistics for growth, meat quality, primal weight and primal
yield traits: abbreviations, number of animals per trait (n), mean, SD, minimum (Min), maximum (Max) values of TML ...49 Table 2.2 Descriptive statistics for growth, meat quality, primal weight and primal
yield traits: abbreviations, number of animals per trait (n), mean, SD, minimum (Min), maximum (Max) values of TML ... 50 Table 2.3 Heritabilities (h2), genetic variance (σ2
a), pen variance (σ2p), residual variance
of female (σ2
f), residual variance of male (σ2m) of growth, meat quality, primal
weight and primal yield traits of TML ... 51 Table 2.4 Heritabilities (h2), genetic variance (σ2
a), pen variance (σ2p), residual variance
of female (σ2
f), residual variance of male (σ2m) of growth, meat quality, primal
weight and primal yield traits of SPG ... 53 Table 2.5 Genetic correlation (rg) and heritability estimate for male (h2m) and female
(h2
f) for growth, meat quality, primal weight and primal yield traits of TML ...54
Table 3.1 Descriptive statistics of carcass composition and meat quality traits: acronym,
means, standard deviation (SD) values ...77 Table 3.2 Genetic correlation of carcass composition traits and meat quality traits with
alpha diversity at weaning (alpha_w), week 15 (alpha_mid) and end of test
(alpha_off). ...78 Table 3.3 Estimates of microbial correlation (above diagonal) and genomic correlation
(below diagonal) at Mid-test among meat quality and carcass composition traits. ...79 Table 3.4 Estimates of microbial correlation (above diagonal) and genomic correlation
(below diagonal) at end of test among meat quality traits. ...80 Table 3.5 Estimates of microbial correlation (above diagonal) and genomic correlation
(below diagonal) at end of test among carcass composition traits ...81 Table 3.6 Estimates of microbial correlation between meat quality traits and carcass
composition traits at Off test ...82 Table 4.1 Descriptive statistics of carcass composition and meat quality traits: acronym,
viii Table S.A1 Significance of the fixed and random effects included in the models for the
analysis of growth, meat quality, primal weight and primal yield traits of TML ....154
Table S.A2 Significance of the fixed and random effects included in the models for the analysis of growth, meat quality, primal weight and primal yield traits of SPG ...155
Table S.A3 Heritabilities (h2), genetic variance (σ2 a), pen variance (σ2p), residual variance of female (σ2 f), residual variance of male (σ2m) of growth, meat quality, primal weight and primal yield traits of TML ...156
Table S.A4 Heritabilities (h2), genetic variance (σ2 a), variance of harvest batch (σ2h), residual variance of female (σ2 f), residual variance of male (σ2m) of growth, meat quality, primal weight and primal yield traits of SPG. ...158
Table S.A5 Estimates of Genetic correlation (above diagonal) and phenotypic correlation (below diagonal) for meat quality traits of TML. ...159
Table S.A6 Estimates of Genetic correlation (above diagonal) and phenotypic correlation (below diagonal) for meat quality traits of TML. ...159
Table S.A7 Genetic correlation of meat quality and growth traits for TML ...160
Table S.A8 Phenotypic correlation of meat quality and growth traits for TML ...160
Table S.A9 Genetic correlation of meat quality and growth traits for SPG ...161
Table S.A10 Phenotypic correlation of meat quality and growth traits for SPG ...161
Table S.A11 Genetic Correlation of meat quality and primal yield traits for TML ...162
Table S.A12 Phenotypic correlation of meat quality and primal yield traits for TML ...163
Table S.A13 Genetic correlation of meat quality and primal yield traits for SPG ...164
Table S.A14 Phenotypic correlation of meat quality and primal yield traits for SPG...164
Table S.A15 Genetic correlation (above diagonal) and phenotypic correlation (below diagonal) of primal weight traits of TML ...164
Table S.A16 Genetic correlation (above diagonal) and phenotypic correlation (below diagonal) of primal weight and primal yield traits of SPG ...165
ix Table S.A18 Genetic correlation of primal weight and primal yield traits with growth traits
of TML ...167
Table S.A19 Phenotypic correlation of primal weight and primal yield traits with growth traits of TML ...…168
Table S.A20 Genetic correlation of primal weight and primal yield traits with growth traits of SPG. ...169
Table S.A21 Phenotypic correlation of primal weight and primal yield traits of SPG ...169
Table S.A22 Genetic correlation among male and female, heritability estimates for male and female for growth, meat quality, primal weight and primal yield traits of TML ...170
Table S.B1 Diet formulae and their nutritional values ...172
Table S.B2 Vaccinations ...174
Table S.B3 Injectable and medications ...174
Table S.B4 Water medications ...174
Table S.B5 Distribution of samples across families, sex, and time points ...175
Table S.B6 Variance components explained by microbiome relationship matrix (O), genomic relationship matrix (G), pen (P), residual (R), microbiability (m2) and heritability (h2) in different models1 ...176
Table S.B7 Estimates of genomic correlation (below diagonal) at end of test among meat quality ...179
Table S.B8 Estimates of genomic correlation (below diagonal) at end of test among carcass composition……… .179
Table S.B9 Estimates of genomic correlation between meat quality and carcass composition traits with inclusion of microbiome ...….180
Table S.B10 Estimates of genomic correlation between meat quality traits and carcass composition traits without inclusion of microbiome ...180
x Table S.C2 Number of significant markers of each fold of cross-validation and the number of common markers for each trait at each stage within each fold ...183 Table S.C3 Predictive ability of different traits for each fold at different complexity,
xi LIST OF FIGURES
Figure 2.1 Genetic correlation (upper diagonal) and phenotypic correlation (lower diagonal) among meat quality traits for TML (A) and SPG (B), Genetic correlations of meat quality trait with growth traits for TML (C) and SPG (D), Genetic correlations of meat quality traits with carcass traits for TML (E) and SPG (F). Blank spaces represent non-significant correlation. Size of point represents the strength of correlation and color represents the
direction of correlation. ...56 Figure 2.2 Genetic correlation (upper diagonal) and phenotypic correlation (lower
diagonal) among carcass traits for The Maschhoffs population (A), Genetic correlation among carcass traits and growth traits (B). Blank spaces represent non-significant correlation. Size of point represents the strength of correlation
and color represents the direction of correlation. ...57 Figure 3.1 (A) Venn diagram with the numbers of common operational taxonomic units
(OTU) among weaning, mid test and off test. (B) Distribution of alpha diversity index among weaning, mid test and off test. X- axis represents the different age group and Y-axis represent the alpha diversity index of each
sample for each group. ...83 Figure 3.2 Proportion of variance explained by microbiome relationship matrix (O),
genomic relationship matrix (G) and pen (P) for meat quality traits. Model 0 contains G matrix and pen effect as random effect, Model 1, Model 2 and Model 3 contains O matrix at weaning, Mid-test and Off-test in addition to
G matrix and pen effect ...84 Figure 3.3 Proportion of variance explained by microbiome relationship matrix (O),
genomic relationship matrix (G) and pen (P) for carcass composition traits. Model 0 contains G matrix and pen effect as random effect, Model 1, Model 2 and Model 3 contains O matrix at weaning, Mid-test and Off-test in addition
to G matrix and pen effect ...85 Figure 4.1 Overall experimental design. FULL contains all available markers and
operational taxonomic units (OTU), IR contain informatively reduced markers and OTU, RR contains randomly reduced markers and OTU, NULL is base line model, M_mod contains microbiome information in addition to NULL model, G_mod contains genomic information in addition to NULL model, GM_mod contains microbiome and genomic information in addition to NULL model and G×M_mod contains genomic, microbiome and interaction of
genome-by-microbiome information in addition to NULL model. ...109 Figure 4.2 Pictorial representation of analysis to obtain informatively reduced markers
xii Figure 4.3 Variance components estimates of carcass traits for model containing only
genomic information (G_mod) and microbiome, genomic and genotype-by-microbiome interaction (G×M_mod) at different stages of production (Wean, Mid-test and Off-test) with different sets of markers and operational taxonomic units (OTU) counts (FULL: contain all available markers and OTU, IR: contain informatively reduced markers and OTU, and RR: contain randomly reduced markers and OTU). Each bar shows different model with the proportion of variance explained by microbiome relationship matrix (M), genomic relationship matrix (G) and pen (P). G_mod contains G matrix and pen effect as random effect; Wean, Mid-test and Off-test contains M matrix and interaction of M
and G at weaning, Mid-test and Off-test in addition to G matrix and pen effect ....111 Figure 4.4 Variance components estimates of meat quality traits for model containing only
genomic information (G_mod) and microbiome, genomic and genotype-by-microbiome interaction (G×M_mod) at different stages of production (Wean, Mid-test and Off-test) with different sets of markers and operational taxonomic units (OTU) counts (FULL: contains all available markers and OTU, IR: contains informatively reduced markers and OTU, and RR: contain randomly reduced markers and OTU). Each bar shows different model with the proportion of variance explained by microbiome relationship matrix (M), genomic
relationship matrix (G) and pen (P). G_mod contains G matrix and pen effect as random effect; Wean, Mid-test and Off-test contains M matrix and interaction of M and G at weaning, Mid-test and Off-test in addition to G
matrix and pen effect. ...112 Figure 4.5 Predictive ability of carcass traits. Each bar shows different model with
standard deviation at different complexities (Full (Panel A) with all markers and operational taxonomic units (OTU), Informatively reduced (Panel B) with significant markers and OTU and Randomly reduced (Panel C) with randomly selected markers and OTU). Dashed line represents the prediction accuracy of NULL model which contains only random effect as pen. G_mod contains genomic relationship matrix in addition to NULL model. M_mod contains microbiome relationship matrix at Wean, Mid-test and Off-test in addition to NULL model. GM_mod contains genomic relationship matrix and microbiome relationship matrix at Wean, Mid-test and Off-test in addition to NULL model. G×M_mod contains both the main effect of microbiome relationship matrix and genomic relationship matrix and interaction between
them in addition to NULL model. ...113 Figure 4.6 Predictive ability of meat quality traits. Each bar shows different model with
xiii genomic relationship matrix in addition to NULL model. M_mod contains
microbiome relationship matrix at Wean, Mid-test and Off-test in addition to NULL model. GM_mod contains genomic relationship matrix and microbiome relationship matrix at Wean, Mid-test and Off-test in addition to NULL model. G×M_mod contains both the main effect of microbiome relationship matrix and genomic relationship matrix and interaction between
them in addition to NULL model ...114 Figure 4.7 Mean squared error of prediction of carcass traits. Each point shows average
mean squared error of different model with standard deviation at different complexity (Full (Panel A) with all markers and operational taxonomic units (OTU), Informatively reduced (Panel B) with significant markers and OTU and Randomly reduced (Panel C) with randomly selected markers and OTU).
M_mod contains microbiome relationship matrix at Wean, Mid-test and Off-test. G_mod contains genomic relationship matrix. GM_mod contains genomic relationship matrix and microbiome relationship matrix at Wean, Mid-test and Off-test. G×M_mod contain both the main effect of microbiome relationship
matrix and genomic relationship matrix and interaction between them ...115 Figure 4.8 Mean squared error of prediction of meat quality traits. Each point shows
average mean squared error of different model with standard deviation at
different complexity (Full (Panel A) with all markers and operational taxonomic units (OTU), Informatively reduced (Panel B) with significant markers and OTU and Randomly reduced (Panel C) with randomly selected markers and OTU). M_mod contains microbiome relationship matrix at Wean, Mid-test and Off-test. G_mod contains genomic relationship matrix. GM_mod contains genomic relationship matrix and microbiome relationship matrix at Wean, Mid-test and Off-test. G×M_mod contain both the main effect of microbiome relationship matrix and genomic relationship matrix and interaction
between them ...116 Figure 4.9 Least Square Means and standard error (SE) for main effects and interactions
for the post analysis of the experimental design. Model (5 levels: Null, M_mod, G_mod, GM_mod, G×M_mod), Stage (3 levels: Wean, Mid test and Off test), Complexity (3 levels: FULL, IR (Informatively reduced), RR (Randomly reduced)), Trait (15 levels: FD, CADG, LD, HAM, LOIN, BEL, IMF, SMARB, MINA, MINB, MINL, pH, SSF, SFIRM). All elements with (:)
1 CHAPTER 1: Literature Review
1.1 Introduction
2 1.2 Genomic selection
Marker-assisted selection using molecular marker data has been proposed in the past as a way to increase the accuracy of selection in pigs. Nonetheless its application remained limited since markers typically capture only a limited proportion of total genetic variance. This can be overcome by using high-density markers across the entire genome to capture total genetic variance for a particular trait of interest. This method was termed genomic selection by Meuwissen et al. (2001). Genomic selection exploits linkage disequilibrium. Since the markers are in LD with QTL, it is assumed that the effect of the chromosome segments will be same across the population. Hence, the marker density must be sufficiently high to ensure that all QTL are in LD with a marker or haplotype of markers Meuwissen et al. (2001). Genomic selection has become possible with the availability of thousands of markers and high throughput genotyping technology.
Genomic selection needs a reference population that has genotypic and phenotypic information to derive a prediction equation of genomic estimated breeding values (GEBV) for selection candidates that have marker information without phenotypic record (Goddard and Hayes, 2009). To predict GEBV for animals with genotypes but no phenotypes, the effect of the chromosome segments they carry can be summed across the genome:
GEBV = ∑ 𝑋 𝑔
3 increase in rate of genetic gain by decreasing the generation interval especially for animals having long generation interval like cattle and reducing the genotyping cost. Although the generation interval in swine is not large as compared to cattle, it is useful for meat quality traits, which could be measured only after the pigs are slaughtered. The accuracy of selection will be increased with selecting the animal with genotypes instead of selecting the animals with only phenotypic information and information from their relatives using traditional BLUP (Meuwissen et al., 2001). 1.2.1 Genomic Best Linear Unbiased Prediction (GBLUP) method
The genomic best linear unbiased prediction (GBLUP) method utilizes the genomic relationships to estimate the genetic merit of an individual. For this method, genomic relationship matrix is used, which is estimated from DNA marker information (Clark and van der Werf, 2013). This method was first proposed by Nejati-Javaremi et al. (1997). They compared the method of estimating breeding values with the use of total allelic relationship to the pedigree-derived additive genetic relationship. They concluded that using total allelic relationship gives more accurate breeding values than using pedigree-derived additive genetic relationship matrix because it accounts the average measures of relationship and identity in state of alleles, which eventually reduces the sources of variance of prediction. The model for GBLUP sums the SNP effect and estimate GEBV as the sum of these effects with the assumption that the markers are normally distributed as Hayes and Goddard, (2010). The model could be written as:
y = 1 µ + Zg +e
where y is a vector of phenotypes, µ is the mean, 1 is a vector of ones, n is the number of observations, Z is a design matrix allocating records to breeding values, g is a vector of breeding values and e is a vector of residual error with assumption of N (0, 𝜎 ). Here, g = Wu where 𝑢 is
4 ith animal and jth SNP, where 𝑤 = 0 - 2𝑝 if the animal is homozygous AA at jth SNP, 1 - 2𝑝 if
the animal is heterozygous, and 2 - 2𝑝 if the animal is homozygous aa at the jth SNP. In GBLUP
the breeding values could be predicted as shown:
[𝑔] = 𝑍 𝑍 𝐺 [𝑍 𝑦]
where G is genomic relationship matrix, 𝜎 is error variance and 𝜎 is genetic variance and other elements are as described above. This method is useful for the populations without good pedigree records where the genomic relationship matrix captures the relationship information among the genotyped individual. VanRaden et al. (2009) reported the increase in breeding value accuracies of 20-50% with the use of genomic relationship matrix in comparison to use of pedigree relationship matrix in dairy cattle.
1.2.2 Ridge regression
In order to overcome the problem of over-estimation of segment effects in marker assisted selection, Whittaker et al. (2000) proposed ridge regression for the prediction in quantitative genetics. Ridge regression assumes that all marker effects are normally distributed with equal variance. In ridge regression, estimates of marker effect are shrunk towards zero to avoid the over-estimation of these effects. Ridge regression uses the mixed model equation with the shrinkage parameter (λ) to the diagonal elements of least squares equation as shown in equation:
𝑋 𝑅 𝑋 𝑋 𝑅 𝑍
𝑍 𝑅 𝑋 𝑍 𝑅 𝑍 + 𝐼λ
𝛽
𝑏 =
𝑋 𝑅 𝑦
𝑍 𝑅 𝑦
5 Ridge regression is not appropriate to estimate the SNP effects for QTL mapping because the same magnitude of shrinkage is applied to all SNPs (Xu, 2003). Since, all of the loci in genome did not contribute equally to the phenotypes, those SNPs which have least to almost no contribution should be penalized more in the analysis. This idea leads to development of current Bayesian methods (Meuwissen et al., 2001).
1.2.3 Bayesian methods
The data were modeled in two levels in bayesian methods. The first is at the level of data and second is at the level of variance of chromosome segments. The first one at level of data is shown below:
y = µ1 + 𝑋 𝑔 + e
where y is the data vector, µ is the overall mean, 1 is a vector of n (n= number of records) ones,
𝑔 represents the genetic effects of the haplotypes at the ith segments with 𝑔 ~ (0, 𝜎 ). The second
level of model is at the variances of chromosome segments. Meuwissen et al. (2001) described that many QTL in the chromosome segments have small effect and few with large effect. The prior distribution was scaled inverted chi-square distribution, prior (𝜎 ) ~ χ (υ, S), where S is the scale
6 variances of SNP effects, with many SNP having contribution zero effect and few contribute large effect on a trait (Meuwissen et al., 2001). It considers a proportion п of the markers having zero effect. The distribution of variances of the effect of markers could be written as: 𝜎 = 0 with
probability п and 𝜎 ~ χ (υ,S), with probability (1- п). This approach needs less computational
time than Bayes A because it excludes the loci with no effect on quantitative trait of interest. The Bayes C method was developed by Kizilkaya et al. (2010). New approaches of Bayes Cп and Bayes Dп have been described by Habier et al. (2011) as extension of Bayes C approach. The Bayes C method differs from Bayes B by assuming common variance for all markers. In Bayes C, the probability п that a SNP has a nonzero effect is assumed to be known. The model assumed homogenous variance of effects on all loci: 𝜎 = 0 with probability 1- п; 𝜎 ~ χ (υ, S). In Bayes
C, the probability п that a SNP has a nonzero effect is assumed to be known. Habier et al. (2011) modified the Bayes C and Bayes D where the probability п of has been estimated. The prior distribution of п becomes uniform over [0,1]. Similar to Bayes C, the SNP model is: P(𝑔|п, 𝜎 )
= 0 with a probability of 1 – п; P(𝑔|п, 𝜎 ) ~ N(0, 𝜎 ) where P (𝜎 ) ~ χ (υ, S) with probability
7 1.2.4 Single step versus multiple step BLUP for genomic selection
Misztal et al. (2009) proposed single step method for genomic evaluation in which pedigree-based relationship matrix was integrated with genomic relationship matrix into single matrix (H) matrix. The joint relationship matrix based on pedigree relationship and genomic relationship was proposed by Legarra et al. (2009). Single step method is simple, faster, more accurate with less error and applicable to complicated model complicated to multiple step method (Aguilar et al., 2010). Multi step procedure involve evaluation using traditional pedigree BLUP, extraction of pseudo-observations for genotyped individuals, estimation of allelic effect for each SNP and combination of parent average with the genomic prediction (VanRaden, 2008a). However, single step method utilizes phenotypic records, genotype and pedigree simultaneously to derive GEBV (Misztal et al., 2013). Single step method is faster and less prone to errors. So, Single step GBLUP has been successfully implemented in large scale analyses of dairy (Tsuruta et al., 2011; VanRaden, 2012) and pigs (Forni et al., 2011; Christensen et al., 2012) with less inflation of GEBV than multi steps procedure.
1.2.5 Factors affecting the genomic selection
Major factors affecting genomic selection are as follows: i) Number of markers required
8 (2008) evaluated the effect of the average LD between adjacent marker pairs on the accuracy of genomic selection.
ii) Number of phenotypic records in the reference population
The accuracy of genomic selection depends on the number of haplotype effects at the chromosome segments, and the number of phenotypic records per unique haplotype, of per marker allele if single markers are used. Higher accuracy is obtained if more phenotypic records are available because of the presence of more number of observations per haplotype (Meuwissen et al., 2001). Furthermore, Meuwissen et al. (2001) reported that accuracy of least squares, BLUP and Bayes B increased with more phenotypic records.
1.3 Genetics of meat quality and carcass traits
Estimation of genetic parameters such as heritability, genetic correlation and variance components are necessary for the improvement of meat quality and carcass traits. Various factors like population size, breeds, genomic information, pedigree, environmental factors and statistical model affect the variance components (Khanal et al., 2019). Estimates of heritability of meat and carcass quality traits and genetic correlation among these traits has recently received attention (Miar et al., 2014a). The published estimates of heritability of meat quality and carcass composition traits are presented in Table 1. All of these studies were conducted only with pedigree information. To the best of my knowledge, studies on estimation of heritabilities and genetic correlation with the inclusion of both pedigree and genomic information is lacking, particularly in crossbred swine.
9 however their magnitude depends upon the breed (Ducos et al., 1993; De Vries et al., 1994). The range of correlations among meat quality and carcass traits were wide in both positive and negative direction ( Van Wijk et al., 2005; Miar et al., 2014a; Miar et al., 2014b). Marbling and color traits are important traits as these could be visually seen by the consumers (Wilson et al., 2017). Marbling score had high correlation with intramuscular fat. Intramuscular fat had high correlation with color traits (Hermesch et al., 2000) indicating the pale color of meat when the intramuscular fat is high which implied that the pale color might be due to intramuscular fat in pork. pH, another important meat quality traits had high positive correlation with color traits (Hovenier et al., 1992). The genetic correlations among carcass traits were high (Lo et al., 1992; Hermesch et al., 2000; Van Wijk et al., 2005; Miar et al., 2014a; Miar et al., 2014b). Van Wijk et al. (2005) reported that fat depth was negatively correlated with primal cuts and selection of lean meat did not affect the meat quality traits. Furthermore Van Wijk et al. (2005) also reported that the subjective or objective color traits were favorably correlated with lean meat. Favorable correlation of meat quality traits and primal cuts were found by Van Wijk et al. (2005) and (Miar et al. (2014a). There were no significant correlations between meat quality traits and average daily gain and loin depth (De Vries et al., 1994; Suzuki et al., 2005; Miar et al., 2014b). However, Van Wijk et al. (2005) reported that average daily gain has a detrimental effect on pork quality. To the best of my knowledge, correlations of meat quality traits and primal yield traits (proportion of primal cuts to total hot carcass weight) has not been studied.
1.4 Microbiome
10 microbial components. In early time, microbes have been viewed as pathogens affecting health. However, the understanding of microbiome is increased as a concept of animal “flora” in the past few decades due to advancement in genomic sequencing technologies and “omics” (e.g., proteomics, transcriptomics, metabolomics) (Mach et al., 2015a; Zhao et al., 2015).
1.4.1 Development of gut microbiome in pigs
The gastrointestinal tract of piglet is sterile during parturition. Gut microbiota starts developing rapidly. Initially the gut microbes in newborn piglets come from sows or environment (Ducluzeau, 1983) and there is possibility of having similar gut microbiota to that of sows as they are in close contact with sows through different means (Nowland et al., 2019). Then the gut microbes shift remarkably in early age (Wang et al., 2019) and become unique and characteristic to each individual (Nowland et al., 2019), which is governed by various internal and external factors as host genotype, diet, antibiotics. The growth of bacteria is followed by different successional step where abundant bacteria become predominant in the gut. The succession continues until there is stable bacteria ( Zoetendal et al., 2001; Thompson et al., 2008). Initially, the suckling piglets were represented by aerobes and facultative anaerobes from the sow and environment. In very early age, Escherichia coli, Lactobacilli, Streptococci and Shigella
constituted as the dominant bacterial species in gut (Swords et al., 1993; Fouhse et al., 2016). As time passes, these bacteria consume oxygen and creates the anaerobic environment. Lactobacilli
and Streptococci become more dominant. The anaerobic bacteria are diversified in the distal part
of gut where predominant species are Bacteroides, Eubacterium, Peptostreptococcus and
Clostridium (Tannock, 1990; Dicksved et al., 2015). The number of bacteria in pig colon has been
estimated to be 1010-1011 per gram of the gut content (Guevarra et al., 2019). Guevarra et al. (2019)
11 the change in diet and due to the stress. The weaning transition affects the overall health and growth performance of the individual throughout the life and is critical to understand the dynamic of gut microbiome at this phase of life (Lu et al., 2018).
1.4.2 Diversity of gut microbiota
There are different ways to measure the microbial diversity in pigs. Whittaker (1960) proposed the terminology alpha, beta and gamma diversity. Two most common measure of diversity in pigs are alpha (α) and beta (β) diversity. Alpha diversity is the measure of diversity within sample. Alpha diversity can be measured by Shannon, Simpson and Chao1 indices. These indices are unitless and only useful to compare samples or group of samples. Alpha diversity measures the species richness and species diversity. The term “species richness” was first introduced by (McIntosh, 1967) and is estimated as dividing the number of species by the geographical area (Simpson, 1964). Species diversity is a measure of diversity which accounts for both the number of species present and relative abundance of each species. Species richness is easier to measure than species diversity, as measuring diversity requires measurement of species richness, species evenness and species abundance (Sanjit and Bhatt, 2005). The Shannon diversity index was measured as:
− 𝑝 𝑙𝑛(𝑝 )
where 𝑝 was the proportional abundance of ith OTU (Ortiz-Burgos, 2016). This is always a
positive value, ranging from zero to log (number of species) and is considered as the best method to estimate the diversity (Kim et al., 2012). Higher value of Shannon index indicates greater diversity. Simpson’s diversity index was measured as:
12 where n is the total number of organisms of species of each type and N is the total number of organisms of all species (Simpson, 1949; Lemos et al., 2011). It varies from 0 to 1 and the index increases as the diversity increases. Chao 1 richness estimator is the non-parametric that calculates the minimal number of OTUs present in the sample (Chao, 1984). Chao 1 was estimated as:
𝑆 = 𝑆 + ( )
( )
where 𝑆 is the number of observed species, 𝐹 and 𝐹 are the count of singletons and doubletons, respectively (Chao, 1984). Chao richness estimator gives more weight to singleton and doubletons to estimate the number of missing species. So, this index is particularly used for data skewed towards the low-abundance species (Hughes et al., 2001). The abundance-based coverage estimator (ACE) is a nonparametric method for estimating the number of species using sample coverage, which is derived as:
𝑆 = 𝑆 + + 𝛾
where 𝑆 and 𝑆 are the number of abundant and rare OTUs respectively, 𝐶 is the sample abundance coverage estimator, 𝐹 is the frequency of singletons and 𝛾 is the estimated coefficient of variation for rare OTUs (Chao and Lee, 1992; Kim et al., 2017).
13 to estimate beta diversity. The best way to visualize beta-diversity is by non-metric multidimensional scaling (nMDS). This is similar to principle component analysis. However, nMDS is statistically more robust, with multiple iterations (Kruskal, 1964).
Alpha diversity is related to better gut health in human (Le Chatelier et al., 2013) and higher alpha diversity helps to predict the disease condition in human (Prehn-Kristensen et al., 2018). There was increase in alpha diversity with the increase in age (Kim et al., 2011; Looft and Allen, 2012; Frese et al., 2015; Odamaki et al., 2016; Chen et al., 2017). Variation in gut microbe diversity has been found in different breeds of pig (Yang et al., 2014) and in different stages of production (Lu et al., 2018) and different location of intestine (Isaacson and Kim, 2012).
As the host genetics affects the gut microbiome to some extent the diversity in microbiome is treated as separated traits (Camarinha-Silva et al., 2017) and different studies (Dou et al., 2017; Lu et al., 2018) have explained the relationship of alpha diversity with the complex phenotypes . Sandoval-Motta et al. (2017) reported that the microbial diversity of intestine accounted for significant amount of phenotypic variation for any trait in human and should be accounted when assessing the heritability not only in human but also in plants and livestock. Lu et al. (2018) reported that alpha diversity is strongly correlated with back fat thickness and average daily gain in swine. Higher alpha diversity has been associated with reduced susceptibility to post-weaning diarrhea (Dou et al., 2017).
1.4.3 Microbiome genomics and bioinformatics
14 more comprehensive sampling of all genes in all organisms present in a given complex sample. This method enables us to evaluate bacterial diversity and detect the abundance of microbes in various environments.
i) Microbiome profiling by amplicon sequencing
15 microbiota analysis with the help of ITS amplicon sequencing does not look like exactly the same sequence but grouped based on similar sequence, there could be loss of accuracy in determining the biological variation among different sequences. To differentiate the biological and technical sequence variation, Dada2 (Callahan et al., 2016) and Deblur (Amir et al., 2017) has been implemented in QIIME2 (Caporaso et al., 2010), a software package for 16S rRNA analysis. Dada2 and Deblur provides the sensitive means to assess ecological patterns driven by differentiation of closely related taxa. Briefly, these tools generate error profiles of amplicon sequence and use this profile to resolve the sequencing pair. Recently, it was found that amplicon sequence variants (ASV) provides more sensitivity and specificity and reduced the problem of falsely identifying OTU due to error in clustering (Callahan et al., 2017).
ii) Microbiome profiling by shotgun metagenomics sequencing
16 1.4.4 Data processing of microbiome count data
High throughput sequencing technologies described in previous sections has been advantageous for understanding the microbial communities. However, processing and interpretation of data is complicated because of several statistical challenges (Weiss et al., 2017). After quality control steps for sequencing error, microbial sequencing data is organized into table where column represents sample and row represents counts of clustered sequences known as operational taxonomic units (OTUs). Most often vast difference in total number of sequences per sample is found even though the samples are sequenced in the same sequencing machine at same time. Difference in the counts may be due to the differential sequencing efficiency of machine rather than true biological variation. OTU table could be sparse due to insufficient sequencing depth to detect some sample and some organisms are found in only a small percentage of samples (Paulson et al., 2013). Total number of reads does not represent the absolute number of microbes per sample as the sample is only a part of total environment (Weiss et al., 2017). To address these issues, normalization of the data is done via different methods prior to downstream analysis. Normalization is the process which identify and remove the systematic technical differences between samples that occur in data and ensure minimal impact on results by technical bias (González-Recio et al., 2014). For normalization an appropriate baseline is chosen and the OTU counts are expressed relative to that baseline. Weiss et al. (2017) and McMurdie and Holmes (2014) described different normalization methods which are:
17 the statistical power as some data is removed and this does not address the challenge of compositional microbiome data (Gloor et al., 2017).
ii) Cumulative Sum Scaling: Cumulative sum scaling enables scaling of sample by specific percentile of its count distribution and counts are log transformed. This method scales the segment of each sample’s count distribution that is relatively similar across samples. This method is useful to remove the influence of larger count values in the OTU table.
iii) Variance stabilization: In this method, a scaling factor for each OTU is calculated by dividing OTU count by geometric mean across all samples. Then, all reads of each sample are divided by the median of scaling factors for that sample. Using the scaled count for OTUs, negative binomial distribution general linear model is used to adjust the matrix counts such that the variance in an OTU’s counts across samples is independent of mean (Weiss et al., 2017).
iv) Trimmed Mean of M-values (TMM): Robinson and Oshlack (2010) proposed this method. The scaling factor of trimmed mean is the average by removing the upper and lower counts. This minimizes the log-fold change between samples for most OTUs. The TMM scaling factors are usually around 1. The normalization factors for each sample are the product of the TMM scaling factor and the original library size. This method assumes that most microbes are not differentially abundant and even if those are, there is an approximately balanced amount of change in abundance. So, these methods are not appropriate for highly diverse microbes.
1.4.5 Function of gut microbiome in pig
18 from undigested feed components from the gut through fermentation and providing the basis for a barrier that prevents pathogenic bacteria from invading through gut epithelium, perform protective function together with host immune system (Salminen et al., 1998). The two major functions are: i) Nutritional function
Gut microbiota metabolizes various foods and provide nutritional compound to the host in the form of fermentation end-products and other by-products such as short chain fatty acid (SCFAs), amino acids, vitamin B and K, and indole derivatives (Feng et al., 2018). Den Besten et al. (2013) reported that bacteria generate SCFAs like acetate, propionate, butyrate, formate, valerate, capronate etc. SCFAs play important role in maintaining the morphology and functions of epithelial cells. Specifically, SCFAs reduce the luminal pH and enhance the nutrient absorption by gut epithelial cell proliferation and differentiation, which result in increased intestinal villus height (Khan et al., 2016). Shibata et al. (2017) reported that SCFAs help in inhibition of pathogenic bacteria of host. Short chain fatty acids act as a specific G protein coupled receptor signaling molecule which help in the process of gluconeogenesis (Den Besten et al., 2013; Khan et al., 2016). Other by-products of fermentations like vitamins, indole derivatives help in growth and development of the intestine and improves the absorption of nutrients (Khan et al., 2016). ii) Immune function
19 (Hooper et al., 2002). Gut microbiota acts on intestinal permeability, glycosylation of the intestinal cell layer, which helps in resistance to infection and expression of microbiocidal and angiogenins (Pickard et al., 2017). Hooper et al. (2001) reported that gut microbiota influences the gene expression of the epithelium which could be responsible for the immunity. “Mucosal firewall” has been termed by Macpherson et al. (2009) for the combined action of the epithelial cells, mucus, IgA, immune cells. Generally, the “mucosal firewall” is beneficial but some interactions of bacteria and host mucosa might lead to diseased conditions like Crohn’s disease or ulcerative colitis (Joossens et al., 2011). The hematopoietic and non-hematopoietic cells of innate immune system are located on host-microbiome interface, which has the ability to sense the metabolic products that translates the signal to the physiological response of host (Thaiss et al., 2016). Tang et al. (2019) reported that the loss of gut microbiome alters the immune system. Smaller quantities of Peyer’s patch, mesenteric lymph node, gut-associated lymphoid tissue is found in germ-free animals (Iebba et al., 2012). Furthermore, previous researchers (Turnbaugh et al., 2009; Cahenzli et al., 2013; Markle et al., 2013) reported that those animals with disrupted microbiota or reduced microbial diversity are with increased risk of obesity, cardiovascular disease, asthma and autism.
1.4.6 Effect of microbiome on host
20 those relationship are unknown. The gut microbiome of all animals influence the physiology and fitness of host such as growth and development (Gould et al., 2018).
21 in pigs. Fang et al. (2017) reported that the gut microbiota is associated with intramuscular fat in swine. The authors also suggested the possibility of improving the intramuscular fat by altering the gut microbiota. Wang et al. (2019) reported that swine health and production could be improved by governing gut microbiome at different stages of life. All of these studies show that gut microbiome affect the complex phenotypes, which indicated that microbiome information should be included in the statistical model for genomic evaluation. Ross et al. (2013) and Rothschild et al. (2018) also reported that for the prediction of complex traits which are associated with microbiome require the metagenomic information in addition to genomic information for the maximization of prediction accuracy in bovine and human respectively.
Genetic variation of the host is responsible in shaping the composition of gut microbiome in human indicating the presence of interaction between microbiome and genetics (Blekhman et al., 2015). The evidence of host-microbiome interaction has been reported in human, dairy cattle and mice (Kostic et al., 2013; Ross et al., 2013), which highlighted the possibility of host-by-microbiome interaction in swine. All the previous literatures supported the hologenome theory of evolution which considers the individual animal or plant as a “holobiont”- the combination of host plus microbes. From the hologenome theory it could be inferred that variation in microbiome and genome are the source of variation for complex traits on which artificial, natural selection and genetic drift can act (Zilber-Rosenberg and Rosenberg, 2008; Bordenstein and Theis, 2015). 1.5 Conclusion
22 Chapter 2: The objectives of this chapter were to estimate the heritabilities for different carcass composition traits and meat quality traits, and to estimate the genetic and phenotypic correlations between the meat quality, carcass composition, and growth traits in two large commercial crossbred swine populations using genotypes and phenotypes data.
Chapter 3: The objectives of this study were to estimate the microbiabilities for different meat quality and carcass composition traits; to investigate the impact of gut microbiome on heritability estimates; to estimate the correlation between microbial diversity and meat quality and carcass composition traits; and to estimate the microbial correlation between the meat quality and carcass composition traits in commercial swine population.
Chapter 4: The objectives of this study were to i) evaluate genomic and microbial predictions of meat quality and carcass traits and ii) to evaluate the effect of host-microbiome interaction on prediction of meat quality and carcass traits in swine.
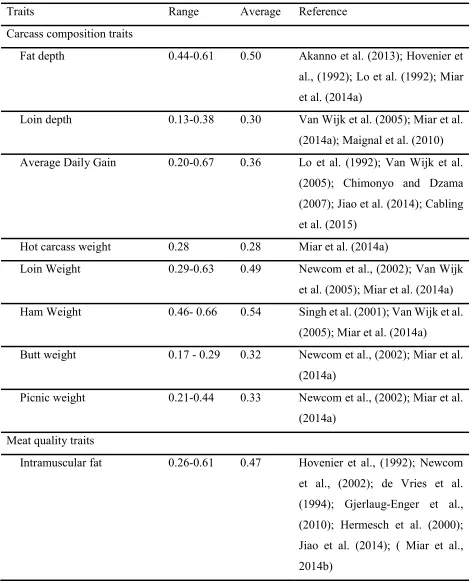
23 Table 1.1. Heritability of meat quality and carcass composition traits.
Traits Range Average Reference
Carcass composition traits
Fat depth 0.44-0.61 0.50 Akanno et al. (2013); Hovenier et al., (1992); Lo et al. (1992); Miar et al. (2014a)
Loin depth 0.13-0.38 0.30 Van Wijk et al. (2005); Miar et al. (2014a); Maignal et al. (2010) Average Daily Gain 0.20-0.67 0.36 Lo et al. (1992); Van Wijk et al.
(2005); Chimonyo and Dzama (2007); Jiao et al. (2014); Cabling et al. (2015)
Hot carcass weight 0.28 0.28 Miar et al. (2014a)
Loin Weight 0.29-0.63 0.49 Newcom et al., (2002); Van Wijk et al. (2005); Miar et al. (2014a) Ham Weight 0.46- 0.66 0.54 Singh et al. (2001); Van Wijk et al.
(2005); Miar et al. (2014a)
Butt weight 0.17 - 0.29 0.32 Newcom et al., (2002); Miar et al. (2014a)
Picnic weight 0.21-0.44 0.33 Newcom et al., (2002); Miar et al. (2014a)
Meat quality traits
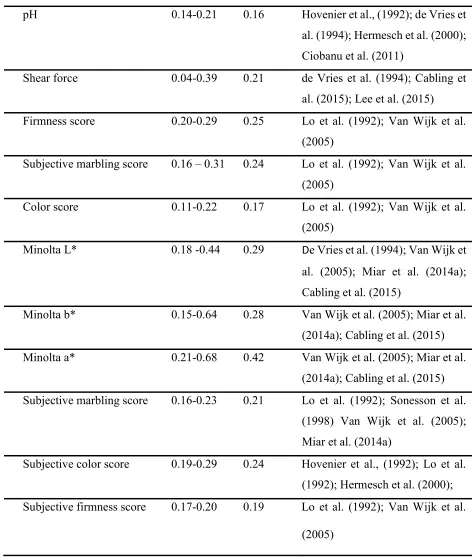
24 Table 1. (continued)
pH 0.14-0.21 0.16 Hovenier et al., (1992); de Vries et
al. (1994); Hermesch et al. (2000); Ciobanu et al. (2011)
Shear force 0.04-0.39 0.21 de Vries et al. (1994); Cabling et al. (2015); Lee et al. (2015) Firmness score 0.20-0.29 0.25 Lo et al. (1992); Van Wijk et al.
(2005)
Subjective marbling score 0.16 – 0.31 0.24 Lo et al. (1992); Van Wijk et al. (2005)
Color score 0.11-0.22 0.17 Lo et al. (1992); Van Wijk et al. (2005)
Minolta L* 0.18 -0.44 0.29 De Vries et al. (1994); Van Wijk et al. (2005); Miar et al. (2014a); Cabling et al. (2015)
Minolta b* 0.15-0.64 0.28 Van Wijk et al. (2005); Miar et al. (2014a); Cabling et al. (2015) Minolta a* 0.21-0.68 0.42 Van Wijk et al. (2005); Miar et al.
(2014a); Cabling et al. (2015) Subjective marbling score 0.16-0.23 0.21 Lo et al. (1992); Sonesson et al.
(1998) Van Wijk et al. (2005); Miar et al. (2014a)
Subjective color score 0.19-0.29 0.24 Hovenier et al., (1992); Lo et al. (1992); Hermesch et al. (2000); Subjective firmness score 0.17-0.20 0.19 Lo et al. (1992); Van Wijk et al.
25 Chapter 2: Genetic Parameters of Meat Quality, Carcass Composition and Growth Traits
in Commercial Swine P. Khanal, C. Maltecca, C. Schwab, J. Fix, and F. Tiezzi (Journal of Animal Science doi: 10.1093/jas/skz247) 2.1 Abstract
26 0.62]. Heritabilities of primal yield traits were higher than that of primal weight traits and ranged from 0.17[0.13, 0.25] for butt yield to 0.45[0.36, 0.55] for ham yield. The genetic correlations of meat quality and carcass composition traits with growth traits ranged from moderate to high in both directions. High genetic correlations were observed for male and female for all traits except pH. The genetic parameter estimates of this study indicate that a multi-trait approach should be considered for selection programs aimed at meat quality and carcass composition in commercial swine populations.
2.2 Introduction
The demand for higher quality meat by consumers has been steadily growing. Both meat quality and carcass composition traits are becoming important in swine breeding programs because of their increased economic value (Dransfield et al., 2005). Until the recent past, producers were paid for the weight of carcass as opposed to the weight of each primal cut (Miar et al., 2014a). Now, the swine industry has focused its attention towards meat quality traits (Dransfield et al., 2005), and producers are aiming at improving intramuscular fat, color, firmness, and different primal cuts (Wijk et al., 2005; Miar et al., 2014a) to meet consumer demand.
27 Gilbert et al., 2007; Cabling et al., 2015) and crossbred swine (Van Wijk et al., 2005; Miar et al., 2014a; Miar et al., 2014b) were conducted only with pedigree information. The results from these studies indicated a wide range of heritability and correlation estimates. Estimates of genetic parameters of meat quality and carcass composition traits which include both phenotypic and genotypic information remain limited, particularly in crossbred swine. The objectives of this study were, therefore: to estimate the heritabilities for different carcass composition traits and meat quality traits; and to estimate the genetic and phenotypic correlations between the meat quality, carcass composition and growth traits in two large commercial crossbred swine populations using genotypes and phenotypes data.
2.3 Materials and Methods
Animal welfare approval was not needed for this study because recorded data came from animals raised in commercial facilities under routine circumstances. Pigs were slaughtered in commercial facilities under the supervision of USDA Food Safety and Inspection Service. Two large commercial crossbred swine populations: The Maschhoffs LLC and Smithfield Premium Genetics were available for this study and analyzed separately.
The Maschhoffs LLC (TML) Animals
Data were collected from 1,254 terminal cross pigs raised in a commercial setting managed by The Maschhoffs LLC (Claryle, IL, USA), and were obtained from the cross of 28 Duroc sires and 806 commercial F1 sows composed of Yorkshire × Landrace or Landrace × Yorkshire sows.
28 in 1 contemporary group. Five pigs were selected from each pen for the collection of detailed phenotypic data. The selected pigs represented a pig with BW 1 SD above and a pig with BW 1 SD below the average BW of the pen, a pig with BW 2 SD above and a pig with BW 2 SD below the average BW of the pen and a pig with BW closest to the average BW of the pen. The 1,254 selected pigs were genotyped with the PorcineSNP60 v2 BeadChip (Illumina, Inc., San Diego, CA). Quality control procedures were applied by removing the SNPs that had call rate less than 0.90 and minor allele frequency less than 0.05, respectively. The final number of SNPs after quality control was 42,529. The Duroc sires had pedigrees traced back for nine generations, while no pedigree information was available for the F1 dams. Parity information was not available for the
F1 dams. Transportation of pigs to the slaughterhouse was done as detailed by (Wilson et al., 2016).
Pigs were slaughtered when the average body weight of each pen was 138kg. Pigs were immobilized via carbon dioxide stunning and killed by exsanguination.
Data collection
After the commercial slaughter procedures, fat depth (FD) and loin depth (LD) were measured using a Fat-O-Meater probe (SFK Technology A/S, Herlev, Denmark) at approximately 10th rib location before measurement of hot carcass weight (HCW). Hot carcass weight was
29 dividing the respective primal cut weight by HCW. The total primal yield (PRIMY) was calculated as the proportion of sum of all primal cuts to HCW. Carcass average daily gain (CADG) was calculated by dividing the difference of HCW and birth weight by the age when that pig was sent to market. Loins were separated from the shoulder between the second and third ribs and separated from the ham 2.79 to 3.81 cm anterior to symphysis pubis bone and made-up boneless, vacuum-packaged and sent to the University of Illinois Meat Science Laboratory and preserved as described by (Wilson et al., 2017).
Boneless loins were aged for 14 days post mortem at 4oC. After 14 days, loins were
removed from the packaging and measured for pH, and mechanically sliced into 2.54 cm thick chops as described by Wilson et al. (2016). Ultimate pH (PH) was measured on the ventral side of
the longissimus dorsi muscle using handheld MPI pH-meter fitted with a glass electrode (Meat
30 cm thick chops were taken out from frozen storage (-41oC) 24 hours prior to analysis and allowed
to thaw completely. Secondary muscles and excess subcutaneous muscles were trimmed. Then the slice shear force (SSF) was determined as described by Wilson et al. (2017). Intramuscular fat percent (IMF) was based on the extractable lipid content of each chop as described by Wilson et al. (2017).
Statistical analysis
The data were analyzed using the single step genomic BLUP (Legarra et al., 2009) using BLUPF90 (Misztal et al., 2015). Univariate analyses were conducted to obtain a first estimate of heritabilities and variance components. Heritabilities and genetic correlations between male and female for different traits were also estimated in similar fashion. Single trait models were fitted as:
y = μ + D + C + G + a + p ( ) + e
where y was the trait measured, μ was the intercept, D was the ith effect of the dam line (2
levels), C was the jth effect of contemporary group (6 levels); G was the kth effect of the gender
(2 levels), a was the random additive genetic effect, p ( ) was the random effect of pen nested in
contemporary group and e was the random residual error. Covariance matrices of the pen and residuals were equal to I𝜎 and I𝜎 , where I was an identity matrix. Initially, the model also
included the random litter effect and random permanent environmental effect. The variance absorbed by litter and permanent environmental effect was close to zero. So, these two effects were removed from all analyses for all traits. The random effect of animal was given by covariance matrix of H𝜎 in which H was blended genomic and pedigree relationship matrix (Forni et al., 2011). H-1was calculated as follows:
H-1 = A-1 + 0 0
31 where 𝐆 was the inverse of the genomic relationship matrix, A-1 was the inverse numerator relationship matrix (A) and 𝐀 was the inverse of pedigree-based relationship matrix for genotyped animals (Forni et al., 2011). All the individuals with detailed phenotypes (n =1,254) had genomic information available. G was created according to VanRaden (VanRaden, 2008b) :
G =( )( )
∑
where M is a matrix of marker alleles with m columns (m = total number of markers) and n rows (n = total number of genotyped individuals), and P is a matrix containing the frequency of the second allele (𝑝 ), expressed as 2𝑝 . 𝐌𝐢𝐣 was 0 if the genotype of individual i for SNP j was homozygous for the first allele, 1 if heterozygous, or 2 if the genotype was homozygous for the second allele. Bivariate analyses were conducted to estimate the genetic and phenotypic correlations. Multi trait models were of form:
𝑦 𝑦 = 𝑋 0 0 𝑋 𝑏 𝑏 + 𝑍 0 0 𝑍 𝑎 𝑎 + 𝑊 0 0 𝑊 𝑝 𝑝 + 𝑒 𝑒
where 𝑦 and 𝑦 were the vector of phenotypic measurements for traits 1 and 2 respectively; 𝑋
and 𝑋 were the incidence matrices relating the fixed effects to vector 𝑦 and 𝑦 respectively; 𝑏
32 The additive variance was assumed to be Var 𝑎𝑎 = CH; where C = 𝜎 𝜎
𝜎 𝜎 . The
components of covariance matrix C were defined as: 𝜎 was the additive genetic variance for trait 1, 𝜎 was the additive genetic variance for trait 2, 𝜎 = 𝜎 was the additive genetic covariance
between trait 1 and trait 2. The pen variance was assumed to be Var 𝑝𝑝 = P I; where P =
𝜎 0
0 𝜎 and I was the identity matrix. The components of P matrix were defined as: 𝜎 was
the pen variance for trait 1 and 𝜎 was the pen variance for trait 2. From a preliminary analysis
(data not shown) it was found that variance for the pen effect on PH, HCW and CADG was zero. Therefore, the variance of pen effect for those traits was fixed to zero for the subsequent analyses.
The residual variance was given by Var 𝑒𝑒 = RI; where R =
⎣ ⎢ ⎢ ⎢
⎡ 𝜎 0
0 𝜎 𝜎 0 0 𝜎 𝜎 0 0 𝜎 𝜎 0
0 𝜎 ⎦⎥
⎥ ⎥ ⎤
and
I was the identity matrix. The components of R were defined as: 𝜎 was the residual variance associated with male for trait 1, 𝜎 was the residual variance associated with female for trait 1,
𝜎 was the residual variance associated with male for trait 2, 𝜎 was the residual variance associated with female with trait 2, 𝜎 = 𝜎 was the residual covariance associated with male for trait 1 and trait 2 and 𝜎 = 𝜎 was the residual covariance associated with female for trait1 and trait 2.
Smithfield Premium Genetics (SPG) Animals
33 back for ten generations and 1,156 sires were genotyped. Pedigree information was not available for dams. Genotypes were obtained for 29 animals from GGP PorcineSNP60 BeadChip (GeneSeek, Neogen Corp.), 793 animals from PorcineSNP80 BeadChip (GeneSeek, Neogen Corp.), 2 animals from Genomic Profiler 10k BeadChip (GeneSeek, Neogen Corp.), 52 animals from Infinium PorcineSNP60v1 BeadChip (Illumina, Inc., San Diego, CA) and 280 animals from Infinium PorcineSNP60 v2 BeadChip (Illumina, Inc., San Diego, CA). All animals were imputed to have a set of 45,747 SNP on GGP Porcine Beadchip (GeneSeek, Neogen Corp.) using FImpute 2.2 (Sargolzaei et al., 2014). Quality control procedures for SPG were the same as in TML. The number of SNPs was 35,186 after quality control. Genotypes for crossbred pigs were not available in this population. The phenotypic data were collected from 2008 to 2017 from 7 different farms. Data were collected for different traits from different contemporary groups ranging from 27 to 71 depending on traits. Contemporary groups were created by concatenation of harvest year, pig farm and sex of pigs. All the males were castrated.
Data collection
Pigs were immobilized via carbon dioxide stunning and slaughtered by exsanguination. Fat depth and LD were measured by Fat-O-Meater probe (Carometec A/S, Denmark) between the 9th
rib and the last rib in the carcass before measuring the HCW. Hot carcass weight was recorded as the same as TML. Then the carcass was transferred to the blast, which helped to cool down the carcass quickly and contained the fans blowing air towards the carcass at -26oC, however the room
temperature was maintained at -14oC. Following the blast, carcasses were placed at the cooler
(-1oC to 2oC) for 24 hours. After 24 hours post-mortem, the temperature of carcass was around 2oC.
34 square inch were removed. Furthermore, fat was also trimmed from it so as not to exceed one-eighth inch. Skin-less and skin-on belly weight were recorded from two different farms. The genetic correlation [high posterior density interval] of skin-less and skin-on belly weight was 0.96 [0.91, 0.99]. So, it was treated as single trait as BEL2. All the further traits were measured on LOIN2 at same time. The 6 subjective color (SCOL) categories (1 = pale pinkish gray to white, 2 = grayish pink, 3 = reddish pink, 4 = dark reddish pink, 5 = purplish red, and 6 = dark purplish red) were classified using the guidelines declared by the National Pork Producers Council (1999). The subjective marbling (SMARB) scores were measured on the basis of 10 marbling categories (1, 2, 3, 4, 5, 6, 7, 8, 9 and 10), which were classified using the guidelines as described by the National Pork Producers Council (1999) where 10 represented abundant fat and 1 represented devoid of fat. Subjective firmness score (SFIRM) was measured using the scale from 1 to 3 where 1 was the softest and 3 was the firmest. Ultimate pH (PH) was measured on boneless loin by portable pH-meter 1140 (Mettler-Toledo LCC, Columbus, OH, United States). Loin yield (LOINY2), belly yield (BELY2), and carcass average daily gain (CADG) were calculated with the same procedure as for TML.
Statistical analysis
Single and multi-trait analyses for estimation of heritability, variance components, genetic and phenotypic correlations were again conducted with BLUPF90. Fixed effects included 6 levels of parity of dam, 2 levels of gender and contemporary group ranging from 28 to 71 levels depending on the trait. Fixed effects and random effects were the same for both single and multi-trait models. Single multi-trait model had form:
35 where y was the trait measured, μ was the intercept, P was the effect of ith parity, G was the
effect of jth gender, C was the effect of kth contemporary group, a was the random animal effect,
h was the random effect of harvest group, e was the residual error. Covariance matrices of the harvest batch and residuals were equal to I𝜎 and I𝜎 , where I was an identity matrix. The random effect of animal was given by covariance matrix of H𝜎 in which H was estimated following the same process as TML. Initially, the model also included the random litter effect and random permanent environmental effect in addition to other random effects. The variance absorbed by litter and permanent environmental effect was close to zero. So, these two effects were removed from all analyses for all traits. Multi-trait model was similar to that of TML except random effect of pen was replaced by random effect of harvest group. Harvest group was defined as a group of pigs harvested together at same date.
The harvest group variance was assumed to be Var ℎ
ℎ = P I; where P =
𝜎 0
0 𝜎
and I was the identity matrix. The components of P matrix were defined as: 𝜎 was the harvest group variance for trait1 and 𝜎 was the harvest group variance for trait 2. From the preliminary analyses it was found that harvest group variance for PH, LD, SLAGE, HCW and CADG was zero, so the variance for this effect was fixed to zero in every analysis for those traits. The zero variance of harvest group was due to same harvest date.
Heritabilities and correlations
36 genetic and phenotypic correlations were estimated from the stored samples. Heritabilities for
TML were calculated as: ℎ = and heritability for SPG were calculated as: ℎ = ,
where 𝜎 was the residual variance and calculated as: 𝜎 = . Here 𝑛 was the number
of males in population, 𝑛 was the number of females in population, 𝜎 was the residual variance
for male, 𝜎 was the residual variance for female and 𝑛 was the total number of populations.
Genetic correlations were calculated as 𝑟 =
∗
.
2.4 Results and Discussions Data summary
Means, standard deviations, number of measurements per trait, and minimum and maximum values for each meat quality and carcass composition traits of TML and SPG are given in Table 2.1 and Table 2.2 respectively. There were 14 carcass traits, 3 growth traits and 9 meat quality traits for TML, and 5 carcass traits, 4 growth traits and 4 meat quality traits for SPG. The relevant fixed and random effects fitted in the mixed model analysis for carcass, growth and meat quality traits of TML and SPG are given in Table S.A1 and Table S.A2 respectively.
Genetic material, model and experimental setup for TML
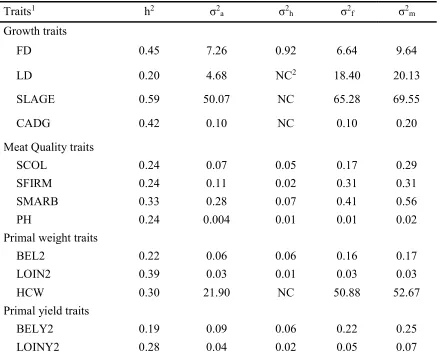
37 Heritability estimates
Heritabilities and variance components estimates of growth, meat quality and carcass traits (primal weights and primal yields) are presented in Table 2.3 for TML, and Table 2.4 for SPG. All the remaining estimates along with their respective high posterior density intervals are provided in Table S.A3 and Table S.A4 for TML and SPG, respectively.
For TML, heritability estimates [high posterior density interval] for growth traits were moderate except for LD, which was 0.15[0.09, 0.21]. Moderate heritabilities of growth traits were also reported in previous studies (Lo et al., 1992; Clutter, 2011; Miar et al., 2014a). Miar et al. (2014b), Jiao et al. (2014) and Hicks et al. (1998) reported a moderate heritability of ADG, which agreed with present study, but less than that of Cabling et al. (2015) who reported an estimate of 0.67. This higher estimate might be due to differences in the measurement of ADG than that of our study. The present study measured the carcass average daily gain, however Cabling et al. (2015) measured the average daily gain of live weight. The heritability of FD in this study agreed with previous studies (Stewart and Schinkel, 1989; Clutter and Brasscamp, 1998; Sonenson et al., 1998; van Wijk et al., 2005; Ciobanu et al., 2011 and Miar et al., 2014b). The heritability of LD in this study agreed with Van Wijk et al. (2005) and de Campos et al. (2015). However, the heritability of LD was less than some of the previous studies (Stewart and Schinckel, 1991; Ducos, 1994; Magniel et al., 2010 and Miar et al., 2014a).
38 associated with other traits like marbling and color. Marbling score is related to IMF. The heritability of SMARB was moderate. This was in concordance with the range (0.14 - 0.31) of previous studies (Lo et al., 1999; Sonenson et al., 1998; van Wijk et al., 2005; Miar et al., 2014a).