Optimization of process parameters for
Nano finishing of different surfaces in
Abrasive Flow Machining
Ashish Pachauri1, Vikash Pilaniya2
M.Tech Scholar, Dept. of ME, RITM, Palwal, Haryana, India1 Asst. Professor, Dept. of ME, RITM, Palwal, Haryana, India2
ABSTRACT:In recent competitive environment there is a huge demand of products with high accuracy of dimensional tolerances with less defects and better life cycle. Both of them can be achieved by using a better nano finishing technique. This can be better achieved by a nonconventional process i.e Abrasive Flow Machining, which uses a semi solid viscous media and pressurizes it to flow through the complex path. The abrasives in the media cause micro cutting action and enhance the surface quality of the product. This method relies upon various parameters like pressure, number of cycles, abrasive concentration etc. So focusing on different types of abrasives and work pieces is also a point of concern for enhancing the surface quality of the product. This paper involves experimental observations supporting optimization techniques to obtain better combinations of these parameters to enhance the material removal.
KEYWORDS:Material removal, Abrasive,
I.INTRODUCTION
Inside the present competitive surroundings there may be need to broaden the components with excessive dimensional accuracy, better life cycle and economic in cost. Abrasive flow machining is an unconventional technique used for finishing of complicated geometries, tough to finish using any other conventional approach [1]. This technique uses a non-Newtonian fluid to carry the abrasives for finishing. Media used in this manner has enough fluidity and viscous in nature. The work of media with abrasive particles as a cutting tool in the finishing process. The material is removed in form of small chips. Due to Industrial revolution, manual work has been replaced by machines in many of the industrial processes. But there is increasing demands for improved surface finish, economic viability where our mechanical systems are not fit. AFM method enhances the engine performance, life cycle and additionally improves the fatigue strength of the product. This method is used for vehicle industry, medical equipment’s, aerospace industry.It removes material in range of 1-10 µm [2]. It saves finishing time in comparison to the other traditional procedure [3]. AFM can be dividing in three categories based on their working and arrangement i.e. one way AFM [4], two ways AFM [5] and Orbital AFM [2]. One way AFM has the advantage offaster processing, easy handling, and better control of media temperature while two way AFM is known for its better process control.
In AFM process various studies has been carried out to improve the material removal because it has a low material removal. This paper discusses the effects of some vital parameters such as different type of abrasives and work pieces, pressure on the material removal by performing experimentation and further it was optimized by Taguchi L9 orthogonal
Array.
II.LITERATUREREVIEW
low viscosity medium.
Experimental investigation by Przyklenk [10] suggests that, the MRR capacity of a medium with more viscosity is 300 times more than a lower one.The important factors that affect MRR and velocity of medium- abrasive loading, their size andmedium viscosity.
Rajurker and Williams [11] performed additional experiments to know the effect of viscosity of medium and pressure of extrusion on MRR and surface finish. Loveless et.al [12] reached a conclusion through their experiments that surface finish improvements are also influenced by initial surface roughness and viscosity.
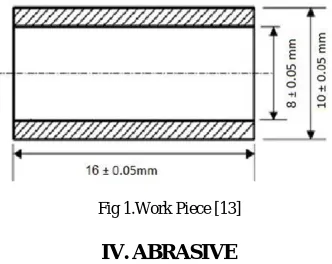
III.WORKPIECE
The length to diameter (L/D) of the work piece was decided on the basis of the recommendation given by Kohut [13]. The geometry of work piece is as given below.
Fig 1.Work Piece [13]
IV.ABRASIVE
This experimentation uses 3 different types of abrasives 3 different types of abrasive (Calcium Carbide, Boron carbide, silicon carbide). The mesh size of all abrasives was 400 microns.
Fig 2. Abrasive Particles (CaC2, B4C, SiC)
V.RESPONSECHARACTERISTICS
This experiment studies the effects of parameters (i.e. Pressure, type of abrasives, type of work piece) on the response (i.e.: material removal) –
The MR (material removal) signifies the amount of material removed from the specimen in a specified number of cycles.Material removal is calculated from the formula.
VI.SCHEMEOFEXPERIMENTS
The experiments were performed according to the L9 OA having 3 levels of parameters with 8 DOF. The selected
parameters and their levels are given in the table1:
Table1. The values and Process Parameters at Various levels
.
Table 2 The L9 Orthogonal Array for 3 parameters and three levels with their responses
S
.N
R
.O
Parameters Material Removal S/N
Ratio (db)
P A W MR 1 MR2 MR3
1 2 3
1 1 1 1 1 M11 M 12 M 13 S/N1
2 4 1 2 2 M 21 M 22 M 23 S/N2
3 7 1 3 3 M 31 M 32 M 33 S/N3
4 2 2 1 2 M 41 M 42 M 43 S/N4
5 5 2 2 3 M 51 M 52 M 53 S/N5
6 8 2 3 1 M 61 M 62 M 63 S/N6
7 3 3 1 3 M 71 M 72 M 73 S/N7
8 6 3 2 1 M 81 M 82 M 83 S/N8
9 9 3 3 2 M 91 M 92 M 93 S/N9
Total Σ Σ Σ
VII.EXPERIMENTATION
This experiment includes 3 parameters i.e. (pressure, Type of abrasives, types of work piece) which are shown in Table1. The process parameters are varied according to the Table 2. Experiments were performed according to the conditions given in L9 Orthogonal Array. For every trial condition each experiment was repeated for 3 times.Thus
twenty seven work-pieces were used having their initial surface roughness in the range of (1.1 – 2.96 micron). For each trial conditions and their repetitions, the response was measured and recorded in Table 3.
Symbol Process Parameters
Unit Level 1 Level 2 Level 3
P Pressure MPa 10 20 30
A Type of
abrasive
- Calcium carbide
Silicon carbide
Boron carbide
W Work piece - Copper Stainless steel
Mild steel
Polymer to Gel ratio -1:1, Mesh Size-180,
VIII.ANALYSISANDDISCUSSIONOFRESULT
Average values of Material Removal and S/N ratio are given in table 4.
Table4. Average values of material removal and Signal to noise ratio
Figure 3 shows that when extrusion pressure increases initially material removal increases. The reason for more material removal is due to increase in cutting force. As pressure increases the abrasive particles impact with a larger force on the work surface and abrades more material. But as the pressure is increased further abrasive will not come into contact of surface properly and will drag as a block, which reduces the material removal
.
E
.
N
.
R
.
O Percentage improvement in Ra S/N ratio (db)
MR 1 MR 2 MR 3
1 1 1.1 0.4 0.3
-7.82
2 4 0.7 0.5 0.2 -10.14
3 7 0.7 0.8 0.6 -3.27
4 2 0.5 0.6 0.4 -6.37
5 5 1.2 1 1.3 1.18
6 8 1.6 1.9 1.8 4.87
7 3 0.6 0.5 0.6 -5.03
8 6 1.2 0.7 0.8 -1.56
9 9 0.7 0.9 0.8 -2.07
∑ 8.3 7.3 6.8
TMR = Overall mean = 0.83 mg
Process Parameter
Level Pressure Type of Abrasives(A) Work piece
Type of Data Raw Data S/N Ratio Raw Data S/N Ratio Raw
Data
S/N Ratio
Average Values L1 0.58 -7.08 0.55 -6.41 1.08 -1.50
L2 1.14 -0.10 0.84 -3.50 0.58 -6.20
L3 0.75 -2.88 1.08 -0.15 0.81 -2.37
Main Effects L2-L1 0.55 6.97 0.28 2.90 -0.5 -4.69
L3-L2
0.38 -2.78 0.24 3.35 0.22 3.82
Difference (L3-L2)–(L2-L1)
Fig 3. Effect of extrusion pressure on the MR and S/N Ratio
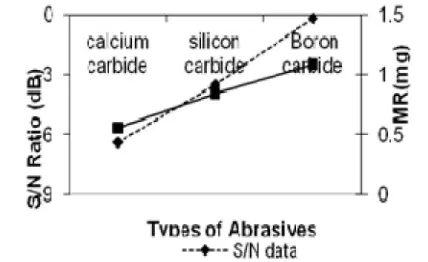
Figure 4 shows maximum material removal in case of boron carbide and minimum in case of calcium carbide. The reason is that among the three abrasive particles (Boron carbide, Calcium carbide and silicon carbide), boron carbide is harder and abrades more material while calcium carbide is less hard in comparison to both.
Fig 4. Effect of type of abrasives on the MR and S/N Ratio
Figure 5 shows maximum material removal in case of copper because it is softer in comparison to stainless steel and mild steel. While stainless steel is the harder one and abrasive particles cannot indent properly into its surface which corresponds to less material removal. Mild steel hardness is in between the both so its material removal lies between the both work pieces.
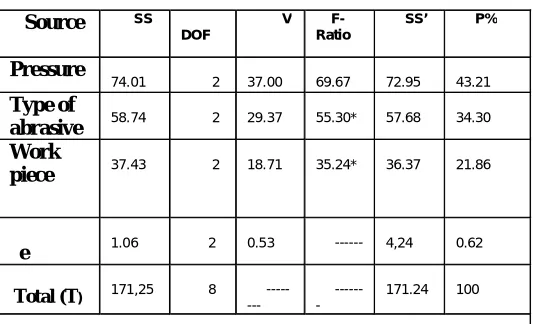
To know the significance of parameter (ANOVA) was performed. The pooled ANOVA for the raw data and S/N data for material removal are given in table 5 and 6.
Table 5 Pooled ANOVA (Raw Data)(MR) Source SS DOF V
F-Ratio
SS’ P%
Pressure
1.46
2 0.73 13.79 1.35 29.63
Type of
abrasive 1.28
2 0.64 12.09 1.17 25.99
Work
Piece 1.12
2 0.56 10.64 1.02 22.88
e 1.06 20 0.05 --- 1.37 21.48
Total (T) 4.93 26 * --- 4.93 100
*Significant at 95% confidence level, F critical =3.4928(Tabulated Value)
SS-Sum of Squares, DOF-Degree of Freedom, V-Variance, SS’-Pure sum of Squares
Table 6.Pooled ANOVA (S/N Data)(MR) Source SS
DOF
V F-Ratio
SS’ P%
Pressure
74.01
2 37.00 69.67 72.95 43.21
Type of
abrasive 58.74
2 29.37 55.30* 57.68 34.30
Work
piece 37.43
2 18.71 35.24* 36.37 21.86
e 1.06 2 0.53 --- 4,24 0.62
Total (T) 171,25 8 ------ ---- 171.24 100
*Significant at 95% confidence level, F critical =19(Tabulated
Value)
X. ESTIMATION OF OPTIMUM RESPONSE CHARACTRESTICS
In this section, the optimum values of the response characteristics along with their respective confidence intervals have been predicted. The results of confirmation experiments have also been presented to validate optimal result. The average value of the response characteristic obtained through the confirmation experiments must lie within the 95% confidence level, CICE. However the average value of quality characteristic obtained from the confirmation experiments
may or may not lie within 95% confidence interval, CIPOP. As observed the optimum values for the maximum MR are
P2A3W1 for both raw data and S/N ratio. For the confirmation experiments on the basis of raw data the optimal settings
have been taken as P2A3W1. Based on the optimal selection of the process the optimum response parameter of the
material removal is estimated with the confidence intervals as further.
XI.MATERIALREMOVAL
The mean at the optimal MR (optimum values of the response characteristics) is estimated as μ = 2 + ̅3 + 1 -2 ……….(Equation No. 1)
= overall mean of the response =0.83 mg
2 =Average value of MR at the second level of Pressure = 1.14mg
̅
3 =Average value of MR at the third level of abrasive type = 1.08 mg 1 =Average value of MR at the first level of type of work piece= 1.08 mg
Substituting these values, Mean MR = 1.64 mg
The confidence interval of confirmation experiments (CICE) and of population (CIPOP) is calculated by using the
following equation
CI = F (1, f )V + ……… (Equation No. 2)
CI = ( , ) ……….(Equation No. 3)
Where Fα (1, fe) = The F- ratio at the confidence level of (1-α) against DOF 1 and error degree of freedom fe= 3.49
fe = error DOF = 20 (Table 6.2)
N = Total no of result =27 (treatment =9, repetition =3) R = Sample size for confirmation experiments = 3 Ve = Error variance =0.05
n =
[ ] …………..(Equation No.4) = 3.86
So, CICE = ± 0.32, CIPOP = ± 0.21
The 95% confirmation interval of predicted optimal range (for confirmation run of three experiments) is: Mean MR – CICE<MR< MR + CICE
1.32< MR <1.96
The 95% confirmation interval of the predicted mean is : Mean MR – CIPOP<MR< MR + CIPOP
1.43< MR <1.85
XII.CONFIRMATIONEXPERIMENT
As observed the optimum values for the maximum MR are P2A3W1 for both raw data and S/N ratio. For the
A3 = Abrasive at first level =B4C (Boron carbide)
W1= Work piece at first level copper (Cu)
XIII.CONCLUSION
There is need to enhance the material removal by hybridization of AFM process. This improves the finishing efficiency and also minimizes the energy loss during the finishing process. The end result indicates that the contribution of the work piece is 22.88%, type of abrasive is 25.99 %, and extrusion pressure is contributing 29.63%.
REFERENCES
[1].Parvesh Ali, Sachin Dhull, R.S Walia, Q, Murtaza, MohitTyagi, “Hybrid abrasive flow machining for Nano finishing- A Review” Materials Today: Proceeding (ICAAMM-2016), Vol. 4, pp. 7208-7218,2017.
[2].Sankar M Ravi, Ramkumar J, Jain V.K, “Abrasive flow machining (AFM): An Overview” INDO-US WORKSHOP on Smart Machine Tools, Intelligent MachiningSystems and Multi-scale Manufacturing December 2008.
[3].Rhoades L.J, “Abrasive flow machining with not-so silly putty” Met Finish , July 27–29,1987
[4] Rhoades L.J, Kohut T.A, Nokovich N.P, Yanda D.W, “Unidirectional abrasive flow machining”, US patent number 5,367,833, Nov 29th, 1994. [5] Rhoades L.J, Kohut T.A, “Reversible Unidirectional AFM”, US patent number 5,070,652, Dec 10th, 1991.
[6] Rhoades L.J, “Abrasive flow machining, Manufacturing” Engineering 66-82, 1988
[7] Rhoades L.J, “Abrasive flow machining with not-so-silly putty”, Metal Finishing July 22-28, 1987
[8] Rhoades L.J, “Abrasive flow machining: a case study”, Journal of Material Processing Technology 28 (101-117),1991
[9] Rhoades, L.J., “Abrasive Flow Machining”, Technical Paper of the Society of Manufacturing Engineers (SME), MR89 – 145, 1989 [10] Przylenk K,“AFM—a process for surface finishing and deburring of the workpiece with a complicated shape by means of an abrasive laden Medium”, PED, 22ASME, NewYork, pp. 98-116, 1986
[11] Williams R.E, Rajurkar K.P, “Metal removal and surface finish characteristics in abrasive flow machining”, PED, 38ASME, New York, pp. 87–104, 1989
[12]William R.E, Rajurkar K.P. “Monitoring of abrasive flow machining process using acoustic emission”, S.M. Wu Symposium, vol. I, pp 35– 87–104,1994
[13] Kohut T, “Surface finishing with Abrasive flow machining”, SME Technical Paper, Proc. 4th International Aluminium extraction Technology Seminar, Washington D.C., pp. 35-42, 1988