Copyright to IJIRSET www.ijirset.com 158
Structural Morphology Based Automatic Virus
Particle Detection Using Robust Segmentation
and Decision Tree Classification
Saffna Shajahan1, Chithra B2
M.tech student (AE&I), Dept of ECE, Lourdes Matha College of Science and Technology, Trivandrum, India1
Assistant Professor, Dept of ECE, Lourdes Matha College of Science and Technology, Trivandrum, India2
ABSTRACT
:
Accurate and automatic approach to locate virus particles in electron microscopy is cardinal because of the large number of electron views that are needed to perform high resolution three dimensional reconstructions at the ultra-structural level. This paper describes a fully automatic approach to locate adenovirus particles where low level of entropy is compared to the surrounding unorganized area. Characterization of the structural morphology of the virus particles based on area and eccentricity helps to detect the candidate points. The detected points are subjected to credibility test based on features extracted from each point from a texture image followed by decision tree classification. Final validation of approved candidate’s takes place with 3D entropy proportion coordinates, computed in the original image, compensated work image1 and strongly filtered work image 2.KEYWORDS: Adenovirus, transmission electron microscopy, Decision tree classifier, automatic particle detection, Segmentation.
I. INTRODUCTION
Advances in cryo electron microscopy and single particle reconstruction have led to results at increasingly high resolutions. However to sustain continuing improvements in resolution it will be necessary to increase the number of particles included in performing the reconstruction. This task, commonly known as particle picking or particle detection in single particle analysis, can certainly be carried out manually but as the reconstructed resolution approaches the atomic level, hundreds of thousands of particles may be necessary which makes it impractical. In addition, practical detection by visual observation may be inaccurate and fairly subjective.
Several methods have been proposed for automatic or semi-automatic particle detection. The relevant texture based methods [2] are Variancemethod and Linear Discriminant analysis. Variance method is based on computing the local variance over a small area and its high value indicates the presence of an object. Linear Discriminant analysis is a more elaborate method that depends on screening an initial set of data windows obtained by convoluting the micrograph image with a Gaussian function. Depending upon one’s point of view, this first step can be described as (1) matched filtering in which the reference object is a Gaussian function simulating an object of the size of the particles being sought or (2) low pass filtering, designed to eliminate the higher frequencies where the signal-to-noise ratio is in any case expected to be poor. This preprocessing step is then followed by a peak search. Pixels in square areas (surrounding peak positions) in the micrograph are copied into small images of candidate particles, or data windows. The data windows identified from the peak search are then screened with a linear discriminant function evaluated from feature vectors computed for each of the data windows.
Copyright to IJIRSET www.ijirset.com 159
are then identified by the double-scan procedure. Subsequently, in a clustering step, pixels belonging to the same object are identified in a way similar to that used in the algorithm for identifying contiguous edges in the method of Harauz. At this stage, clusters that are either too large or too small are then rejected. In the final post-processing, checks are carried out for false positives and missed particles that may have been rejected as a part of a large cluster.The template matching method [4] developed for automatic particle selection assumes that object is detected in an image by evaluating a score for the match between the image and a reference image for each possible object location. Object detection occurs when the score exceeds a chosen threshold.
The local average intensity method [5] for spherical /Icosahedral particles is an automatic method for detecting virus particles based on the comparison of intensity between a circular area and a surrounding ring, and keeping the maxima of that ratio in each square of image with diagonal equivalent to particle radius.
These and other methods are described in [4], leading to the conclusion (among others) that further tools are needed to allow for a confident use of automatic methods and complete elimination of the human intervention.The approach presented here is based on the characteristics common to all life forms-small levels of entropy. The first section deals with the algorithm –detection and validation, the second section deals with algorithm performance evaluation followed by the results.
II. APPROACH
In this section we shall describe the details of the particle detection algorithm. Method is based on the low level of entropy compared to the surrounding area. The original image was digitized at 96dpi i.e. about 1844×1844 pixels. The values of average, standard deviation and entropy of this image are kept as references. The algorithm mainly consists of the following steps.
A. Preprocessing 1
The original image is background compensated for irregular brightness with a morphological opening which suppresses bright details smaller than thedisk structuring element, followed by subtraction of the opened image from the original and gray scale adjustment.
Preprocessing with a wavelet spike filter, consisting of decomposition followed by reconstruction using a Daubechies wavelet of support of order 11 with details of first level suppressed, provides a smooth filter of local spikes. The preprocessed image constitutes the input to the entropy proportion calculation.
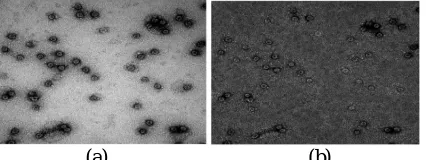
B. Entropy Calculation
Image entropy is a quantity which is used to describe the `business' of an image, i.e. the amount of information which must be coded for by a compression algorithm. Low entropy images, such as those containing a lot of black sky, have very little contrast and large runs of pixels with the same or similar DN values. An image that is perfectly flat will have entropy of zero. Consequently, they can be compressed to a relatively small size. On the other hand, high entropy images such as an image of heavily cratered areas on the moon have a great deal of contrast from one pixel to the next and consequently cannot be compressed as much as low entropy images.
(a) (b)
Copyright to IJIRSET www.ijirset.com 160
Fig2:Block illustrating the sequence of operation
In addition, it is the statistical measure of randomness that can be used to characterize the texture of the input image. Entropy is defined as
where h contains the histogram count of the pixels belonging to the set defined by d(i, j) for the denominator and n(i, j) for the numerator.
In , the two parameters and define an area of interest that encircle the expected particle. The denominator was
computed in a local neighborhood defined by the function
Copyright to IJIRSET www.ijirset.com 161
accumulation. When the current pixel is at the center of a virus particle, the pixels covered by the mask will
generate a minimum amount of entropy, compared to the situation where both functions and covered
background areas with similar amounts of entropy, which will give an entropy ratio ≈1.The deepest regional minima in the entropy proportion image resulting from this process were located using h-min transform that suppresses all minima whose depth is less than x% of the deeper one, resulting in a binary image. Morphological filtering [6] based on area and eccentricity indices enabled the isolation of the smaller area corresponding to the sharp minima, the coordinates of centroid of each of these areas defined the coordinates of a candidate point.
(a) (b)
Fig 3:Sequence illustrating pre processing 2: (a) contrast enhnaced image followed by (b) wavelet decomposition/reconstruction with two levels of details suppressed.
C. Preprocessing 2
The preprocessing is aimed to smooth the radiometric fluctuations inside the particle and to enhance the borders, in order to detect the abrupt change in particle/background with the local standard deviation filter. Processing starts with the wavelet filter, consisting of decomposition followed by reconstruction using a Daubechies wavelet of order 11 with 2 levels of details suppressed.
Contrast-limited adaptive histogram equalization (CLAHE)operates in small region of the image called tiles, rather than the entire image. Each tiles contrast is enhanced, so that the histogram of the output region approx. matches the histogram specified by the distribution parameter alpha set to 0.95 in 8×8 tiles. The neighborhood tiles are then combined using bilinear interpolation to eliminate artificially induced boundaries. The contrast in the homogenous areas can be limited to avoid amplifying any noise that might be present in an image.
Wiener2 low pass-filters a gray scale image that has been degraded by constant power additive noise.It tries to build an optimal estimate of the original image by enforcing the minimum mean square constraints between estimate and original image. A pixel wise adaptive wiener filtering method based on statistics estimated from a local neighborhood of size 11×11 followed by normalization. This stronglyfiltered image is the input for the standard deviation, applied in windows of 3×3 pixels, with a 3D structuring element: a ball of radius 3 and height 20
(a) (b)
Copyright to IJIRSET www.ijirset.com 162
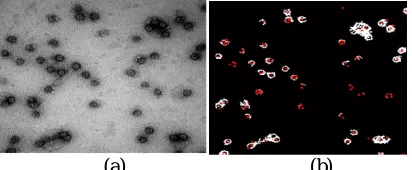
D. Candidate Credibility
The set of candidate points may include false positives andmay be losing interesting points, considered as false negatives;the threshold used to locate the regional minima must target alow number of false negatives, at expenses of a high numberof false positives, because the erroneous candidates can bedismissed with an evaluation of its neighborhood based inprevious knowledge.This evaluation was achieved in a texture image built witha standard deviation filter using a 3D structuring element ona pre-processed input image. The set of properties of the candidate point including Area, Euler Number, Orientation, Extent and Perimeterwere computed.
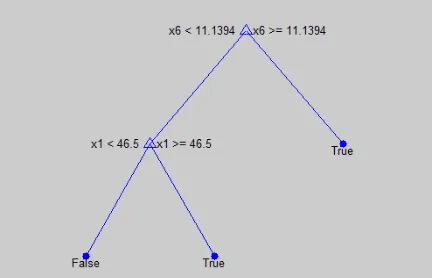
Fig 5: sequence illustrating the decision tree classification
E. Decision Tree Classifier
Decision Treesare a non-parametric supervised learning [8] method used for classification and regression. It is a flow-chart-like structure, where each internal (non-leaf) node denotes a test on an attribute, each branch represents the outcome of a test, and each leaf (or terminal) node holds a class label. The topmost node in a tree is the root node. The goal is to create a model that predicts the value of a target variable by learning simple decision rules inferred from the data features.A decision tree is created in two phases:
1. Tree Building Phase
Repeatedly partition the training data until all the examples in each partition belong to one class or the partition is sufficiently small
2. Tree pruning phase
Remove dependency on statistical noise or variation that may be particular only to the training set
The previous knowledge of the particles was incorporated in the routine as training data — standard width expected at this magnification, width tolerance, and ideal range to extract the profiles; all were functions of the particle expected radius. By “width” we mean the average diameter of a circleencompassing the virus particle, and the “width tolerance” reflected the variation admissible.
F. Final validation
The set of accepted candidates was re-evaluated in a tri-parameterspace where the coordinates of each candidate werethe entropy proportions computed at that point in three differentversions of the initial image built during the procedure:
1. The original image with the label masked,
Copyright to IJIRSET www.ijirset.com 163
III. RESULT
The implementation of the algorithm is carried out with Matlab, release 2010a, with a mix proprietary function and original routines developed for this specific purpose in Matlab’s language; the minimum processing time is 36s in a 64 bit system with an Intel processor core , for a single candidate detected and accepted; it varies with the number of particles present. The algorithm performance was evaluated in a data set of TEM images obtained from [9].The morphological intact particles with perfect borders was detected thereby reducing the false positive rates.The graph illustrated in fig 6 shows that with the proposed system the rate of false positives can be reduced
Fig 6: Graph illustrating the comparison of the proposed and the existing algorithm.
.
IV. DISCUSSION AND CONCLUSION
We described an algorithm for automatic detection of adenovirus particles based on structural morphology i.e. area and eccentricity followed by classification using decision tree classifier. The basis of the entropy approach remains valid as long as an area of low entropy can be associated with the object of interest. The detection of minima in the entropy proportion image can be achieved by other methods like peak search; the use of minima threshold aims to simplify this step of the process, and enables the subsequent selection by morphological characteristics of the objects retained.
The evaluation of credibility of the candidate is a function of the particle dimension, as the profile range should match the average size of particle. Classification using decision tree classifier has several advantages like simple to understand and interpret, requires little data preparation, able to handle both numerical and categorical data, possible to validate a model using statistical tests, robust and performs well with large data sheets.
In terms of methodology, the approach proposed here presents a low level of initial false positives which is a major drawback of many other algorithms. A comparison with other procedures previously applied to same kind of images would be possible if the same benchmark datasheets and performance metrics were made available.
REFERENCES
1. Maria da Conceição M. SangremanProença, J. F. MouraNunes, and A. P. Alves de Matos “Automatic Virus Particle Selection—The Entropy Approach” IEEE TRANSACTIONS ON IMAGE PROCESSING, VOL. 22, NO. 5, MAY 2013
2. K. R. Lata, P. Penczek, and J. Frank, “Automatic particle picking from electron micrographs,” Ultramicroscopy, vol. 58, nos. 3–4, pp. 381–391, 1995.
Copyright to IJIRSET www.ijirset.com 164
4. W. V. Nicholson and R. M. Glaeser, “Review: Automatic particle detection in electron microscopy,” J. Struct. Biol., vol. 133, nos. 2–3, pp. 90–101, 2001.
5. T. Kivioja, J. Ravantti, A. Verkhovsky, E. Ukkonen, and D. Bamford, “Local average intensity-based method for identifying spherical particles in electron micrographs,” J. Struct. Biol., vol. 131, no. 2, pp. 126–134, 2000.
6. Z. Yu and C. Bajaj, “Detecting circular and rectangular particles based on geometric feature detection in electron micrographs,” J. Struct. Biol., vol. 145, nos. 1–2, pp. 168–180, 2004.
7. T. Ogura and C. Sato, “Automatic particle pickup method using a neural network has high accuracy by applying an initial weight derived from eigenimages: A new reference free method for single-particle analysis,” J. Struct. Biol., vol. 145, nos. 1–2, pp. 63–75, 2004.
8. C. O. S. Sorzano, E. Recarte, M. Alcorlo, J. R. Bilbao-Castro, C. San- Martín, R. Marabini, and J. M. Carazo, “Automatic particle selection from electron micrographs using machine learning techniques,” J. Struct. Biol., vol. 167, pp. 252–260, Jun. 2009.
9. .http://www.virology.net/big_virology/bvhomepage.htmlBig picture book of virus particles.