SUN, RUIRUI. How Pre-retirement Education in the Work Place Helps Workers to Plan for Retirement. (Under the direction of Robert Clark.)
Saving inadequacy is an important issue among American retiring workers. This is the result of the fact that most Americans are facing retirement planning difficulties. Retirement-related knowledge plays an important role in retirement planning, since enough information is an essential assumption in life-time utility optimizing behavior. My thesis is focused to answer two questions: first, what factors influence retiring workers’ retirement-related knowledge; second, how does the knowledge affect workers’ planning.
Workers to Plan for Retirement
by Ruirui Sun
A thesis submitted to the Graduate Faculty of North Carolina State University
in partial fulfillment of the requirements for the Degree of
Master of Arts
Economics
Raleigh, North Carolina 2010
APPROVED BY:
__________________________ _________________________ Charles Knoeber Melinda Morrill
__________________________ Robert Clark
DEDICATION
致父母,
你们的支持是我动力的来源
BIOGRAPHY
ACKNOWLEDGEMENTS
I want to express my deepest gratitude to Professor Robert Clark and Dr. Morrill, from whom I received valuable research experiences. Their guidance and suggestions on my thesis helped me to improve my understanding in economics and research methods. I also want to thank Professor Charles Knoeber, who shared with me his intelligent ideas on my thesis. I extend my appreciation to Professor Stephen L. Campbell from Mathematics Department, who kept encouraging me during my graduate study.
I spent great two years studying in Economics Department and received supports from it. Especially, I want to thank Dr. Tamah Morant and Ms Robin Carpenter, who have provided me with numerous important information and help. Also, I would like to express my appreciation to Jinjing Wang and Tianfangwu, two of my best friends from Economics Department, who inspired me in many economic aspects. It always feels great to talk about questions and reading books with them.
TABLE OF CONTENTS
LIST OF TABLES...vi
LIST OF FIGURES...vii
Introduction...1
Literature Review...3
Data ...5
Methods of Analysis ...7
Data Description and Analysis...9
Pre- and Post-seminar financial, social security and pension knowledge ... 10
Planning tools and knowledge score ... 14
Regression models... 15
Factors that influence knowledge score ... 15
How knowledge score affects workers’ retirement planning ... 18
Conclusion ... 22
Tables... 25
Figures ... 37
References... 39
APPENDICES ... 42
Appendix I Knowledge Questions ... 43
Appendix II Tools for planning ... 45
LIST OF TABLES
Table 1 Sample’s demographic information ... 25
Table 2 (a) Sample average Pre- and Post-scores ... 27
Table 2 (b) Test for knowledge score difference... 27
Table 3 Pre- and Post-scores across groups ... 28
Table 4 Pre-seminar score in groups of planning tools ... 31
Table 5 Model (1) ... 32
Table 6 Model (2) ... 33
Table 7 Model (3) ... 34
Table 8 Model (4) ... 35
Table 9 (a) “Don’t Know” score ... 36
LIST OF FIGURES
Introduction
This thesis shows how pre-retirement education in the work place can influence workers’ retirement-related knowledge and retirement plans. Pre-retirement education in work place is a program provided by employer to retiring workers, in order to help them increase knowledge about retirement planning. There are two questions to be answered in this paper. First, while holding demographic variables constant, what variable is statistically significant in affecting retirement-related knowledge scores, both before and after education program? Second, how do pre- and post-seminar knowledge scores affect respondents’ retirement planning?
Statistical results from Employee Benefit Research Institute (EBRI) show that since 1993, more than 20 percent of American workers are not “confident in having enough money to live comfortably throughout their retirement years”1. This number reached its highest of two decades in 1998 (48 percent).
Research has been done to explain why workers are not saving enough. Pigou and Aslanbeigui (1952) pointed out that irrationality has significant implications on inter-temporal allocation of resources that will result in inadequate saving. Under rational consumption, the life-cycle model suggests that consumers derive lifetime utility from
1 See: EBRI and Mathew Greenwald & Associates, Inc., 1993-2009 Retirement
consumption over all life time periods. For simplicity, economists believe that with certain restrictions, consumers will be able to reach utility maximum over their lifetime. Therefore, rational consumers must have enough financial knowledge to handle financial planning and therefore be prepared for life in retirement. However it is unrealistic to think that workers all behave under perfect rationality, or else we are having personal equilibrium already. The reason that people are not behaving rationally may be that people are not aware of enough knowledge in decision making. Or it is possible that people are aware of these information and knowledge but not behaving under these “rules”. Researches have been done in showing that many workers are lacking of retirement-related knowledge.
security and employer-provided pension plans. Education levels play important roles in employers’ learning behavior. Pre-seminar knowledge shows to be correlated with retirement planning. But it is hard to detect the influence of post-knowledge on retirement planning with the information we have at hand.
Literature Review
There is a great concern about inadequate preparation for retirement among American workers. About 30% of American workers do not have enough preparation for retirement (EBRI, Issue Brief, 2009). According this same report, 21% of the workers feel that “preparing for retirement takes too much time and effort”(page 10). Lusardi (1999, 2003) has pointed out that one-third of adults in their 50s say they failed to develop any kind of retirement saving plan at all. Researchers find that only a minority of American household feels “confident” about retirement saving adequacy (Lusardi and Mitchell, 2005). Previous studies have shown many difficulties exist in preparing for retirement (e.g. Yabokoski and Dickemper 1997, Lusardi 2002). Most difficulties involve the knowledge of employer-provided pension plans, social security formulas, interest rate, inflation and financial instrument, etc.
where financial literacy modules are provided in the survey, less than one-fifth of the respondents believe they engaged in successful retirement planning (Lusardi and Mitchell, 2005). In this research, analysis results suggest great interrelation between financial literacy and planning. It also shows financial illiteracy is acute among those with less than a high school degree. For example, more than half of those with less than high school education reported “Don’t Know” to the financial questions.
Pre-retirement plan seminars are shown to be efficient in providing employees financial knowledge and guidance for planning and better retirement outcomes (Lusardi 2008). The research done by Clark, Morrill, and Allen (2009a) using data from five large companies shows there are improvements in financial literacy after such financial seminars. Their work then (2009b) shows how much workers understand retirement planning is going to influence workers’ actual planning results. For example people who think Normal Retirement Age (NRA) for social security is younger than 66 tend to plan to retire earlier than those who think NRA is greater than 66.
Data
I use data from the Participants Attending Retirement Seminars (PARS) developed by NC State University, supported grant in part from the FINRA (Financial Industry Regulatory Authority) Investor Education Foundation. The study examines how employer-provided pre-retirement education helps workers make better retirement plans.2 The survey includes economic and demographic information, retirement plans of respondents and their level of financial knowledge before and after the seminar. Workers are also asked to give evaluations of the seminar. The data employed in this study are from BD, the employer-partner with the largest number of respondents.
BD (Becton, Dickinson and Company) is a global medical technology company headquartered in New Jersey since 1906. It consists of three business segments: BD Medical, BD Diagnostics and BD Biosciences. As of September 30, 2009, the company had 12,698 employees from the U.S. For all US employees, BD offers defined benefit pension plans. It offers certain postretirement healthcare and life insurance benefits to qualifying domestic retirees (BD-10K, 2009). It allows its employees to lump sum some or all of their pension plan (not including 401(k)) and workers have the opportunity to stay in the health plan after retirement.
Since fall 2008, BD has held in total 31 sets of pre-retirement education seminars among its locations in Sparks (MD), Hunt Valley (MD), Holdrege (NE), Broken Bow (NE), Columbus (NE), Canaan (CT), Sumter (SC), San Jose (CA), and Sandy (UT) with hundreds of attendees at the seminars. The total sample size is 431. After some restrictions that I will discuss later, the actual sample size used is 295.
Methods of Analysis
The analysis uses the data described above to answer two important questions. First, how do pre- and post-seminar knowledge scores change for different groups of people3 and what factors may influence the result of knowledge scores? Second, how do the pre- and post-seminar knowledge scores affect respondents’ answers for retirement planning? Statistic results show that the statistic characteristics of the data. Two linear regression models are estimated to assess the determinants learning in the seminar and how learning or greater financial knowledge alters retirement planning.
I have defined some variables in my regression models. “Year earn” is the variable represented of “last year’s total earning”. “Wealth” is defined as the “total value of the stocks, bonds, and savings accounts, not including Savings Incentive Plan offered by BD, those of spouse”. “Knowledge score” is valued from 0 to 12, with 12 questions selected from the survey (please see Appendix I for details). “Families and relatives” takes value 1 if the respondent has talked to their family and relatives about financial planning. “Other advice” takes value 1 if the respondent has used any other advice resource (not including “families and relatives”). “Lecture fixed impact factor” is to indicate the lecture section that the respondent attended. “Pre-score” and “Post-score”
represent respondents’ retirement-related knowledge levels. They are valued from 0 to 12, which indicate the number of correct answers from the selected questions (see Appendix I for these questions). “DK score” is valued from 0 to 8. This variable is to find out how many planning questions are left with “Don’t Know” as an answer. Missing value for questions where “Don’t Know” is provided as a choice is not included. This variable is to indicate how few plans workers have for retirement. The higher the score, the more “Don’t Know” is answered to questions, and the fewer plans the worker has. In regression, the omitted level of education is the level of “some year of college but no degree”. The omitted level of year earn is “less than $25,000”. The omitted level of wealth is the level of “less than $25,000”.
Since the questions are about gaining knowledge through this education program, the observations I used are respondents who answers both sections’ (pre- and post-seminar) questions. For each section, there are respondents skipped some questions even when “Don’t Know” is an option, thus I also restricted the data for those who answered at least 6 questions in each section. This makes the total number of observations be 300.
performing sample mean analysis. This is to see whether there exist any connections between these factors and knowledge score, and to detect the learning pattern among different groups. This analysis can help to figure out what factors may influent pre- and post-seminar retirement knowledge scores, and thus help to predict results from regression models. Factors also include resources of advice for retirement planning. Third, I will perform regression models to answer the questions, so that to see which factor is statistically significant after holding other factors constant. As stated above, the expected results of regression models come from sample mean analysis. There are four models reported in this thesis. The first two models are to answer question one, and the latter two models are to answer question two.
Data Description and Analysis
Demographic Information
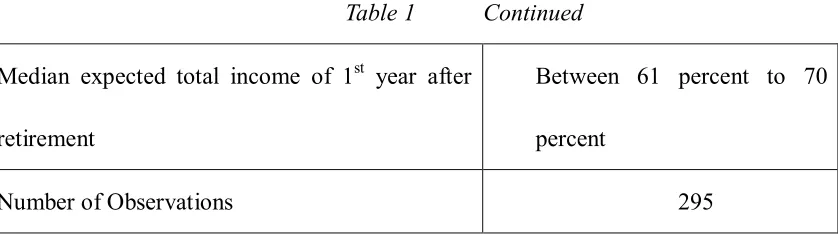
The demographic information is as shown in Table 1. The median age of workers who attend these seminars is 58, with about 54% of these employees being female. Over 77% of the nearing retirees are married or living with a partner now. Report from BD company shows that all of the respondents are covered by BD’s pension plans and having Saving Incentive Plan (SIP), which is also known as a Defined Contribution Plan.
with their median earning lying in the range of $25,000 to $50,000, their median financial wealth in the accounts (see the definition of the variable “wealth” from previous part) is from $50,001 to $75,000. Workers from this sample have their median value of SIP account being only three to five years salary. Also from this table we can see that, for respondents the median expected total income for the first year after retirement is less than 70 percent of income from previous year while employed. There are research suggests the replacement rate of income is 80 percent, and BD data shows less than this number. Information from the data is not convincing to believe that these workers will have enough saving to lead a retiring life up to current level.
[Table 1]
Pre- and Post-seminar financial, social security and pension
knowledge
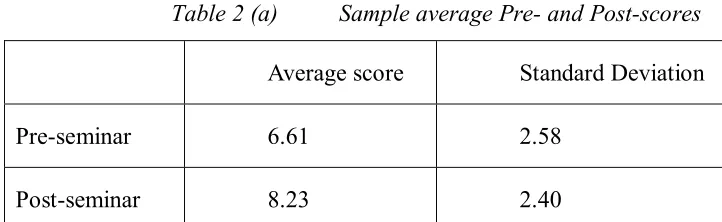
[Table 2 (a)]
Based on the total score of 12, average pre-seminar score is 6.61 and post-seminar score is 8.23. Thus on average there is an increase in the score, which shows a gain in knowledge through this education program. Table 2 (b) shows t-test result for the differences in knowledge scores before and after seminars, and it is statistically significant.
[Table 2 (b)]
Figure 1 shows the distribution of knowledge score before and after the seminar. It is clearly that mean of knowledge score is moving to the right after the seminar.
[Figure 1]
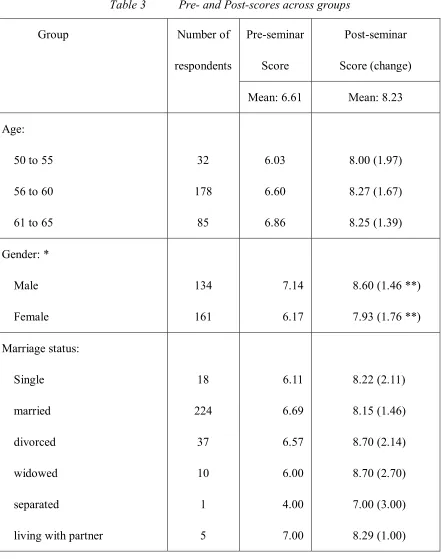
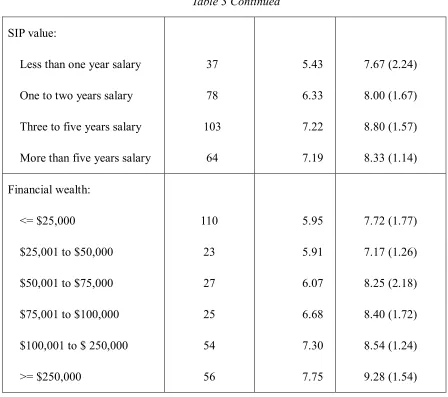
Next, I checked the average pre- and post-seminar score in different groups. These groups are age, gender, marriage status, year earning, education level, SIP value, and financial wealth. Results are shown in Table 3.
[Table 3]
have found using HRS 2004 cohort (2005), that women are less knowledgeable about financial knowledge. Besides, Lusardi and Mitchell (2007) showed by using HRS 2004 that baby-boomer workers (who were around the same age as the respondents in our data) with higher education tend to be more correct in financial knowledge questions than those who are not as high educated. But my result on this point does not reflect what Mitchell found in her research about women knowing more pension plan information. Mitchell (1988) showed in her research that women tend to understand more pension information. Education and tenure can contribute in gaining knowledge of early retirement age, but those with higher education and tenure tend to have more missing values when facing requirement plus service questions.
Besides, for both men and women, the differences of knowledge score before and after the seminar is significant. That is to say, the increase of knowledge score appears in both category, while the score itself is different between the category.
time.
Third, the pattern across “education” groups is also consistent with the hypothesis that knowledge scores are correlated with schooling.
According to these result, I am expecting to see in the following regression model that, higher education people having higher mean scores and women may be more knowledgeable than men. I also want to see whether income, financial wealth can show any statistic significant impact on knowledge score.
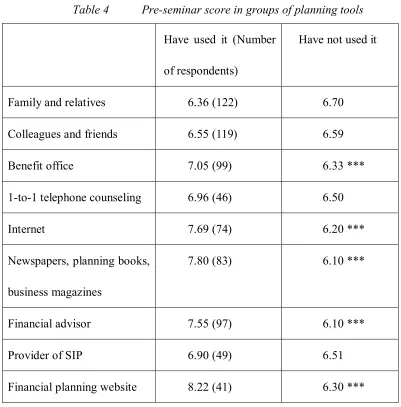
Planning tools and knowledge score
In the survey, workers are asked before the seminar whether they have used any planning tools as listed in the survey (see appendix II for details about the questions) to prepare for retirement., According to Lusardi (2005, page 13), “those who used more sophisticated tools were always more likely to get the literacy questions right, as compared to those who relied on personal communications”. The fact that workers seek for information about pension plans and retirement for planning shows their desire to get knowledge regarding to retirement. For those who did not seek out information, there are two possibilities and explanations for their behavior. One is that they are not aware of the importance of retirement planning. Or, they have already been knowledgeable about the information so that there is no need to seek for help. Thus I checked the average pre-seminar scores in groups of different planning tools, in order to see whether there is a pattern of difference on knowledge scores between those who seek for help and those who did not. The results are shown in Table 4.
[Table 4]
those who did not. Does it mean that talking to families and relatives are having negative effects on knowledge? I will test this effect in regression models. This may suggest that people who did not seek for help have less knowledge than those who did. Thus, it is possible that workers who are not seeking help are not aware of the importance of retirement-related knowledge.
However, understanding why workers seek out planning advice needs more deep research, and is not going to be considered in my thesis.
Regression models
I performed several regression models in order to answer two questions. First, I want to see how each factor is correlated with pre- and post-seminar retirement knowledge while holding other factors constant. Those factors will be the ones I tested from previous sections. Second, I want to see how people’s knowledge affects their actual planning behavior.
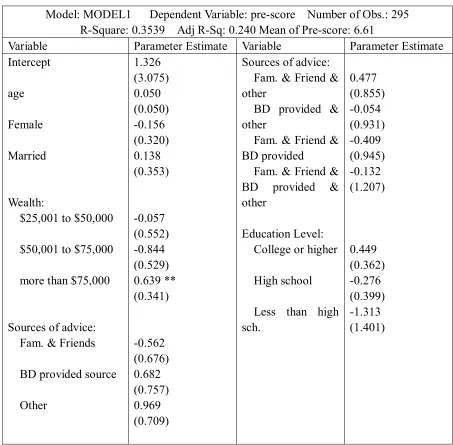
Factors that influence knowledge score
The models I tested were:
(1) Pre-score = α1 + μ1 age + μ2 gender + μ3 marital status +μ4 level of
wealth +μ5 Families and Relatives and Friends + μ6 BD provided sources +μ7 Other
provided source +μ10 Families and Relatives and Friends * BD provided source +μ11
level of education + μ12 Lecture fixed impact +ɛ1
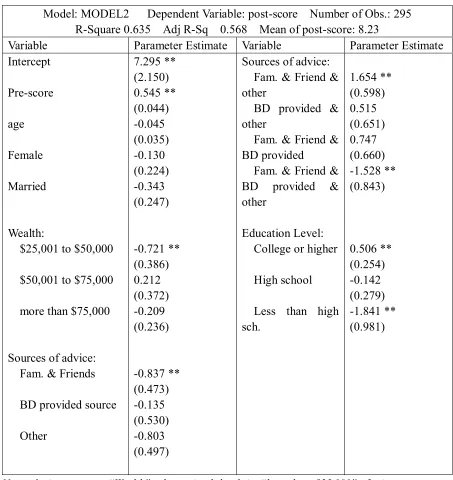
(2) Post-score =α2 + δ1 age + δ2 gender +δ3 marriage status +δ4 levels of
wealth +δ5 Families and Relatives and Friends+δ6 BD provided source +δ7 Other
advice +δ8 Other advice * Families and Relatives and Friends +δ9 Other advice * BD
provided source +δ10 Families and Relatives and Friends * BD provided source levels
of education +δ11 pre-score +δ12 Lecture fixed impact + ɛ2
In the second model, it is actually detecting how each factor affects learning, that is, the difference between pre- and post-knowledge scores. I expect to see how education level affects people gaining knowledge while holding other factors constant. Both results from two models are reported in Table 5 and 6.
In model (1), the only variables that are significant at .1 level are “wealth of over $75,000” (with standard error σ = 0.341). Education level is not statistically significant in this model. The result is inconsistent with my hypothesis that education levels will be significant to knowledge. 4 Thus, from this model, I can only conclude that higher level of financial wealth contribute to higher knowledge score.
4
In the second model, pre-score (with σ = 0.044), “wealth between $25,001 and $50,001” (with σ = 0.386) advice from families (with σ = 0.473), the interaction part, education levels and Lecture indicator are significant at .1 level. In particular, education level with "college or higher" has σ = 0.254, and education level with "less than high school" has σ = 0.981. This regression shows education levels’ effect on the difference between post-score and pre-score. That is, holding all other demographic variables constant, education levels provide influence on workers’ gaining new knowledge. Education levels here appear to contribute in worker’s learning procedure. Workers with higher level of education have more improvements after the seminar, whereas workers with no high school education do not gain knowledge after the seminar (and actually, the coefficient is negative for this level).
Obtaining advice from both families and other planning tools tend to be positively correlated with the score differences. Holding pre-seminar score constant, workers who have sought advice from various resources are achieving higher post-seminar score. Thus, it may be suggesting that people who are willing to seek information are better at learning knowledge. However, the interaction of the total three groups of advice tends to have significant negative effect on learning (with σ = 0.843).
How knowledge score affects workers’ retirement planning
I created two variables to detect attendants’ planning situation before and after the seminar. I chose almost every question from “retirement plan” section of the data excluding the ones that ask for health expectation and the ones related to their spouse (see appendix III for details). From these questions, I generated variables that show how many questions that workers place “don’t know” and “empty” as answers. The reason for me to do so is that, leaving some questions unanswered (but finished the whole surveys) may imply the same meaning as of “don’t know”, when “Don’t Know” is not a choice provided in the survey. The status “don’t know” implies that a worker have no idea about one retirement planning problem and thus, means that he/she is not ready to plan this problem. The distribution of the pre- and post- “don’t know” score is shown in Figure 2. There is an shift of the mean from right to left after the seminar.
[Figure 2] I performed two models:
(3) pre-“don’t know” score =α3 + ß 1 age + ß 2 gender + ß 3 marriage status + ß 4
levels of wealth + ß 5 Families and Relatives and Friends+ ß 6 BD provided source + ß 7
advice * BD provided source + ß 10 Families and Relatives and Friends * BD provided
source levels of education + ß 11 pre-score + ß 12 Lecture fixed impact + ɛ3
(4) post-“don’t know” score =α4 + γ1 age + γ2 gender + γ3 marriage status + γ4
levels of wealth + γ5 Families and Relatives and Friends+ γ6 BD provided source + γ7
Other advice + γ8 Other advice * Families and Relatives and Friends + γ9 Other advice *
BD provided source + γ10 Families and Relatives and Friends * BD provided source
levels of education + γ11 pre-score + γ12 Lecture fixed impact + γ13 post-score + ɛ4
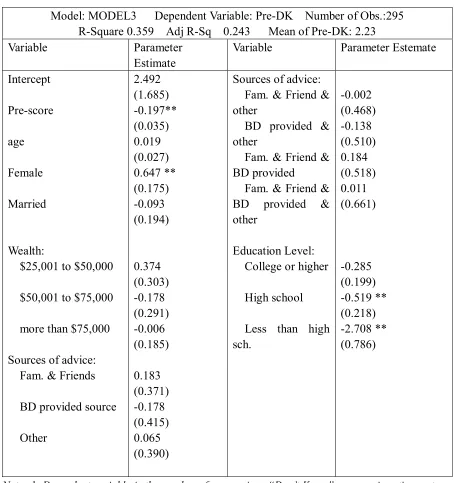
I am expecting to see that in model (3), holding demographic variables constant, the more knowledge implies the less “don’t know” score. In model (4), I am expecting to see that post-score has impact on workers’ answering post-retirement plan. Both results are provided in Table 7 and 8.
The coefficient of female is significantly positive, which may worth of paying attention to. It is either because women are more conservative when answering surveys than men do, or it is just that women tend to be more lack of planning than men do.
For sources of advice, there is no statistically significant coefficient, which is not what I expected to see. However, it is worth noticing that the coefficient of “Families and Relatives and Friends” is positive. The implicit explanation may be that advice from unofficial source can be misleading.
shown in Table 9 (a). The mean difference is only 0.5, which is not so large, but it is statistically significant as shown in Table 9 (b). Note the “Don’t Know” score is increasing, which implies, by my definition, that lack of retirement planning is increasing after the seminars are given.
Conclusion
This thesis answers two questions using BD data from PARS program. First question is what factors effect pre-and post-seminar retirement-related knowledge scores. Second question is how these scores affect workers’ retirement planning. There is a statistically significant increase in the knowledge score between pre- and post seminar score, which indicates that workers were really getting educated through this program. I also observed some differences in the mean of pre- and post-score across different demographic groups. Mean score value across the group of planning tools shows workers who received formal type of counseling regarding retirement plan prior to the seminar, tended to gain higher pre-seminar knowledge score.
Higher educated workers appear to be better at learning new information and have higher increase in knowledge score. As shown in the regression result, the highest level of wealth shows statistic significant impact on pre-seminar score. No other demographic variable is found to be significant.
Besides pre-seminar score and education level, “resources for gaining advice” is also a significant variable to influence post-seminar score.
Before the education program, knowledge score is significantly related to workers’ retirement planning. The higher the score is, the less “unknown” answers appear in retirement planning questions. Marriage and financial wealth (although not significant) also helps decrease the “Don’t Know” answers. Gender of female and advice from family and relatives are positively correlated to the number of appearance of “Don’t Know” answers.
Tables
Table 1 Sample’s economic and demographic information
Variable Median\ percent
Age 58
Years of service in BD 25
Female 54.24 percent
Married\living with partner 77.62 percent
Median earning $25,001 to $50,000
College degree or more 44.06 percent
Median value of SIP account Three to five years salary
Median financial wealth $50,001 to $75,000
Spouse\partner having pension plan 48.97 percent
Spouse\partner having 401(k) account 72.91 percent
Median Spouse\partner year earn $25.001 to $50,000
Table 1 Continued
Median expected total income of 1st year after retirement
Between 61 percent to 70 percent
Number of Observations 295
Note: Sample size decreased to 295 because of regression restrictions. However, this restricted sample has the same economic and demographic information as the
Table 2 (a) Sample average Pre- and Post-scores
Average score Standard Deviation
Pre-seminar 6.61 2.58
Post-seminar 8.23 2.40
Table 2 (b) Test for knowledge score difference
T statistic Degree of Freedom Prob > t
Table 3 Pre- and Post-scores across groups
Pre-seminar Score
Post-seminar Score (change)
Group Number of
respondents
Mean: 6.61 Mean: 8.23
Age: 50 to 55 56 to 60 61 to 65
32 178 85 6.03 6.60 6.86 8.00 (1.97) 8.27 (1.67) 8.25 (1.39) Gender: * Male Female 134 161 7.14 6.17
8.60 (1.46 **) 7.93 (1.76 **)
Marriage status: Single married divorced widowed separated
living with partner
Table 3 Continued
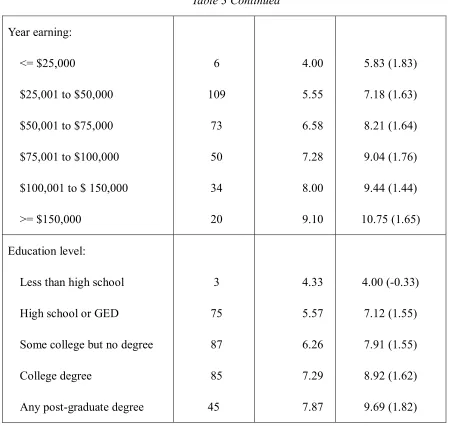
Year earning: <= $25,000
$25,001 to $50,000 $50,001 to $75,000 $75,001 to $100,000 $100,001 to $ 150,000 >= $150,000 6 109 73 50 34 20 4.00 5.55 6.58 7.28 8.00 9.10 5.83 (1.83) 7.18 (1.63) 8.21 (1.64) 9.04 (1.76) 9.44 (1.44) 10.75 (1.65) Education level:
Less than high school High school or GED
Some college but no degree College degree
Any post-graduate degree
Table 3 Continued
SIP value:
Less than one year salary One to two years salary Three to five years salary More than five years salary
37 78 103 64 5.43 6.33 7.22 7.19 7.67 (2.24) 8.00 (1.67) 8.80 (1.57) 8.33 (1.14) Financial wealth: <= $25,000
$25,001 to $50,000 $50,001 to $75,000 $75,001 to $100,000 $100,001 to $ 250,000 >= $250,000 110 23 27 25 54 56 5.95 5.91 6.07 6.68 7.30 7.75 7.72 (1.77) 7.17 (1.26) 8.25 (2.18) 8.40 (1.72) 8.54 (1.24) 9.28 (1.54) Note: 1.* means knowledge scores are significantly different across this group. 2. **
Table 4 Pre-seminar score in groups of planning tools
Have used it (Number of respondents)
Have not used it
Family and relatives 6.36 (122) 6.70
Colleagues and friends 6.55 (119) 6.59
Benefit office 7.05 (99) 6.33 ***
1-to-1 telephone counseling 6.96 (46) 6.50
Internet 7.69 (74) 6.20 ***
Newspapers, planning books, business magazines
7.80 (83) 6.10 ***
Financial advisor 7.55 (97) 6.10 ***
Provider of SIP 6.90 (49) 6.51
Financial planning website 8.22 (41) 6.30 ***
Table 5 Model (1)
Model: MODEL1 Dependent Variable: pre-score Number of Obs.: 295 R-Square: 0.3539 Adj R-Sq: 0.240 Mean of Pre-score: 6.61
Variable Parameter Estimate Variable Parameter Estimate Intercept
age Female Married
Wealth:
$25,001 to $50,000 $50,001 to $75,000 more than $75,000
Sources of advice: Fam. & Friends BD provided source Other 1.326 (3.075) 0.050 (0.050) -0.156 (0.320) 0.138 (0.353) -0.057 (0.552) -0.844 (0.529) 0.639 ** (0.341) -0.562 (0.676) 0.682 (0.757) 0.969 (0.709)
Sources of advice: Fam. & Friend & other
BD provided & other
Fam. & Friend & BD provided
Fam. & Friend & BD provided & other
Education Level: College or higher High school Less than high sch. 0.477 (0.855) -0.054 (0.931) -0.409 (0.945) -0.132 (1.207) 0.449 (0.362) -0.276 (0.399) -1.313 (1.401)
Table 6 Model (2)
Model: MODEL2 Dependent Variable: post-score Number of Obs.: 295 R-Square 0.635 Adj R-Sq 0.568 Mean of post-score: 8.23
Variable Parameter Estimate Variable Parameter Estimate Intercept Pre-score age Female Married Wealth:
$25,001 to $50,000 $50,001 to $75,000 more than $75,000
Sources of advice: Fam. & Friends BD provided source Other 7.295 ** (2.150) 0.545 ** (0.044) -0.045 (0.035) -0.130 (0.224) -0.343 (0.247) -0.721 ** (0.386) 0.212 (0.372) -0.209 (0.236) -0.837 ** (0.473) -0.135 (0.530) -0.803 (0.497)
Sources of advice: Fam. & Friend & other
BD provided & other
Fam. & Friend & BD provided
Fam. & Friend & BD provided & other
Education Level: College or higher High school Less than high sch. 1.654 ** (0.598) 0.515 (0.651) 0.747 (0.660) -1.528 ** (0.843) 0.506 ** (0.254) -0.142 (0.279) -1.841 ** (0.981)
Table 7 Model (3)
Model: MODEL3 Dependent Variable: Pre-DK Number of Obs.:295 R-Square 0.359 Adj R-Sq 0.243 Mean of Pre-DK: 2.23
Variable Parameter
Estimate
Variable Parameter Estemate Intercept Pre-score age Female Married Wealth:
$25,001 to $50,000 $50,001 to $75,000 more than $75,000 Sources of advice:
Fam. & Friends BD provided source Other 2.492 (1.685) -0.197** (0.035) 0.019 (0.027) 0.647 ** (0.175) -0.093 (0.194) 0.374 (0.303) -0.178 (0.291) -0.006 (0.185) 0.183 (0.371) -0.178 (0.415) 0.065 (0.390)
Sources of advice: Fam. & Friend & other
BD provided & other
Fam. & Friend & BD provided
Fam. & Friend & BD provided & other
Education Level: College or higher High school Less than high sch. -0.002 (0.468) -0.138 (0.510) 0.184 (0.518) 0.011 (0.661) -0.285 (0.199) -0.519 ** (0.218) -2.708 ** (0.786)
Table 8 Model (4)
Model: MODEL 4 Dependent Variable: Post-DK Number of Obs.: 295 R-Square 0.377 Adj R-Sq 0.261 Mean of Post-DK: 1.65
Variable Parameter Estimate Variable Parameter Estimate Intercept Pre-score Post-score age Female Married Wealth:
$25,001 to $50,000 $50,001 to $75,000 more than $75,000 Sources of advice:
Fam. & Friends BD provided source Other 0.495 (1.607) -0.201** (0.041) -0.011 (0.046) 0.045 ** (0.026) 0.585 ** (0.164) -0.028 (0.181) -0.312 (0.284) -0.395 (0.272) -0.095 (0.173) 0.028 (0.348) -0.117 (0.388) -0.368 (0.365)
Sources of advice: Fam. & Friend & other
BD provided & other
Fam. & Friend & BD provided
Fam. & Friend & BD provided & other
Education Level: College or higher High school Less than high sch. -0.099 (0.444) 0.186 (0.476) -0.281 (0.484) 0.147 (0.621) -0.119 (0.187) 0.118 (0.204) -1.531 ** (0.722)
Table 9 (a) “Don’t Know” score
Average score Standard Deviation
Pre-seminar 2.23 1.418
Post-seminar 1.65 1.339
Table 9 (b) Test for “Don’t Know” score differences
T statistic Degree of Freedom Prob > t
Figures
Figure 1 Distribution of knowledge score before and after the
seminar
Distribution of knowledge score
0 10 20 30 40 50 60 70
score
n
u
mb
er
o
f
p
eo
p
le
value of s1 value of s2
Figure 2 Distribution of “Don’t Know” score in retirement planning questions
distribution of "don't know" score
0 10 20 30 40 50 60 70 80 90 100
score
n
u
mb
er
o
f
p
eo
p
le
value of pre-"don't know" score value of post-"don't know" score
References
Ameriks, J., Caplin, A., & Leahy, J. (2003, August). Wealth Accumulation and The Propensity to Plan. The Quarterly Journal of Economics, 1007-1047.
Bernheim, B.D. (1991). The Vanishing Nest Egg: Reflections on Saving in America. Priority Press, New York.
Bernheim, D., & Garrett, D.M. (1996). The determinants and consequences of financial education in the workplace: Evidence from a survey of households, working paper. Retrieved from http://www.nber.org/papers/w5667.pdf.
Bernheim, B.D., Garrett, D.M., & Maki, D.M. (2001). Education and Saving: The Long-Term Effects of High School Financial Curriculum Mandates. Journal of Public Economics, 80, 435 – 465.
Browning, M., & Lusardi, A. (1996, December). Household Saving: Micro Theories and Micro Facts, Journal of Economic Literature, 34 (4), 1797-1855.
Clark, R.L., Morrill, M.S., & Allen, S.G. (2009a). Employer-Provided Retirement Planning Programs, unpublished paper.
Clark, R.L., Morrill, M.S., & Allen, S.G. (2009b). The Role of Financial Literacy and Knowledge in Determining Retirement Plans. Retrieved from http://www.mgt.ncsu.edu/projects/finra/downloads/retirement-plans-paper-09.07.200 9.pdf.
Duflo, E., & Saez, E. (2003, August). The Role of Information and Social Interactions in Retirement Plan Decisions: Evidence from A Randomized Experiment, The Quarterly Journal of Economics, 815-842.
Hilgert, M.A., & Hogarth, J.M. (2003, July). Household Financial Management: The Connection between Knowledge and Behavior, Federal Reserve Bulletin, pp 309 – 322.
Lusardi, A. (1999). "Information, Expectations, and Savings for Retirement". In Behavioral Dimensions of Retirement Economics, Washington, D.C.: Brookings Institution Press and Russell Sage Foundation.
Lusardi, A. (2002). Preparing for retirement: The importance of planning costs, working paper. Retrieved from http://www.dartmouth.edu/~alusardi/Papers/Lusardi.pdf. Lusardi, A. (2008). Household Saving Behavior: the Role of Financial Literacy,
Information, and Financial Education Programs, working paper 13824. Retrieved from http://www.nber.org/papers/w13824.
Lusardi, A., & Mitchell, O.S. (2005). Financial Literacy and Planning: Implications for Retirement Wellbeing, working paper. Retrieved from http://ssrn.com/abstract=881847.
Lusardi, A., Mitchell, O.S. (2009, September). How Ordinary Consumers Make Complex Economic Decisions: Financial Literacy and Retirement Readiness, working paper. Retrieved from http://papers.ssrn.com/sol3/papers.cfm?abstract_id=1472288.
Mitchell, O.S. (1988, Januarary). Worker Knowledge of Pension Provisions. Journal of Labot Economics, 6(1), 21-39
Pigou, A.C., & Aslanbeigui, N. (1952). The Economics of Welfare. London: Macmilli and Co. Limited.
Sanchez, M.E., & Morchio, G. (1992). Probing “Don’t Know” Answers: Effects on Survey Estimates and Variable Relationships, The Public Opinion Quarterly, 56 (4), 454-474.
Appendix I Knowledge Questions
Financial related:
1. True or false? “Buying a single company stock usually provides a safer return than a diversified portfolio.”
2. Assume that your retirement income increases by 2 percent per year and that the annual rate of inflation is 4 percent per year. After one year, will you be able to:
a) buy more goods and services? b) buy fewer goods and services?
c) buy exactly the same amount of goods and services? d) don’t know
Social Security and Medicare Programs
3. What is the earliest age that you can start Social Security benefits?
4. What is the age that you can receive a full or unreduced Social Security benefit (“normal retirement age”)?
5. If you start Social Security benefits at the earliest possible age, you will receive a benefit that is __ percent of the benefit you would have received at the normal retirement age.
6. Is the reduction in Social Security benefits for early retirement permanent or does the reduction end when you reach the normal retirement age?
7. After you start receiving Social Security benefits, these benefits are: a) the same for the rest of my life
b) increased annually by the rate of inflation
c) increased annually but by less than the rate of inflation d) increased annually but by more than the rate of inflation e) Don’t know
Company-Specific Questions
9. Can you take a lump sum distribution of some or all of your pension plan (do not include income for your 401(k) account)
10. Does your company offer you the opportunity to stay in the company health plan after you retire?
11. Does your company offer any type of phased retirement, flexible work options, or the opportunity to work part-time after you retire?
12. The monthly pension benefit that you will receive from your current employer will:
a) stay the same for the rest of your life
b) be increased annually by the rate of inflation
Appendix II Tools for planning
1. Have you used family and relatives for information prior to attending this program on important financial and retirement decisions?
2. Have you used colleagues and friends for information prior to attending this program on important financial and retirement decisions?
3. Have you used benefit office for information prior to attending this program on important financial and retirement decisions?
4. Have you used one-on-one telephone counseling for information prior to attending this program on important financial and retirement decisions?
5. Have you used internet for information prior to attending this program on important financial and retirement decisions?
6. Have you used newspapers, planning books and business magazines for information prior to attending this program on important financial and retirement decisions?
7. Have you used financial advisor for information prior to attending this program on important financial and retirement decisions?
8. Have you used current provider of your Savings Incentive Plan for information prior to attending this program on important financial and retirement decisions?
Appendix III retirement planning with “don’t know” as answer
1. At what age do you expect to retire from your company?
2. At what age do you expect to start receiving Social Security benefits?
3. How much money do you expect to receive each month from Social Security? 4. Do you expect to work for pay after retiring from your company?
5. Are you planning on buying a life annuity with your retirement savings?
6. If you are covered by your company’s pension plan, how much do you expect to receive from that plan each year?
7. What do you think your total income from your own Savings Incentive Plan, pension, and Social Security and that of your spouse or partner will be in the first year of retirement?