INVESTIGATION
Mitotic Accumulation of Dimethylated Lysine 79 of
Histone H3 Is Important for Maintaining Genome
Integrity During Mitosis in Human Cells
Brent J. Guppy and Kirk J. McManus1 Manitoba Institute of Cell Biology, Department of Biochemistry and Medical Genetics, University of Manitoba, Winnipeg, Manitoba R3E 0V9, Canada
ABSTRACTThe loss of genome stability is an early event that drives the development and progression of virtually all tumor types. Recent studies have revealed that certain histone post-translational modifications exhibit dynamic and global increases in abundance that coincide with mitosis and exhibit essential roles in maintaining genomic stability. Histone H2B ubiquitination at lysine 120 (H2Bub1) is regulated by RNF20, an E3 ubiquitin ligase that is altered in many tumor types. Through an evolutionarily conservedtrans-histone pathway, H2Bub1 is an essential prerequisite for subsequent downstream dimethylation events at lysines 4 (H3K4me2) and 79 (H3K79me2) of histone H3. Although the role that RNF20 plays in tumorigenesis has garnered much attention, the downstream components of thetrans-histone pathway, H3K4me2 and H3K79me2, and their potential contributions to genome stability remain largely overlooked. In this study, we employ single-cell imaging and biochemical approaches to investigate the spatial and temporal patterning of RNF20, H2Bub1, H3K4me2, and H3K79me2 throughout the cell cycle, with a particular focus on mitosis. We show that H2Bub1, H3K4me2, and H3K79me2 exhibit distinct temporal progression patterns throughout the cell cycle. Most notably, we demonstrate that H3K79me2 is a highly dynamic histone post-translational modification that reaches maximal abundance during mitosis in an H2Bub1-independent manner. Using RNAi and chemical genetic approaches, we identify DOT1L as a histone methyltransferase required for the mitotic-associated increases in H3K79me2. We also demonstrate that the loss of mitotic H3K79me2 levels correlates with increases in chromosome numbers and increases in mitotic defects. Collectively, these data suggest that H3K79me2 dynamics during mitosis are normally required to maintain genome stability and further implicate the loss of H3K79me2 during mitosis as a pathogenic event that contributes to the development and progression of tumors.
KEYWORDSchromosomal instability; H2Bub1; H3K79me2; mitotic increase; RNF20; DOT1L
G
ENOME instability is a driver in the tumorigenic process and is observed in virtually all tumor types (Michoret al.2005). Genome instability is associated with highly aggressive tumors, the acquisition of multidrug resistance, and conse-quently poor patient prognosis (Nakamuraet al.2003; Walther
et al.2008; Leeet al.2011). Despite these associations, very little is known about the aberrant molecular origins that cause genome instability. Thus, studies aimed at identifying and char-acterizing the molecular events that contribute to genome in-stability will shed novel insight into the tumorigenic process.
Over the past few decades, a wealth of studies has cor-related aberrant patterning of histone post-translational modifications (PTMs) with the development and progression of cancer. Histones are the primary compaction units of DNA and are the substrates for numerous PTMs including acety-lation, phosphoryacety-lation, methyacety-lation, and ubiquitination. Histone PTMs have classically been examined in the context of gene expression and regulation and typically at the single-gene or single-nucleosome resolution. However, recent evi-dence has emerged that shows the global abundance of certain histone PTMs is highly dynamic and maximal during mitosis, when transcription rates are extremely low (Taylor 1960). Included among these dynamic PTMs are H3S10ph (histone H3 phosphorylation at serine 10) (Hendzel et al.
1997; Goto et al.2002), H3K9me3 (histone H3 trimethyla-tion at lysine 9) (Peterset al.2001; McManuset al.2006a), and H4K20me (histone H4 monomethylation at lysine 20) (Houstonet al.2008). The misregulation of these PTMs has
Copyright © 2015 by the Genetics Society of America doi: 10.1534/genetics.114.172874
Manuscript received November 18, 2014; accepted for publication December 19, 2014; published Early Online December 22, 2014.
Available freely online through the author-supported open access option.
Supporting information is available online athttp://www.genetics.org/lookup/suppl/ doi:10.1534/genetics.114.172874/-/DC1.
functional implications in chromosome biology and is known to affect mitotic fidelity through a variety of pathways, in-cluding chromosome condensation (Weiet al.1999), chromo-some segregation (McManus et al. 2006a), and kinetochore structure (Heit et al.2009). Thus, disrupting the normal mi-totic dynamics of certain histone PTMs may be a contributing factor in tumorigenesis. Indeed, many of the genes encoding the corresponding regulating enzymes (e.g.,AURKB,SUV39H1,
SETD8, etc.) are somatically altered in numerous tumor types, including lung, breast, and colon cancers (Forbeset al.2011), suggesting that aberrant expression and/or function of these enzymes may be causally linked to cancer (Thompsonet al.
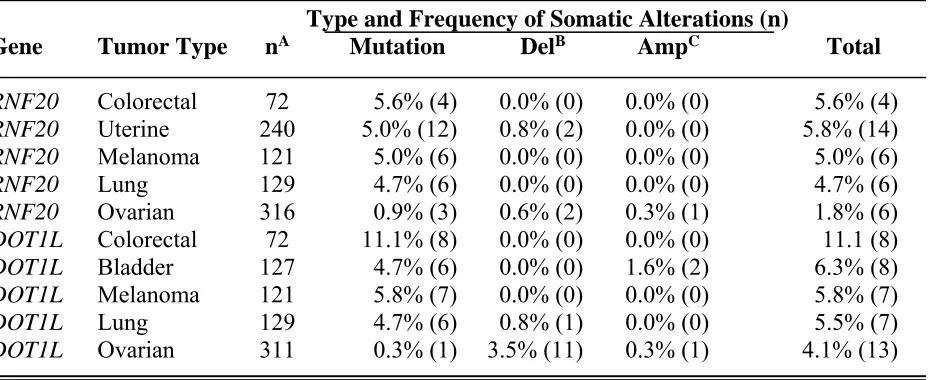
2013). Thus, characterizing the cell cycle dynamics of mi-totic-associated histone PTMs and identifying the enzymes that regulate these dynamic PTMs will provide insight into the etiological origins of genome instability and tumorigenesis. RNF20 is an evolutionarily conserved E3 ubiquitin ligase that regulates the abundance of H2Bub1 (histone H2B mono-ubiquitinated at lysine 120) (Shema et al.2008). RNF20 is somatically mutated in a number of tumor types (Supporting Information,Table S1), and aberrant H2Bub1 levels are as-sociated with genome instability (Chernikova et al. 2012). However, the biological consequences of aberrant RNF20 ex-pression are not limited to H2Bub1, as an evolutionarily con-served trans-histone pathway exists where H2Bub1 is an essential upstream prerequisite for subsequent dimethylation events that occur on histone H3 at lysines 4 (H3K4me2) and 79 (H3K79me2) (Doveret al.2002; Fenget al.2002; Nget al.
2002; Sun and Allis 2002). Given the hierarchal position of RNF20 and H2Bub1 within the trans-histone pathway, the impact aberrant levels of H3K4me2 and H3K79me2 have on genomic instability is poorly understood. Accordingly, characterizing the global abundance of these histone PTMs throughout the cell cycle and evaluating their roles in genome stability will provide new insight into the mechanisms re-quired to maintain genome stability.
In this study, we characterize the spatial and temporal dynamics of key components in a trans-histone pathway (RNF20, H2Bub1, H3K4me2, and H3K79me2) throughout the cell cycle. Using imaging microscopy and biochemical approaches, we show that RNF20 and H2Bub1 are highly dynamic. In interphase, RNF20 is spatially confined within the nucleus and corresponding global levels of H2Bub1 are maximal. However, as cells enter mitosis, RNF20 relocates from the compacting chromosomes into the cytoplasm, and H2Bub1 levels are rapidly lost such that they are no longer detectable within metaphase chromosomes. We also charac-terize distinct cell cycle kinetics for H3K4me2 and H3K79me2 that are independent of H2Bub1 during mitosis. While the global abundance of H3K4me2 remains relatively constant throughout the cell cycle, H3K79me2 levels are highly dynamic but opposite to those of H2Bub1. Surprisingly, H3K79me2 attains maximal abundance during mitosis, suggesting it may have a functional role in mitotic chromosome biology and genome stability. In support of this possibility, we iden-tified DOT1L as a mitotic-specific H3K79me2 histone
meth-yltransferase. Using RNAi and chemical-based approaches, we show that the loss of mitotic H3K79me2 is associated with genome instability that manifested as increases in ab-errant chromosome numbers. Collectively, these data indi-cate there is a functional uncoupling of the trans-histone pathway specifically during mitosis. They further show that misregulation of mitotic increases in H3K79me2 is associ-ated with genome instability and supports the possibility that aberrant regulation of mitotic H3K79me2 levels may be a pathogenic event that contributes to tumorigenesis.
Materials and Methods
Cell culture
HCT116 cells (human epithelioid colorectal carcinoma) were purchased from American Type Culture Collection (Rockville, MD) and the immortalized (telomerase) BJ normal skin
fibroblasts (hTERT) were a generous gift from C. P. Case (University of Bristol, Bristol, UK). HCT116 cells were grown in modified McCoy’s 5A (HyClone, Logan, UT) and hTERT cells were grown in Dulbecco’s modified Eagle’s medium (HyClone). Both media were supplemented with 10% fetal bovine serum. Cells were grown in a 37°humidified incuba-tor containing 5% CO2. Cell lines were authenticated on the basis of recovery, viability, growth, morphology, and spectral karyotyping (Sajeshet al.2013).
Peptide competition and dot blot assays
Antibody epitope specificities were evaluated by immunofl uo-rescent peptide competition assays and dot blot assays as detailed previously (McManus and Hendzel 2005a). Briefly, the H2Bub1, H3K4me2, and H3K79me2 antibodies were pre-incubated with a 10-fold molar excess with specific or nonspe-cific peptides at 4°for 16 hr, and indirect immunofluorescent imaging was performed as described below. Dot blot assays were performed by dispensing 20 ng of each peptide (control or experimental) onto a 0.2-mm PVDF membrane. Peptide ali-quots were allowed to dry and antibody specificity was deter-mined using a standard Western blot approach (McManus and Hendzel 2005a). The H2Bub1 peptide was custom synthesized by Biomatik (Cambridge, ON, Canada), while the remaining peptides were purchased from Abcam: H2B (ab5489), H3 (ab7228), H3K4me1 (ab8895), H3K4me2 (ab7766), H3K4me3 (ab8580), H3K79me1 (ab4555), H3K79me2 (ab4556), and H3K79me3 (ab4557).
Western blot
Western blots were performed as detailed previously (McManus and Hendzel 2005a).Table S2lists the primary and secondary antibodies and dilutions employed. Loading controls include
a-tubulin; unmodified histone H3; or copper phthalocyanine tetrasulfonic acid tetrasodium salt (CPTS), a protein stain. Western blot images were imported into ImageJ software (v1.48s) and background-corrected mean signal intensities were normalized to respective loading controls.
Indirect immunofluorescence
Asynchronous cells were seeded onto sterilized glass cover-slips 1 day prior to analysis, such that they were80%
con-fluent the following day. Cells were fixed, permeabilized, immunofluorescently labeled, and counterstained with DAPI as detailed elsewhere (McManus and Hendzel 2003). Table S2presents the antibodies and dilutions employed. An anti-gen retrieval step was employed prior to indirect immunofl u-orescence (IIF) labeling with the H2Bub1 antibody. Briefly, cells werefixed in paraformaldehyde for 10 min, washed twice in nanopure water, permeabilized with ice-cold (220°) ace-tone for 2 min, and rinsedfive times with nanopure water. Cells were incubated in 2 N HCl for 15 min at room temper-ature prior to neutralization with two washes of 0.1 M NaBorate (pH 8.5) for 2 min each. Cells were incubated in PBS (pH 7.4) for 5 min prior to IIF labeling as above.
Gene silencing (small inhibitory RNA)
A lipid-based transfection method (RNAiMAX; Invitrogen, Carlsbad, CA) was employed to deliver small inhibitory RNA (siRNA) duplexes into HCT116 cells as described in Barber
et al. (2008). Cells were seeded in six-well dishes at a cell density of 210,000 cells per well (HCT116) and permitted to grow for 24 hr prior to treatment. Cells were transfected according to the manufacturer’s instructions with 30 pmol of siRNA diluted in 6ml of RNAiMAX. Cell culture media were replaced 24 hr post-transfection and every 48 hr thereafter.
DOT1L inhibition
Cells were seeded as above [Gene silencing (small inhibitory RNA)] and incubated with 5mM SGC0946 (Selleck Chem-icals), an established DOT1L inhibitor (Yu et al. 2012), or DMSO (vehicle control). Cells were incubated with chemi-cals for either 2 or 48 hr.
Cell synchronization
A standard nocodazole arrest was employed to generate a mitotic-enriched population of cells as detailed elsewhere (McManus and Hendzel 2005a). Briefly, asynchronous cells were treated with 15 nM nocodazole (Sigma-Aldrich, St. Louis) for 14 hr prior to harvesting. Flow cytometric cell cycle analyses were performed following propidium iodide incor-poration as detailed elsewhere (McManuset al.2006a).
Image acquisition and deconvolution
Imaging was performed using an AxioImager.Z1 (Carl Zeiss, Thornwood, NY) microscope equipped with a 12-bit AxioCam HRm cooled-coupled device camera and a Z-stage motor. All images were collected with a 403oil-immersion plan-neofluar lens [numerical aperture (NA) = 1.3] or a 633oil-immersion plan-apochromat lens (NA = 1.4). All three-dimensional (3D) image series were acquired at 200-nm intervals. Image decon-volution was performed using a maximum-likelihood expecta-tion deconvoluexpecta-tion in AutoQuant X3 (Media Cybernetics), using a constrained iterative algorithm and theoretical point spread functions for 460-nm (DAPI), 505-nm (Alexa Fluor
488), and 565-nm (Cy3) emission wavelengths. Deconvolved images were imported into ImageJ software (v1.48s) and an-alyzed as detailed below. Figures and panels were assembled in Photoshop Creative Suite 6 (Adobe).
Semiquantitative IIF imaging
Two-dimensional (2D) IIF imaging was employed to acquire a minimum of 20 interphase and 20 mitotic cells (prophase, prometaphase, and metaphase) for control and experimen-tal conditions. All images were collected with identical exposure times and thus semiquantitative imaging analyses were used to reveal changes in the global abundance of a particular fluorescently labeled epitope (McManus and Hendzel 2005b). Images were imported into ImageJ soft-ware (v1.48s) and meanfluorescent signal intensities were determined for both the DAPI and H3K79me2 channels for each individual cell. To account for increases in histone con-tents associated with DNA replication, H3K79me2 signal in-tensities were normalized to the corresponding DAPI intensities. Normalized H3K79me2 signal intensities were exported into Prism v6 software (GraphPad) for statistical analyses (see below).
Line scans
A single representative line was placed through an entire nucleus for each condition evaluated (McManuset al.2006b), and a fluorescence intensity profile was generated for each channel, using plot profile tools in ImageJ (v1.48s). Relative
fluorescent intensity values were plotted in Prism v6 software (GraphPad) to allow for the comparison offluorescent inten-sities between channels on a pixel-by-pixel basis. Graphs were exported as Tiff images and assembled in panels, using Photo-shop CS6 (Adobe).
Mitotic chromosome spreads
Subconfluent cells were processed as described elsewhere (Barberet al.2008), and 100 mitotic chromosome spreads for each control and experimental condition were manually evaluated.
Mitotic defect analysis
HCT116 cells were transfected or chemically treated as detailed above. Cells were fixed and immunofluorescently labeled as above, using an anti-H3S10ph antibody to identify mitotic cells (Hendzel et al. 1997). Images were acquired with a Cytation3 Imager (BioTek) equipped with a 103long working distance air lens (UPLFLN103; NA = 0.3). Each experimental condition was repeated at least four times and a minimum of 275 mitotic cells were evaluated per condition. All data were normalized to the respective controls (siGAPDH or DMSO) and are presented as the fold increase in mitotic defects relative to controls.
Statistical analyses
mean values between control and experimental conditions, a P-value ,0.05 was considered significant. For the semi-quantitative IIF analyses, the DAPI-normalized H3K79me2 total signal intensities were employed. All graphs were gen-erated in Prism, exported as Tiff images, and assembled into panels using Photoshop CS6 (Adobe).
Results
RNF20 is rapidly redistributed into the cytoplasm during mitosis
We first wished to determine whether RNF20 exhibits a distinct localization pattern throughout the cell cycle that may affect the temporal progression patterns of H2Bub1, H3K4me2, and H3K79me2. Using an established single-cell
immunofluorescent approach (McManus and Hendzel
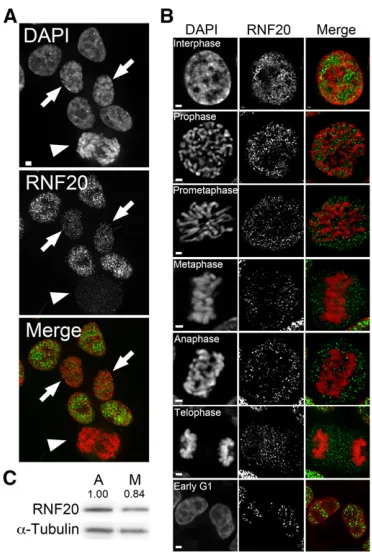
2005b), a validated anti-RNF20 antibody (Figure S1) (Van Pelet al.2013), and asynchronous HCT116 cells, we show that RNF20 exhibits a dynamic localization pattern. In inter-phase cells, RNF20 is spatially confined to the nucleus where it is present as hundreds of immunofluorescent foci that are visually depleted from nucleoli (Figure 1). Line scans of in-terphase nuclei reveal that RNF20 localization is nonrandom (Figure S2). RNF20 is enriched with euchromatin as visually defined by less intensely stained DAPI regions and is depleted from heterochromatin as defined by intensely stained DAPI regions. As cells enter mitosis (i.e., prophase and prometa-phase), RNF20 is rapidly redistributed away from the com-pacting chromosomes and into the cytoplasm (Figure 1B). However, as cells reenter G1, RNF20 is reincorporated and retained within the nucleus. To confirm the above results were not restricted to HCT116 cells, analogous experiments were performed in hTERTs (an immortalized fibroblast cell line) with very similarfindings (Figure S3). Finally, to deter-mine whether changes in RNF20 expression levels accom-pany changes in localization Western blots were performed that show RNF20 levels are relatively consistent between mitotically enriched (Figure S4) and asynchronous (predom-inantly interphase) populations (Figure 1C).
The global abundance of H2Bub1 decreases rapidly during mitosis
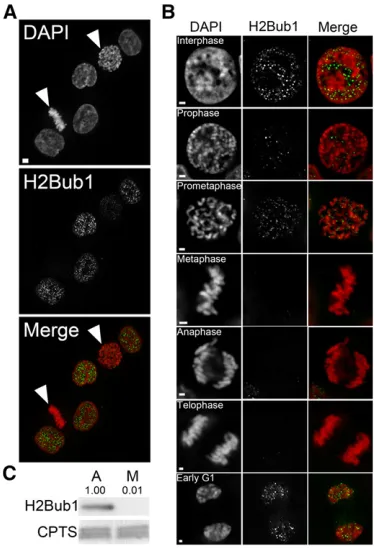
Having established that RNF20 exhibits a dynamic localiza-tion pattern, we now sought to determine whether H2Bub1 would also exhibit dynamic temporal patterning. However, we first confirmed the specificity of the H2Bub1 antibody, using a peptide competition assay and a dot blot assay (Figure S1). Using the single-cell approach employed above, we show that the global abundance of H2Bub1 is highly dynamic (Figure 2). In interphase cells, H2Bub1 localizes within nuclei and forms hundreds of immunofluorescent foci that are depleted from nucleoli. Line scans revealed that the H2Bub1 foci are preferentially enriched within euchromatic regions rather than heterochromatic regions (Figure S2). As cells enter mitosis there is a dramatic decrease in the abun-dance of H2Bub1 such that levels are below the limits of
detection by metaphase. Global levels remain low through-out anaphase and telophase and begin to rise rapidly as cells enter G1(Figure 2B), which coincides with the reincorpora-tion of RNF20 within interphase nuclei. To confirm the above results were not restricted to the HCT116 cells, sim-ilar experiments were performed in hTERT with very simsim-ilar results (Figure S5).
Although thein situdata generated above suggest there is a dramatic loss of H2Bub1 during mitosis, epitope accessibil-ity/occlusion may adversely affect these results, particularly in mitotic cells with extensive chromosome compaction. To address this possibility, standard biochemical approaches were employed, and denaturing Western blots were per-formed on histones isolated from asynchronous or mitotically enriched populations. In agreement with the imaging data, there was a striking decrease in the abundance of H2Bub1 within the mitotic population compared to the interphase (asynchronous) population (Figure 2C). Collectively, the above data show that the global abundance of H2Bub1 is highly
Figure 1 RNF20 is spatially relocalized from interphase chromatin in mi-totic cells. (A) Representative deconvolved image of asynchronous HCT116 cells immunofluorescently labeled with an anti-RNF20 antibody (green) and counterstained with DAPI (red). Arrowhead identifies a mitotic cell, while the arrows identify early-G1cells. Bar, 5mm. (B) High-resolution
(633) deconvolved images depicting the temporal and spatial progres-sion pattern of RNF20 (green) throughout various stages of the cell cycle (indicated). Note that images were acquired using identical exposure times, and thus qualitative comparisons can be made between the various cell cycle stages. Bar, 2mm. (C) Western blot depicting similar levels for RNF20 isolated from asynchronous (A) and mitotic-enriched (M, nocoda-zole treated) HCT116 populations. Semiquantitative analyses were per-formed and the numbers indicate the relative abundance of RNF20 levels following normalization to the respective loading control (a-tubulin).
dynamic and attains maximum and minimum levels dur-ing interphase and mitosis (metaphase to telophase), respectively.
Global abundance of H3K4me2 remains relatively constant throughout the cell cycle
The trans-histone pathway stipulates that H2Bub1 is an es-sential prerequisite for subsequent H3K4me2 and H3K79me2 events. However, this pathway has been investigated only in the context of transcription and thus has been restricted to interphase cells (Doveret al.2002; Fenget al.2002; Nget al.
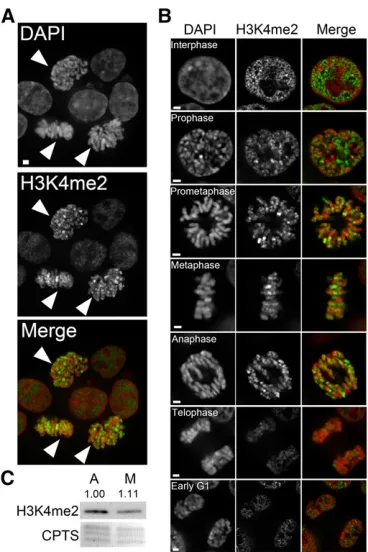
2002; Sun and Allis 2002). We now wished to examine whether this pathway is maintained during mitosis and de-termine whether the global abundance of H3K4me2, like H2Bub1, would also decrease dramatically during mitosis. Using a similar approach and a validated H3K4me2 antibody (Figure S6, A and B), we show that the global abundance of H3K4me2 remains relatively constant throughout the cell cy-cle (Figure 3). In interphase cells, H3K4me2 exists as
hun-dreds of immunofluorescent foci that are highly enriched within nuclei but absent from nucleoli. Line scans revealed that H3K4me2 foci are preferentially enriched within euchro-matin compared to heterochroeuchro-matin (Figure S2). In contrast to H2Bub1, however, the global abundance of H3K4me2 does not decrease rapidly during mitosis but rather is maintained along the length of the chromosome arms in a heterogeneous punctate pattern. hTERT cells were also evaluated and pro-duced very similar results (Figure S7). Finally, denaturing Western blots confirmed the relatively consistent levels (i.e., minimal changes) observed via indirect immunofl uo-rescence (Figure 3C). Collectively, the above data show that the global abundance of H3K4me2 is relatively static through-out the cell cycle.
Global levels of H3K79me2 are dynamic and attain maximal abundance during mitosis
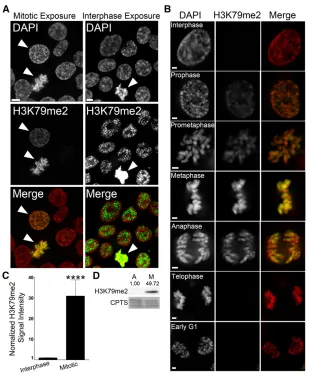
Having established that the temporal dynamics of H3K4me2 are distinct from H2Bub1, we now sought to characterize the temporal and spatial patterning of H3K79me2, using a validated antibody (Figure S6, C and D) and similar ap-proaches. Surprisingly, H3K79me2 levels are highly dy-namic and in stark contrast to those of H2Bub1—minimal H3K79me2 levels occurred during interphase and maximal levels of H3K79me2 occurred during mitosis (Figure 4). The difference in H3K79me2 signal intensities is so pronounced that interphase intensities are not readily detected when the image exposure time is optimized for the mitotic signals (Figure 4A, left). Nevertheless, longer exposure times clearly show H3K79me2 signals within interphase nuclei (Figure 4A, right) that present hundreds of immunofl uores-cent foci, which are enriched within nuclei. Line scans show that H3K79me2 foci are preferentially associated with eu-chromatic regions rather than heteroeu-chromatic regions ( Fig-ure S2). Furthermore, as cells enter prophase there is an increase in H3K79me2 levels throughout the length of the chromosomes that continues until maximal abundance is achieved by metaphase (Figure 4B). As cells enter anaphase and telophase, H3K79me2 levels rapidly decrease and return to basal levels as cells enter G1. Semiquantitative imaging analyses of DAPI-normalized, H3K79me2 total sig-nal intensities revealed a highly statistically significant, 31-fold increase within mitotic cells relative to interphase cells (Figure 4C and Table S3), while Western blots confirmed the large increase in the global levels within mitotically enriched cells (Figure 4D). Analogous experiments were performed in hTERT cells with very similarfindings (Figure S8). Thus, the above data show that the global abundance of H3K79me2 is dynamic, and unlike H2Bub1 it attains maxi-mal levels during mitosis.
DOT1L expression and function are required for the mitosis-specific increases in H3K79me2
The dramatic increase in the abundance of H3K79me2 spe-cifically during mitosis mimics that of other histone PTMs with established roles in chromosome biology and stability
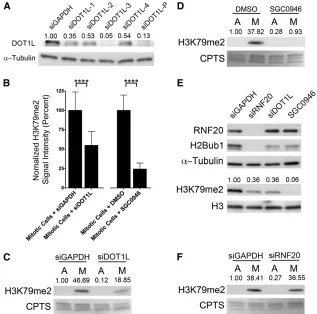
(e.g., H3S10ph, H3K9me2, H4K20me, etc.) and suggests that H3K79me2 may normally participate in chromosome stability. However, before examining this possibility it was necessary to identify the histone methyltransferase required for the mitotic-specific increase in H3K79me2. Currently, DOT1L is the only known H3K79me2-specific methyltrans-ferase (Feng et al.2002). However, its ability to methylate H3K79 during mitosis, independent of H2Bub1, is unknown. To assess DOT1L as a candidate mitotic methyltransferase, complementary siRNA and chemical-based experiments were performed, and the impact on mitotic H3K79me2 was examined. Wefirst evaluated the silencing efficiency of four siRNA duplexes targeting DOT1L relative to untreated and GAPDH-silenced controls within HCT116 cells (Figure 5A). The siDOT1L-3 duplex was deemed the most efficient and was employed in all subsequent analyses.
To determine whether DOT1L silencing affected H3K79me2 levels within the mitotic cells, semiquantitative, single-cell microscopy was performed but the analyses were restricted to mitotic cells. Following silencing, a highly
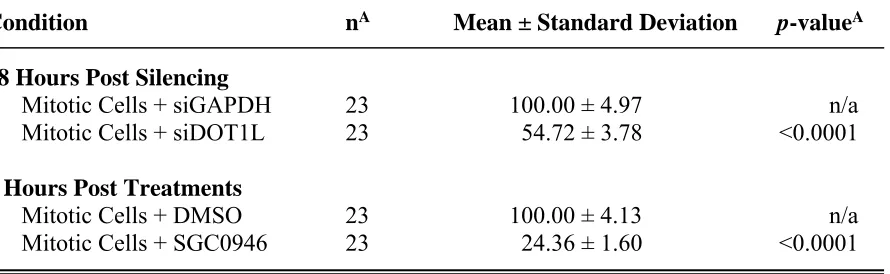
statistically significant decrease (54% of control levels) in the mean DAPI-normalized H3K79me2 total signal inten-sity occurred relative to controls (Figure 5B andTable S4). The large decrease in the mitotic abundance of H3K79me2 was subsequently confirmed by denaturing Western blots, where a decrease in H3K79me2 levels within the mitotically enriched population was readily detected relative to the GAPDH-silenced control (Figure 5C). These data show that DOT1L expression is required for normal H3K79me2 levels to occur within mitotic cells.
To determine whether DOT1L function is essential for the mitotic-associated increases in H3K79me2 levels, and to address potential off-target effects associated with siRNA, similar experiments were performed using SGC0946, an established DOT1L inhibitor (Yuet al.2012), or DMSO. Semi-quantitative microscopy was performed as above on asyn-chronously growing cells, and the analyses were restricted to mitotic cells. In agreement with the silencing data, DOT1L inhibition produced a statistically significant decrease (24% of control levels) in mean DAPI-normalized H3K79me2 total signal intensity within the mitotic cells (Figure 5B andTable S4) that was confirmed by Western blots (Figure 5D). It should be noted that the mitotic decrease in H3K79me2 lev-els was more pronounced following SGC0946 treatment than following DOT1L silencing. Although the underlying mecha-nism accounting for this difference is beyond the scope of the present study, it likely stems from the heterogeneous nature of siRNA-based silencing or more likely the residual amounts of functional DOT1L remaining following silencing. In any case, the siRNA- and chemical-based data show that DOT1L expression and function are normally required to induce the dramatic increase in H3K79me2 levels specifically within mi-totic cells.
H2Bub1 is not a prerequisite for H3K79me2 during mitosis
The observation that the global abundances of H2Bub1 and H3K79me2 are dynamic but opposite in mitosis suggests there is transient uncoupling of the trans-histone pathway during mitosis. Although our initial immunofluorescent and Western blot analyses did not detect H2Bub1 within mitotic cells, the possibility remained that extremely low levels of H2Bub1, be-low the limits of detection, persisted within mitotic cells that could affect H3K79me2 levels. Accordingly, we sought to de-crease any residual H2Bub1 within mitotic cells by silencing RNF20 and examine H3K79me2 levels. However, wefirst
con-firmed the existence of an intacttrans-histone pathway within the interphase cells of our experimental system. As expected, RNF20 silencing dramatically decreased the global abundance of H2Bub1 within interphase cells (Figure 5E, top), and in agreement with previous studies (Nget al.2002; Sun and Allis 2002) also decreased the global abundance of H3K79me2. Although RNF20 silencing reduced H3K79me2 to similar lev-els achieved following DOT1L silencing, SGC0946 treatments appeared to be the most efficient at depleting H3K79me2 within interphase cells (Figure 5E, bottom). However, within
Figure 3 The global abundance of H3K4me2 remains relatively constant throughout the cell cycle. (A) Representative deconvolved image of asyn-chronous HCT116 cells immunofluorescently labeled with an anti-H3K4me2 antibody (green) and counterstained with DAPI (red). Arrowheads identify mitotic cells. Bar, 5 mm. (B) High-resolution (633) deconvolved images depicting the temporal and spatial progression pattern of H3K4me2 (green) throughout the cell cycle (indicated). Note that images were acquired using identical exposure times, and thus qualitative comparisons can be made between the various stages. Bar, 2mm. (C) Western blot depicting similar levels of H3K4me2 in both asynchronous (A) and mitotic-enriched (M) pop-ulations. Semiquantitative analyses were performed and the numbers indi-cate the relative abundance of H3K4me2 following normalization to the respective loading control (CPTS).
mitotically enriched populations (Figure 5F), RNF20 silencing had very little, if any, impact on the global abundance of H3K79me2 and supports the transient uncoupling of the
trans-histone pathway during mitosis.
Loss of mitotic-associated H3K79me2 is associated with chromosome instability
The global abundance of many histone PTMs is dynamic and exhibits mitosis-specific increases required for mitoticfidelity and genome stability (Hendzelet al.1997; Gotoet al.2002; McManuset al.2006a; Houstonet al.2008). Thus, we wished to determine whether the large increases in H3K79me2 that occur during mitosis have a similar role. HCT116 cells were purposefully selected for this analysis as they are a karyotyp-ically stable line that has been employed extensively in chro-mosome instability assays (Barberet al.2008; McManuset al.
2009; Sajeshet al.2013; Van Pelet al.2013). Accordingly, we employed DOT1L silencing and inhibition (SGC0946) to de-crease H3K79me2 levels during mitosis and evaluated the impact on chromosome stability within mitotic chromosome spreads (Figure 6A). As predicted, there was an overall in-crease in the number of aberrant spreads within the silenced and inhibited populations relative to controls (Figure 6B).
More specifically, the frequency of spreads harboring .45 chromosomes increased from 18% in GAPDH-silenced con-trols to 30% in DOT1L-silenced cells and from 11% in DMSO-treated controls to 49% in SGC0946-treated cells, which Student’st-tests revealed to be statistically significant (Table S6). Flow cytometry was also performed and
con-firmed that DOT1L silencing and inhibition do not adversely affect cell cycle progression (Figure S9andTable S5). Thus, the loss of H3K79me2 in mitotic cells following DOT1L silenc-ing or inhibition is associated with increases in chromosome numbers and the loss of genome stability.
To gain insight into the mechanism(s) underlying the increases in chromosome numbers observed above, mitotic cells were evaluated for the presence of aberrant mitotic events, including chromosome congression errors, anaphase bridges, and segregation defects (Figure 6C). Mitotic levels of H3K79me2 were depleted as above, and mitotic defects were manually scored. Overall, the loss of H3K79me2 dur-ing mitosis was associated with statistically significant increases (P-value,0.05) in aberrant mitotic events (Figure 6D). More specifically there was a 1.7-fold increase in the DOT1L-silenced cells (9.7%) relative to a siGAPDH-silenced control (5.6%) and a 2.5-fold increase within the
Figure 4 The global abundance of H3K79me2 increases dramatically during mitosis. (A) Representative decon-volved images of HCT116 cells labeled with an anti-H3K79me2 antibody (green) and counterstained with DAPI (red). Arrowheads identify mitotic cells. Bars, 5
SGC0946-treated cells (9.3%) relative to vehicle control (3.7%) (Table S7). Thus, the loss of H3K79me2 levels within mitotic cells is associated with chromosome instability and an increase in aberrant mitotic events, which suggests that the mitotic increases in H3K79me2 levels are required for mitotic
fidelity.
Discussion
In this study, we employ asynchronous and untreated human cell lines along with complementary single-cell microscopy and biochemical approaches to provide thefirstin situspatial and temporal progression patterns of four key components of an established trans-histone pathway, RNF20, H2Bub1, H3K4me2, and H3K79me2. We specifically show that the global abundance of H2Bub1 is highly dynamic and reflects the spatial distribution of RNF20. H2Bub1 levels are highest in interphase, when RNF20 is spatially constrained within the nucleus, and are rapidly lost upon entry into mitosis in a man-ner coincident with RNF20 becoming spatially redistributed away from the chromosomes and into the cytoplasm. To our surprise, and in opposition to the established trans-histone
pathway (Doveret al.2002; Fenget al.2002; Sun and Allis 2002), the temporal progression patterns characterized for H3K4me2 and H3K79me2 were in contrast to that of H2Bub1. While H3K4me2 levels remain relatively constant throughout the cell cycle, H3K79me2 levels are highly dy-namic and are minimal during interphase and maximal dur-ing mitosis. To identify the mechanism responsible for the mitotic-associated increases in H3K79me2, we employed a combination of reverse and chemical genetics and show that DOT1L expression and function are essential requirements. Although our results are most consistent with DOT1L being the mitosis-specific methyltransferase, they do not preclude the possibility that DOT1L indirectly regulates the large mi-totic increases in H3K79me2 abundance through an unknown mechanism. Finally, based on similar dynamics observed for other histone PTMs (e.g., H3S10ph, H3K9me3, and H4K20me2) with established roles in chromosome biology and genome stability, we predicted that H3K79me2 would exhibit a similar role during mitosis. Using siRNA and chem-ical treatments, we show that the loss of H3K79me2 levels during mitosis is associated with increases in chromosome instability and aberrant mitotic events. Collectively, our data
Figure 5 DOT1L expression and function are required for the mitosis-specific increases in H3K79me2. (A) Western blot depicting the abundance of DOT1L fol-lowing silencing with either individual (siDOT1L-1 to -4) or pooled (siDOT1L-P) siRNA duplexes relative to control (siGAPDH). Semiquantitative analyses were performed and the relative abundance of DOT1L fol-lowing normalization to the respective loading control (a-tubulin) is presented. (B) Bar graphs depicting the statistically significant (****P-value ,0.0001) decreases in the mean, DAPI-normalized H3K79me2 total signal intensities in the DOT1L silenced (48 hr post-transfection, left) or inhibited (2 hr treatment, right) cells relative to controls. Note that only the H3K79me2 signal intensities from mitotic cells were imaged, quantified, and presented. (C) Western blots showing the global abundance of H3K79me2 within asynchronous, predominantly interphase cells (A) or mitotically enriched (M) populations of control (siGAPDH) or DOT1L (siDOT1L) silenced cells. The ex-posure time was optimized to display the mitotic H3K79me2 signals and not those within the asynchro-nous populations. Semiquantitative analyses were per-formed and the relative abundance of H3K79me2 following normalization to the respective loading con-trol (CPTS) is shown. Note the large decrease in abun-dance of H3K79me2 within the mitotically enriched population from the DOT1L silenced cells relative to the GAPDH silenced controls. (D) Western blot depict-ing a large decrease in H3K79me2 levels followdepict-ing SGC0946 treatment (48 hr treatment) specifically within the mitotically enriched (M) population. Blots are labeled as in C. (E) Western blots of proteins harvested from asynchronous (predominantly interphase) cells depicting the relative abundance of the indicated proteins and histone PTMs following RNF20 and DOT1L silencing and SGC0946 treatment (48 hr treatment) relative to siGAPDH controls. Semiquantitative analyses were performed and the relative abundance of H3K79me2 following normalization to the respective H3 loading control is shown. Note that RNF20/H2Bub1 depletion is associated with a decrease in H3K79me2 within interphase cells, which supports the existence of atrans -histone pathway. (F) Western blot demonstrating that RNF20 silencing (siRNF20) does not affect the global abundance of H3K79me2 specifically within mitotic cells relative to controls (siGAPDH). Semiquantitative analyses were performed and the relative abundance of H3K79me2 following normali-zation to the respective loading control (CPTS) is shown, suggesting there is an uncoupling of thetrans-histone pathway within mitotic cells.
suggest there is a transient uncoupling of the trans-histone pathway during mitosis, which is normally required to ensure mitoticfidelity and chromosome stability in human cells.
The dynamic temporal progression pattern we observe for H2Bub1 extends the observations of Wu et al. (1981), who showed that ubiquitinated H2B, but not specifically H2Bub1, is reduced within mitotically enriched histones isolated from mouse and Chinese hamster cells. Although it is unclear why there is such a dramatic loss of H2Bub1 during mitosis, there are a number of possibilities. First, because H2Bub1 is associ-ated with transcription (Davie and Murphy 1990; Shemaet al.
2008), the low levels may simply reflect the transcriptionally silent status of mitotic cells (Egliet al.2008). Second, repli-cation-independent nucleosome assembly may occur (Ahmad and Henikoff 2002), which is a mechanism that affects the global abundance of other histone PTMs through histone re-placement. However, replication-independent nucleosome as-sembly is typically associated with transcription and/or DNA repair (Janicki et al. 2004), and neither process occurs to a large extent within mitotic cells. It is also unlikely that this mechanism accounts for the dramatic loss of H2Bub1 along the entire length of the chromosome arms, particularly as they are compacting during mitosis and histone replacement would not be easily achieved. Finally, it is possible that the removal of ubiquitin is a normal prerequisite for proper chromosome con-densation to occur. Ubiquitin is a relatively large 8.5-kDa covalent modification that is added onto the carboxy-terminal tail (K120) of histone H2B (13.8 kDa). It is plausible that
H2Bub1 represents a structural barrier to the compacting mi-totic chromosomes that must be removed for proper compac-tion and segregacompac-tion to occur. In support of this possibility, Fierzet al.(2011) recently showed that H2Bub1 disrupts local and higher-order chromatin compaction in chemically defined nucleosomal arrays. Moreover, studies from a variety of model organisms have shown that higher-order chromosome com-paction is necessary to ensure mitoticfidelity (Weiet al.1999; Buiet al.2004). In any case, the functional significance and underlying mechanism accounting for the loss of mitotic H2Bub1 warrant further investigation.
Numerous studies have characterized the
interrelation-ship of H2Bub1 and H3K79me2 (Chandrasekharan et al.
2010). However, since these studies focused on transcrip-tion, they are biased toward describing relationships within interphase populations. Unlike these previous studies, the present study focuses on the relationship and changes that occur within mitotic populations, when transcription rates are low (Taylor 1960). Given the existence of the well-characterizedtrans-histone pathway, the identification of dis-tinct temporal progression patterns for H2Bub1, H3K4me2, and H3K79me2 during mitosis is surprising. Here we show that the global abundance of H3K4me2 remains relatively consistent throughout the cell cycle and is in agreement with previous work demonstrating that histone methylation was classically considered a static epigenetic mark (Byvoet et al.
1972; Duerre and Lee 1974). Perhaps most interesting is the observation that H3K79me2 levels are highly dynamic and
maximal during mitosis, which are opposite to those of H2Bub1. Our findings support those of Feng et al. (2002), who reported an overall increase in the abundance of H3K79 methylation within mitotically enriched HeLa cells. However, they did not distinguish between the methylation subtypes (i.e., mono-, di-, and trimethylation). More recently, Kimet al.
(2012) employed Western blots to show that H3K79me2 levels are only marginally dynamic within in a lung cancer cell line. Using synchronized populations of cells, they show that H3K79me2 levels peak in S phase, but not during mi-tosis as shown in the present study. Although the underlying reason for this discrepancy is unclear, it may be due to the different cell models employed or to the fundamental differ-ences of population-based, biochemical approaches they employed, relative to the single-cell, semiquantitative imag-ing microscopy employed in the present study. Furthermore, the observations and conclusions of the present study are based on experiments conducted in two distinct cellular contexts (HCT116, transformed epithelial cells; and hTERT, immortalized fibroblast cells) and are in agreement with those gleaned from studies in model organisms including
Trypanosoma brucei(Janzenet al.2006) andSaccharomyces cerevisiae (Schulze et al. 2009). Thus, our data show that H3K79me2 is highly dynamic during mitosis and further suggest that the mitotic-associated dynamics are evolution-arily conserved in eukaryotes.
A number of studies exist that show certain histone PTMs exhibit mitosis-specific increases that are essential for mitotic
fidelity (reviewed in Thompsonet al.2013). Our data show that H3K79me2 levels are dynamic and suggest that these dynamics are essential requirements for genome stability. In support of this possibility, depleting the mitotic-associated levels of H3K79me2 by DOT1L silencing or inhibition was associated with increases in chromosome numbers and aber-rant mitotic events (Figure 6). Interestingly,DOT1Lis somat-ically altered in a number of tumor types (Table S1), and murine models have shown that Dot1l deficiencies correlate with increases in DNA content (Joneset al.2008; Barryet al.
2009). Accordingly, DOT1L expression and function and con-comitant mitotic increases in H3K79me2 are implicated as essential components required to maintain genome stability in human cells.
In summary, ourfindings show that H2Bub1, H3K4me2, and H3K79me2 exhibit unique temporal progression pat-terns throughout the cell cycle. Of particular interest, we show that H3K79me2 is highly dynamic during mitosis and identify DOT1L as a mitosis-specific histone methyltransfer-ase. We further show that H3K79me2 dynamics are nor-mally required to preserve genome stability, which adds H3K79me2 to the emerging list of histone PTMs with similar dynamics and roles in chromosome biology and genome stability. Thus, our data coupled with DNA sequencing data from various tumor types and recent Dot1l animal models strongly suggest that altered DOT1L function, particularly during mitosis, may be a pathogenic event that drives ge-nome instability and contributes to tumorigenesis.
Acknowledgments
We thank C. P. Case for generously providing the hTERT cells and Abcam for supplying antibodies. We thank Zelda Lichtensztejn, Nermin Moujani, and Alexandra Kuzyk for technical assistance. This work was funded by a Canadian Institutes of Health Research operating grant (MOP-115179) (to K.J.M.) and a Manitoba Health Research Council/CancerCare Manitoba fellowship (to B.J.G.). We also acknowledge the strong support of the Manitoba Institute of Cell Biology and CancerCare Manitoba.
Literature Cited
Ahmad, K., and S. Henikoff, 2002 The histone variant H3.3 marks active chromatin by replication-independent nucleosome assem-bly. Mol. Cell 9: 1191–1200.
Barber, T. D., K. McManus, K. W. Yuen, M. Reis, G. Parmigianiet al., 2008 Chromatid cohesion defects may underlie chromosome instability in human colorectal cancers. Proc. Natl. Acad. Sci. USA 105: 3443–3448.
Barry, E. R., W. Krueger, C. M. Jakuba, E. Veilleux, D. J. Ambrosi et al., 2009 ES cell cycle progression and differentiation re-quire the action of the histone methyltransferase Dot1L. Stem Cells 27: 1538–1547.
Bui, H. T., E. Yamaoka, and T. Miyano, 2004 Involvement of histone H3 (Ser10) phosphorylation in chromosome condensa-tion without Cdc2 kinase and mitogen-activated protein kinase activation in pig oocytes. Biol. Reprod. 70: 1843–1851. Byvoet, P., G. R. Shepherd, J. M. Hardin, and B. J. Noland,
1972 The distribution and turnover of labeled methyl groups in histone fractions of cultured mammalian cells. Arch. Bio-chem. Biophys. 148: 558–567.
Chandrasekharan, M. B., F. Huang, and Z. W. Sun, 2010 Histone H2B ubiquitination and beyond: regulation of nucleosome sta-bility, chromatin dynamics and the trans-histone H3 methyla-tion. Epigenetics 5: 460–468.
Chernikova, S. B., O. V. Razorenova, J. P. Higgins, B. J. Sishc, M. Nicolau et al., 2012 Deficiency in mammalian histone H2B ubiquitin ligase Bre1 (Rnf20/Rnf40) leads to replication stress and chromosomal instability. Cancer Res. 72: 2111–2119. Davie, J. R., and L. C. Murphy, 1990 Level of ubiquitinated
his-tone H2B in chromatin is coupled to ongoing transcription. Bio-chemistry 29: 4752–4757.
Dover, J., J. Schneider, M. A. Tawiah-Boateng, A. Wood, K. Dean et al., 2002 Methylation of histone H3 by COMPASS requires ubiquitination of histone H2B by Rad6. J. Biol. Chem. 277: 28368–28371.
Duerre, J. A., and C. T. Lee, 1974 In vivo methylation and turn-over of rat brain histones. J. Neurochem. 23: 541–547. Egli, D., G. Birkhoff, and K. Eggan, 2008 Mediators of
reprogram-ming: transcription factors and transitions through mitosis. Nat. Rev. Mol. Cell Biol. 9: 505–516.
Feng, Q., H. Wang, H. H. Ng, H. Erdjument-Bromage, P. Tempst et al., 2002 Methylation of H3-lysine 79 is mediated by a new family of HMTases without a SET domain. Curr. Biol. 12: 1052– 1058.
Fierz, B., C. Chatterjee, R. K. McGinty, M. Bar-Dagan, D. P. Raleigh et al., 2011 Histone H2B ubiquitylation disrupts local and higher-order chromatin compaction. Nat. Chem. Biol. 7: 113–119. Forbes, S. A., N. Bindal, S. Bamford, C. Cole, C. Y. Kok et al.,
2011 COSMIC: mining complete cancer genomes in the Cata-logue of Somatic Mutations in Cancer. Nucleic Acids Res. 39: D945–D950.
Goto, H., Y. Yasui, E. A. Nigg, and M. Inagaki, 2002 Aurora-B phosphorylates Histone H3 at serine28 with regard to the mi-totic chromosome condensation. Genes Cells 7: 11–17. Heit, R., J. B. Rattner, G. K. Chan, and M. J. Hendzel, 2009 G2
histone methylation is required for the proper segregation of chromosomes. J. Cell Sci. 122: 2957–2968.
Hendzel, M. J., Y. Wei, M. A. Mancini, A. Van Hooser, T. Ranalli et al., 1997 Mitosis-specific phosphorylation of histone H3 ini-tiates primarily within pericentromeric heterochromatin during G2 and spreads in an ordered fashion coincident with mitotic chromosome condensation. Chromosoma 106: 348–360. Houston, S. I., K. J. McManus, M. M. Adams, J. K. Sims, P. B.
Carpenter et al., 2008 Catalytic function of the PR-Set7 his-tone H4 lysine 20 monomethyltransferase is essential for mitotic entry and genomic stability. J. Biol. Chem. 283: 19478–19488. Janicki, S. M., T. Tsukamoto, S. E. Salghetti, W. P. Tansey, R. Sachidanandamet al., 2004 From silencing to gene expression: real-time analysis in single cells. Cell 116: 683–698.
Janzen, C. J., S. B. Hake, J. E. Lowell, and G. A. Cross, 2006 Selective di- or trimethylation of histone H3 lysine 76 by two DOT1 homologs is important for cell cycle regulation in Trypanosoma brucei. Mol. Cell 23: 497–507.
Jones, B., H. Su, A. Bhat, H. Lei, J. Bajkoet al., 2008 The histone H3K79 methyltransferase Dot1L is essential for mammalian development and heterochromatin structure. PLoS Genet. 4: e1000190.
Kim, W., R. Kim, G. Park, J. W. Park, and J. E. Kim, 2012 Deficiency of H3K79 histone methyltransferase Dot1-like protein (DOT1L) inhibits cell proliferation. J. Biol. Chem. 287: 5588–5599. Lee, A. J., D. Endesfelder, A. J. Rowan, A. Walther, N. J. Birkbak
et al., 2011 Chromosomal instability confers intrinsic multi-drug resistance. Cancer Res. 71: 1858–1870.
McManus, K. J., and M. J. Hendzel, 2003 Quantitative analysis of CBP- and P300-induced histone acetylations in vivo using native chromatin. Mol. Cell. Biol. 23: 7611–7627.
McManus, K. J., and M. J. Hendzel, 2005a ATM-dependent DNA damage-independent mitotic phosphorylation of H2AX in nor-mally growing mammalian cells. Mol. Biol. Cell 16: 5013–5025. McManus, K. J., and M. J. Hendzel, 2005b Using quantitative imag-ing microscopy to define the target substrate specificities of histone post-translational-modifying enzymes. Methods 36: 351–361. McManus, K. J., V. L. Biron, R. Heit, D. A. Underhill, and M. J.
Hendzel, 2006a Dynamic changes in histone H3 lysine 9 meth-ylations: identification of a mitosis-specific function for dynamic methylation in chromosome congression and segregation. J. Biol. Chem. 281: 8888–8897.
McManus, K. J., D. A. Stephens, N. M. Adams, S. A. Islam, P. S. Freemontet al., 2006b The transcriptional regulator CBP has defined spatial associations within interphase nuclei. PLoS Com-put. Biol. 2: e139.
McManus, K. J., I. J. Barrett, Y. Nouhi, and P. Hieter, 2009 Spe-cific synthetic lethal killing of RAD54B-deficient human colorec-tal cancer cells by FEN1 silencing. Proc. Natl. Acad. Sci. USA 106: 3276–3281.
Michor, F., Y. Iwasa, C. Lengauer, and M. A. Nowak, 2005 Dy-namics of colorectal cancer. Semin. Cancer Biol. 15: 484– 493.
Nakamura, H., H. Saji, A. Idiris, N. Kawasaki, M. Hosaka et al., 2003 Chromosomal instability detected byfluorescence in situ hybridization in surgical specimens of non-small cell lung cancer is associated with poor survival. Clin. Cancer Res. 9: 2294– 2299.
Ng, H. H., R. M. Xu, Y. Zhang, and K. Struhl, 2002 Ubiquitination of histone H2B by Rad6 is required for efficient Dot1-mediated methylation of histone H3 lysine 79. J. Biol. Chem. 277: 34655– 34657.
Peters, A. H., D. O’Carroll, H. Scherthan, K. Mechtler, S. Saueret al., 2001 Loss of the Suv39h histone methyltransferases impairs mammalian heterochromatin and genome stability. Cell 107: 323–337.
Sajesh, B. V., M. Bailey, Z. Lichtensztejn, P. Hieter, and K. J. McManus, 2013 Synthetic lethal targeting of superoxide dismutase 1 selec-tively kills RAD54B-deficient colorectal cancer cells. Genetics 195: 757–767.
Schulze, J. M., J. Jackson, S. Nakanishi, J. M. Gardner, T. Hentrich et al., 2009 Linking cell cycle to histone modifications: SBF and H2B monoubiquitination machinery and cell-cycle regula-tion of H3K79 dimethylaregula-tion. Mol. Cell 35: 626–641.
Shema, E., I. Tirosh, Y. Aylon, J. Huang, C. Yeet al., 2008 The histone H2B-specific ubiquitin ligase RNF20/hBRE1 acts as a pu-tative tumor suppressor through selective regulation of gene expression. Genes Dev. 22: 2664–2676.
Sun, Z. W., and C. D. Allis, 2002 Ubiquitination of histone H2B regulates H3 methylation and gene silencing in yeast. Nature 418: 104–108.
Taylor, J. H., 1960 Nucleic acid synthesis in relation to the cell division cycle. Ann. N. Y. Acad. Sci. 90: 409–421.
Thompson, L. L., B. J. Guppy, L. Sawchuk, J. R. Davie, and K. J. McManus, 2013 Regulation of chromatin structure via histone post-translational modification and the link to carcinogenesis. Cancer Metastasis Rev. 32: 363–376.
van Pel, D. M., I. J. Barrett, Y. Shimizu, B. V. Sajesh, B. J. Guppy et al., 2013 An evolutionarily conserved synthetic lethal inter-action network identifies FEN1 as a broad-spectrum target for anticancer therapeutic development. PLoS Genet. 9: e1003254. Walther, A., R. Houlston, and I. Tomlinson, 2008 Association be-tween chromosomal instability and prognosis in colorectal can-cer: a meta-analysis. Gut 57: 941–950.
Wei, Y., L. Yu, J. Bowen, M. A. Gorovsky, and C. D. Allis, 1999 Phos-phorylation of histone H3 is required for proper chromosome condensation and segregation. Cell 97: 99–109.
Wu, R. S., K. W. Kohn, and W. M. Bonner, 1981 Metabolism of ubiquitinated histones. J. Biol. Chem. 256: 5916–5920. Yu, W., E. J. Chory, A. K. Wernimont, W. Tempel, A. Scoptonet al.,
2012 Catalytic site remodelling of the DOT1L methyltransfer-ase by selective inhibitors. Nat. Commun. 3: 1288.
GENETICS
Supporting Information
http://www.genetics.org/lookup/suppl/doi:10.1534/genetics.114.172874/-/DC1
Mitotic Accumulation of Dimethylated Lysine 79 of
Histone H3 Is Important for Maintaining Genome
Integrity During Mitosis in Human Cells
Brent J. Guppy and Kirk J. McManus
Table S1 Frequency of Somatic Gene Alterations in Cancer
(F
ORBESet al.
2011; C
ERAMIet al.
2012)
.
Type and Frequency of Somatic Alterations (n)
Gene Tumor
Type
n
AMutation Del
BAmp
CTotal
RNF20
Colorectal
72
5.6% (4)
0.0% (0)
0.0% (0)
5.6% (4)
RNF20
Uterine
240
5.0% (12)
0.8% (2)
0.0% (0)
5.8% (14)
RNF20
Melanoma
121
5.0% (6)
0.0% (0)
0.0% (0)
5.0% (6)
RNF20
Lung
129
4.7% (6)
0.0% (0)
0.0% (0)
4.7% (6)
RNF20
Ovarian
316
0.9% (3)
0.6% (2)
0.3% (1)
1.8% (6)
DOT1L
Colorectal
72
11.1% (8)
0.0% (0)
0.0% (0)
11.1 (8)
DOT1L
Bladder
127
4.7% (6)
0.0% (0)
1.6% (2)
6.3% (8)
DOT1L
Melanoma
121
5.8% (7)
0.0% (0)
0.0% (0)
5.8% (7)
DOT1L
Lung
129
4.7% (6)
0.8% (1)
0.0% (0)
5.5% (7)
DOT1L
Ovarian
311
0.3% (1) 3.5% (11)
0.3% (1)
4.1% (13)
B. J. Guppy and K. J. McManus 3 SI
Table S2 Antibodies and Dilutions Employed.
Working
Dilution
AAntibody/Epitope Source
Catalog
No.
Species IIF
BWB
CRNF20 Abcam
ab32629
Rabbit
1:400
1:6,000
H2Bub1 Millipore
05-1312
Mouse
1:200
1:10,000
H3K4me2 Abcam ab32356
Rabbit
1:200
1:5,000
H3K79me2 Abcam ab3594
Rabbit
1:400
1:15,000
H3S10ph Abcam ab14955
Rabbit
1:10,000
1:10,000
DOT1L Abcam
ab180483
Mouse
n/a
1:2,000
α
-Tubulin Abcam ab7291
Mouse
n/a
1:20,000
Rabbit IgG-Alexa
Molecular Probes A-11034
Goat
1:200
n/a
Fluor 488
Mouse IgG-Cy3
Molecular Probes A-10521
Goat
1:200
n/a
Rabbit IgG-HRP
Jackson
111-035-006
Goat
n/a
1:15,000
ImmunoResearch
Mouse IgG-HRP
Jackson
115-035-146
Goat
n/a
1:10,000
ImmunoResearch
A
not applicable (n/a)
Table S3 Student t-test for the Mean DAPI-Normalized H3K79me2 Total Signal Intensities as
Determined by Semi-Quantitative Imaging Microscopy.
Cell Cycle Stage
n
AMean ± Standard Deviation
p-value
BFold
Increase
Interphase
23
1.00 ± 0.02
n/a
n/a
Mitosis
C23
31.04 ± 1.63
<0.0001
31
A
Number of cells analysed (n)
B
Based on Student’s
t
-tests comparing the mean DAPI-normalized H3K79me2 total signal intensity of
interphase and mitotic cells. Not applicable (n/a)
C
limited to only those cells in prophase, prometaphase and metaphase as identified by cytological
B. J. Guppy and K. J. McManus 5 SI
Table S4 Student
t-test for the Mean DAPI-Normalized H3K79me2 Total Signal Intensities
Following Various Treatments as Measured by Semi-Quantitative Imaging Microscopy.
Condition n
AMean ± Standard Deviation
p-value
A48 Hours Post Silencing
Mitotic Cells + siGAPDH
23
100.00 ± 4.97
n/a
Mitotic Cells + siDOT1L
23
54.72 ± 3.78
<0.0001
2 Hours Post Treatments
Mitotic Cells + DMSO
23
100.00 ± 4.13
n/a
Mitotic Cells + SGC0946
23
24.36 ± 1.60
<0.0001
A
Number of cells analysed (n)
B
Based on Student’s
t
-tests comparing the mean DAPI-normalized H3K79me2 total signal intensity of
Table S5 Cell Cycle Analyses Following Protein Silencing or Drug Treatment.
Condition/Treatment G0/G1 S-phase G2/M
Non-treated
41.9% 35.9% 20.6%
siGAPDH
41.8% 35.9% 20.6%
siRNF20
36.3% 35.2% 26.5%
siDOT1L
39.9% 40.0% 18.8%
DMSO
35.6% 36.4% 26.3%
B. J. Guppy and K. J. McManus 7 SI
Table S6 Student
t-tests Comparing Mean Chromosome Numbers Following DOT1L Silencing
or Inhibition.
Condition n
AMean ± Standard Deviation p-value
BsiGAPDH
100
44.80 ± 0.07
n/a
siDOT1L
100
48.38 ± 1.38
0.0102
DMSO
100
44.97 ± 0.05
n/a
SGC0946
100
46.30 ± 0.49
0.0075
Table S7 The Loss of Mitotic H3K79me2 Levels is Associated with Increases in Aberrant
Mitotic Events
Total Mitotic Mean Frequency of Defects (%)
Condition Cells
Analyzed (
Standard Deviation)
Fold Increase
AsiGAPDH 315
5.570
0.8907
n/a
siDOT1L 337
9.696
2.163
1.74-fold
DMSO 306
3.742
1.007
n/a
SGC0946 318
9.303
1.918
2.49-fold
B. J. Guppy and K. J. McManus 9 SI
Figure S1 Validation of the RNF20 and H2Bub1 Antibodies.
Figure S2 Defining the Spatial Relationships of RNF20, H2Bub1, H3K4me2 and H3K79me2 within
Interphase Chromatin.
B. J. Guppy and K. J. McManus 11 SI
Figure S3 RNF20 is Spatially Relocalized in Mitotic hTERT Cells.
Figure S4 Flow Cytometric Analyses of Asynchronous and Mitotically-enriched Populations.
B. J. Guppy and K. J. McManus 13 SI
Figure S5 H2Bub1 Levels Decrease Dramatically During Mitosis in hTERT Cells.
Figure S6 Validation of the H3K4me2 and H3K79me2 Antibodies.
B. J. Guppy and K. J. McManus 15 SI
Figure S7 H3K4me2 Levels in hTERT Cells are Relatively Constant Throughout the Cell Cycle.
Figure S8 The Global Abundance of H3K79me2 Increases Dramatically during Mitosis in hTERT Cells.
B. J. Guppy and K. J. McManus 17 SI