Department of Civil Engineering, North Eastern Regional Institute of Science and Technology, Nirjuli, Itanagar, Arunachal Pradesh, India.
Effect of Multi-cell Cross-section on Thin LDSS
Hollow Stub Column under Pure Axial Loading
Rohan Dadasaheb Mane1, Konjengbam Darunkumar Singh2
Postgraduate Student, Indian Institute of Technology Guwahati, India1
Associate Professor, Indian Institute of Technology Guwahati, India2
Abstract: In this paper, finite element (FE) studies for LDSS (Lean Duplex Stainless Steel) square hollow, single wall, diagonal walls and double walls hollow stub columns (i.e. SHC, -HC, XHC, and +HC respectively) are presented using Abaqus, to gain an understanding of multi-cellular cross sectional effects on ultimate strength of column. The LDSS hollow columns having equal material cross-sectional areas with thickness varying from 1 mm to 10 mm were subjected to uniform axial compression. The length of the columns (~1800 mm) of about three times the outer width of SHC was considered for analyses to maintain stockiness of columns. Based on the analyses, it has been found that for all the hollow columns considered, a nearly linear variation of Pu with section thickness has been observed. The increase in Pu with 300 % increase in thickness (from 2.5 mm to 10 mm) is of order ~ 1040 %, 1080 %, 1037 % and 989 % for SHC, -HC, XHC and +HC respectively. In comparison with SHC, multi-cellular columns performed better in terms of Pu. It is found that the increase in Pu/Pu(SHC) is relatively lesser for t ≤ 2.5 mm compared to other
higher thicknesses; for t > 2.5 mm the effect of t on Pu/Pu(SHC) is not very apparent. A nearly linear increase (> ~ 100%) in Pu has been seen as the sections are
changed from SHC→-HC→XHC→ +HC.
Keywords: Buckling; Lean Duplex Stainless Steel; Finite Element Modelling, Multi-cell stub columns; Abaqus
I. INTRODUCTION
Carbon steel is very popular in construction industry due to its long experience of use, availability of applicable design rules and large variety of strength classes. But to suit the demands of numerous and diverse engineering
applications, improvements are being made to
conventional steel, leading to the production of stainless steel. Stainless steel has several advantages that include high corrosion resistance, high strength, smooth and uniform surface, aesthetic appearance, high ductility, impact resistance and ease of maintenance and construction. These benefits have prompted a moderately upsurge of using stainless steel in construction industry in the recent years. Use of austenitic steel grade (nickel content of 8% -11%) is common in construction industry. However with the recent rise in the nickel and molybdenum, the cost of production of stainless steels higher has gone up. A recently developed stainless steel type known as ‘Lean Duplex Stainless Steel’ (LDSS) [1-2], having a low (~1.5%) content of nickel offers a more
appropriate balance of properties for structural
Department of Civil Engineering, North Eastern Regional Institute of Science and Technology, Nirjuli, Itanagar, Arunachal Pradesh, India.
on the performances of different cross sections such as square, rectangle, circular and elliptical shapes, under axial compression [3-5], with no systematic reported literature being made on the effect of multi-cellular LDSS sections. Multi-cellular sections which are obtained by dividing the enclosed cross-sectional area of the tube into multiple cells, presents an encouraging option to improve the performance of axially loaded hollow columns. These types of multi-cellular cross sections are used in different fields (especially in automobile industry) as an excellent energy absorber when subjected to the impact loadings. Chen & Wierzbicki [6] carried out a study on relative merits of single cell, multi-cell thin wall columns and
foam-filled columns. Their study has shown that the gain in specific energy absorption (SEA) of the un-optimized double cell and the triple cell column is about 15% higher compared to that of single cell columns. Zhang et. al., [7] has given theoretical solution for the mean crushing force of multi-cell sections. Their comparative study on single and multi-cell square tubes has concluded that multi-cell tubes can improve the tube’s energy absorption by 100%. Song and Guo’s [10] studied on multi-cell and windowed column showed that under axial loading, both windowing method and multi-cell method can significantly increase tube’s mean crushing force, later one being more effective.
Fig. 1. (a) SHC, (b) -HC, (c) XHC, and (d) +HC
Fig. 2. Typical (a) geometry, (b) FE mesh and (c) boundary conditions for LDSS Square Hollow Column (SHC).
In this paper, in order to assess the applicability of multi-cell hollow LDSS columns for construction
Department of Civil Engineering, North Eastern Regional Institute of Science and Technology, Nirjuli, Itanagar, Arunachal Pradesh, India.
approach. The main objective of this study is to explore and compare the ultimate strength of LDSS Square Hollow Column (SHC) with multi-cell hollow column viz. Single Wall Hollow Column (-HC), Diagonal Wall Hollow Column (XHC) and Double Wall Hollow Column (+HC) under pure axial compression, but maintaining equal material cross-sectional areas.
II. FINITE ELEMENT MODELING
a. General
In this study, Finite Element Analyses (FEA) have been carried out to study the effect of multi-cellular cross section on the ultimate strength of LDSS hollow columns subjected to pure axial compression. The analyses were carried out using general purpose commercial software ABAQUS/ CAE v 6.9 EF1 [15]. The available experimental data of square hollow column testing was used for validation of FEA approach (to discuss more in Section 2.6). The details of FE modeling are discussed in the following sub-sections.
Table 1
Compressive flat material properties (Theofanous and Gardner [19])
Cross-section
E (MPa)
σ0.2
(MPa)
σ1.0
(MPa)
Compound R-O coefficients n n′. , .
80x80x4-SC2 197200 657 770 4.7 2.6
b. Material Modeling
According to EN 10088-4 [2], the minimum material properties of LDSS grade EN 1.4162 are 0.2% proof stress
(σ0.2) of 530 MPa and ultimate stress (σu) of 700-900 MP.
In present study, the material properties given by [19] (Table 1) were used in deriving the stress-strain curve of LDSS material through a material model suggested by Gardner and Ashraf [18], which is a modified version of original Ramberg-Osgood model [16]. Poisson’s ratio was taken as 0.3.
In the absence of necking phenomena in compression, Gardner and Ashraf [18] proposed a model (Eq. (1)) which
applies for stresses greater than σ0.2.
ϵ=(σ − σ . )
E .
+ ϵ . − ϵ . −
σ . − σ .
E.
× σ σ.
σ. σ. . , . ′
+ϵ . (1)
where єt0.2 and єt1.0 are total strains at σ0.2 and σ1.0,
respectively; and n’0.2,1.0 is the strain hardening exponent
(Table 1). Eq. (1) has been reported to give excellent agreement with measured stress–strain curves in both tension and compression.
c. Geometry and boundary conditions
The original square hollow column used has outer dimensions of 600 mm x 600 mm and length equal to three times the width of column (3x 600 mm = 1800 mm) [23-24], so that the column behaves as stub. The section thickness was varied from 1 mm to 10 mm with an interval of~ 2.5 mm, such that all the specimens fall under within Class 4 [27]. For each thickness, four cross section configurations were analysed viz. Square, Single Wall, Diagonal Wall and Double Wall Hollow Column (see Fig. 1). All the configurations were made to have the same cross sectional area (i.e. same material consumption) for a particular thickness, so that effect of the cellular configuration can be studied with respect to the plain square hollow column. The intermediate walls in -HC, XHC and +HC were of same thickness as that of the external walls. They were connected to the outer wall using ‘Tie’ constraint (surface based constraint using master-slave formulation) in Abaqus Interactions [15]. The fixed ended column approach utilized in published literature [19-21] is used in the present paper. One end of hollow column is considered to be fixed, while at the loaded end, only translation in the applied load direction (i.e. along the column length direction) was allowed. The desired boundary conditions were achieved by fixing Reference point – 1 (RPB) (coupled with bottom end of tube) and allowing translation in length direction at reference point – 2 (RPT) (coupled with top end of column). The applied load was increased proportionally in every sub-step of modified RIKS method [25-26].
d. Finite element mesh
Department of Civil Engineering, North Eastern Regional Institute of Science and Technology, Nirjuli, Itanagar, Arunachal Pradesh, India.
Fig. 3. Experimental stress-strain curve of LDSS material Grade EN 1.4162 (Theofanous and Gardner [19]).
The aspect ratio of the element is kept at ~ 1.0 in all the FE
models (Fig. 2). The number of S4R elements used in the analyses for various models ranges from ~ 1,700 to 4,500. Linear elastic eigen value buckling analysis was then used to check mesh convergence.
e. Local geometric imperfection
The local geometric properties proposed by Gardner [22] for stub columns were used in the FE modeling. The linear elastic eigen value buckling analysis gave eigen values for the FE models. This lowest eigen values were then used to perturb the geometry using the local imperfection
amplitude, w0 [22] given by Eq. (2)
(2)
where, σ0.2 is the 0.2% proof stress, t is thickness, and σcr
is the elastic critical buckling stress given by Eq. (3).
(3)
In Eq. (3), λ is eigen value obtained from linear elastic
buckling analyses results of FE modeling, E is Young's
modulus of elasticity, Δl is initial displacement value
provided at the movable end, and L is length of the column.
f. Verification of finite element model
LDSS square hollow stub column test results reported by Theofanous and Gardner [19] was considered as benchmark for the validation of the present FE modelling approach. The test column reported by Theofanous and
Gardner [19] was formed using cold-forming technique resulting in different properties between flat and corner portion of the column. But in the present FE study, same compressive flat material properties was used for both flat and corner portions of the column, to simplify the modelling procedure. Hence the strength enhancement in the corner regions by cold forming-process is neglected. The experimental stress-strain curve of LDSS material Grade EN 1.4162 using Gardner and Ashraf [18] model (as mentioned in Section 2.2) using material properties from Table 1 is shown in Fig. 3. This material model shown in
Fig. 4. Comparison of experimental (Theofanous and Gardner [19]) and FE modeling load-deformation curve .
Fig. 3 was converted into true stress (σtrue) and true plastic
strain (εpltrue) using Eqs. (4) and (5), for using as input
parameter to Abaqus [15].
(4)
(5)
where σnom and єnom are engineering stress and strain
respectively.
Comparison of the FE load-axial deformation plot for SHC shows good agreement with the experimental plot, (see Fig. 4). The location of ultimate load (Pu) and axial
deformation (δu) at ultimate load is marked in Fig. 4. It can
be seen from Fig. 4. That the present modeling approach is suitable to achieve good agreement with the experimental values for LDSS SHC. Hence, such aforementioned approach has been followed for all the subsequent analyses.
0 100 200 300 400 500 600 700 800 900 1000
0 1 2 3 4 5 6 7
L
o
ad
(
k
N
)
Axial displacement (mm)
Exp (80x80x4-SC2) - Theofanous and Gardner, 2009 FE -(80x80x4-SC2) - Flat Ultimate load (Pu)
Department of Civil Engineering, North Eastern Regional Institute of Science and Technology, Nirjuli, Itanagar, Arunachal Pradesh, India.
III. RESULTS AND DISCUSSION
a. Deformed shapes at ultimate load
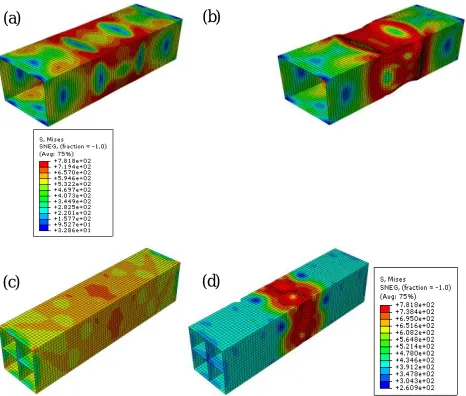
Von-Mises stress (superimposed on deformed shape) at ultimate load and post ultimate load for SHC and +HC section (t = 7.5 mm) are shown in Fig. 5. The appearance of local buckling at the mid-height can be seen for both SHC and +HC. The local buckling failure seen in Fig. 5(b) & (d) is the characteristic behavior of Class 4 [27]. However, in comparison with the SHC, +HC showed better distribution of stress at ultimate load, along with relatively confined zone of buckling at the post-ultimate load. Further due to the presence of the inner walls in +HC, the alternate inward-outward buckling can be seen on the same side, whereas such local buckling pattern can be seen between adjacent sides (see Figs. 5(b and d)).
b. Variation of ultimate load
Variation of P/Agfy (where P, Ag and fy are axial load,
gross cross sectional area and yield strength respectively) with axial displacement for SHC, -HC, XHC and +HC, for
Fig. 5. Von-Mises stress (superimposed on deformed shape) at (a) ultimate load and (b) post ultimate load for SHC and (c) and (d) +HC section (t = 7.5 mm)
t = 1 mm and t = 10 mm are shown in Fig. 6(a). As material cross sectional area for the SHC, -HC, XHC and
+HC, for a particular thickness is same, the term Agfy
remains constant. This term can be considered as global yielding load, as it represents that whole cross sectional area being effective and yielded. The ratio Pu/Agfy < 1.0
(where Pu is the ultimate load) indicates that the section is
slender and has undergone local buckling before reaching the global yield load. This type of failure occurs mainly for
‘Class 4’ type of cross section [27] which is characterized by buckling before the attainment of yield stress in one or more parts of the cross section. Pu/Agfy > 1.0 indicates
where yielding (there may be strain hardening after yielding) precedes buckling. This behavior of Pu/Agfy >
1.0 generally happens for cross sections that come under ‘Class 3’ [27]. It can be observed from Fig. 6(a) that the ultimate strength of the column increases as it goes from
SHC, -HC and XHC to +HC sections (i.e. Pu(SHC)< Pu(-HC)<
Pu(XHC)< Pu(+HC), where subscripts denote cross-sectional
configuration) . This can be related to the stiffening effect of internal walls on the external sides. The increase in the effective area of the flat faces due to the stiffening effect at the ends results into the increase in ultimate strength. The buckling resistance of the columns is increase either due of the reduction in flat width (e.g. -HC and +HC) or due to the
0 0.2 0.4 0.6 0.8 1 1.2 1.4
0 20 40 60 80 100
P
/A
g
fy
Axial Deformation (mm)
SHC (t =1 mm) -HC (t = 1 mm) XHC (t = 1 mm) +HC (t = 1 mm) SHC (t = 10 mm) -HC (t = 10 mm) XHC (t = 10 mm) +HC (t = 10 mm)
(a)
(a) (b)
Department of Civil Engineering, North Eastern Regional Institute of Science and Technology, Nirjuli, Itanagar, Arunachal Pradesh, India.
Fig. 6. (a) Variation of P/Agfy with axial displacement for
SHC and different section configurations for (t =1 mm
and 10 mm). (b) Variation of P/Agfy for +HC for different
thicknesses
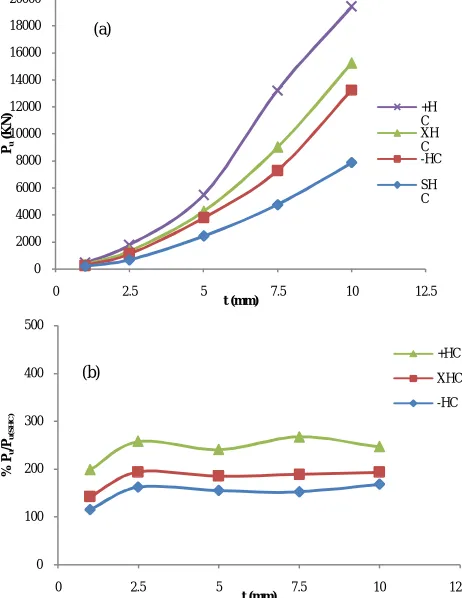
Fig. 7. (a)Variation of ultmate load (Pu)with section
thicknesses. (b) Variation of Pu/Pu(SHC) with section
thicknesses
enhanced rigidity of the corners (e.g. XHC). In Fig 6(a) the effect of strain hardening (indicated by extended plateau) in the pre-peak region is readily seen, particularly in the case of stocky +HC (t = 10 mm), and has resulted in delaying the buckling effect. Such behaviour is not present when the thickness becomes smaller (see Fig. 6(b)). This may be because the sides have become relatively slender (t
≤ 7.5 mm).
The variations of Pu with t are shown in Fig. 7(a) for all
the cross sections tested. The variation of Pu with t is
relatively slower at smaller values of t, which then becomes steeper as thickness increases i.e., the variation is
approaching a parabolic type. The increase in Pu with
300% increase in t (from 2.5 mm to 10 mm) is of order ~ 1040%, 1080%, 1037% and 989% for SHC, -HC, XHC and +HC respectively.
The variation of Pu/Pu(SHC) (indicating the effect of internal
walls)with the sectional thickness is shown in Fig. 7(b).
From Fig 7(b), it can be observed that the increase in Pu/Pu(SHC) is relatively lesser for t ≤ 2.5 mm compared to
other higher thicknesses; for t > 2.5 mm the effect of t on Pu/Pu(SHC) is not very apparent. The increase of Pu/Pu(SHC)
for –HC, XHC, +HC, for t = 1 mm, is 115%, 142% and 168% respectively. For thicknesses 2.5 mm to 10 mm, % Pu/Pu(SHC) increase for –HC, XHC, +HC is in the range
of152%-168%, 185%-194% and 240%-267% respectively.
In Fig. 8, the variation of Pu with sectional shapes is
Fig. 8. Variation of Pu (KN)with sectional shapes.
shown for various values of thicknesses. From Fig. 8 it can
be seen that there is nearly linear increase of Pu with
changing shapes i.e. Pu(SHC) < Pu(-HC) < Pu(XHC) < Pu(+HC). 0 0.2 0.4 0.6 0.8 1 1.2 1.4
0 10 20 30 40 50 60 70
P
/A
g
fy
Axial Deformation (mm)
t = 10 mm t = 7.5 mm t = 5 mm t = 2.5 mm
0 2000 4000 6000 8000 10000 12000 14000 16000 18000 20000
0 2.5 5 7.5 10 12.5
Pu (K N ) t (mm) +H C XH C -HC SH C 0 100 200 300 400 500
0 2.5 5 7.5 10 12.5
% Pu /Pu (S H C ) t (mm) +HC XHC -HC 0 2000 4000 6000 8000 10000 12000 14000 16000 18000 20000
SHC -HC XHC +HC
Pu
(K
N
)
t = 10 mm t = 7.5 mm t = 5 mm t = 2.5 mm t = 1 mm (b)
Department of Civil Engineering, North Eastern Regional Institute of Science and Technology, Nirjuli, Itanagar, Arunachal Pradesh, India.
However, the rate of increase is of the order ~ 146%, 167%, 141%, 157%, 99% for t = 10 mm, 7.5 mm, 5 mm, 2.5 mm, 1mm, respectively for change of shapes from
SHC → -HC, → XHC → +HC respectively. Thus it is
seen that it is possible to enhance the load carrying capacity of hollow columns by providing multi-cellular sections, in the scenario of same material consumption, and this opens up an avenue for economising and making lighter structural members, under pure axial compression condition.
IV. CONCLUSION
Finite element analysis of LDSS (Lean Duplex Stainless Steel) hollow stub column with single wall, diagonal wall and double wall sections (i.e. -HC, XHC and +HC respectively) for various thicknesses are presented using Abaqus (2010), to understand cross-sectional shape effects of the internal cells on ultimate load. Based on the study following conclusion are identified:
1) For all the hollow columns considered, a nearly
parabolic type variation of Pu with section thickness has
been observed. The increase in Pu with 300% increase
in t (from 2.5 mm to 10 mm) is of order ~ 1040%, 1080%, 1037% and 989% for SHC, -HC, XHC and +HC respectively.
2) In comparison with SHC, multi-cellular columns
performed better in terms of Pu. It is found that the
increase in Pu/Pu(SHC) is relatively lesser for t ≤ 2.5 mm
compared to other higher thicknesses; for t > 2.5 mm the effect of t on Pu/Pu(SHC) is not very apparent. The
increase in Pu/Pu(SHC) for –HC, XHC, +HC, for t = 1
mm, is 115%, 142% and 168% respectively. For
thicknesses of 2.5 mm to 10 mm, % Pu/Pu(SHC) increase
for –HC, XHC, +HC is in the range of 152%-168%, 185%-194% and 240%-267%.
3) A nearly linear increase in Pu has been seen as the
sections are changed from SHC→-HC→XHC→ +HC.
For changes in section from square to +HC, the
increase in Pu are ~99%, 157%, 141 %, 167% and
146% for 1 mm, 2.5 mm, 5 mm, 7.5 mm, 10 mm, respectively.
REFERENCES
[1] Baddoo NR. Stainless steel in construction: a review of research, applications, challenges and opportunities. Journal of Constructional Steel Research, 2008;64:1199–206
[2] EN 10088-4. Stainless steels part 4: Technical delivery conditions for sheet/plate and strip of corrosion resisting steels for general purposes. CEN. 2009
[3] Dabaon MA, El-Boghdadi MH, Hassanein MF. A comparative experimental study between stiffened and unstiffened stainless steel hollow tubular stub columns. Thin-Walled Structures 2009;47:73– 81
[4] Lui Y, Young B. Buckling of stainless steel square hollow section compression members. Journal of Constructional Steel Research 2003;59:165–77
[5] Theofanous M, Chan TM, Gardner L. Structural response of stainless steel oval hollow section compression members. Engineering Structures 2009; 31: 922–34.
[6] Chen W, Wierzbicki T. Relative merits of single-cell, multi-cell and foam-filled thin-walled structures in energy absorption. Thin-Walled Structures 2001; 39:287–306.
[7] Zhang X, Cheng G, Zhang H. Theoretical prediction and numerical simulation of multi-cell square thin-walled structures. Thin-Walled Structures 2006; 44:1185–1191.
[8] Güden M, Kavi H. Quasi-static axial compression behavior of constraint hexagonal and square-packed empty and aluminum foam-filled aluminum multi-tubes. Thin-Walled Structures 2006; 44:739–750.
[9] Hou S, Li Q, Long S, Yang X, Li W. Multiobjective optimization of multi-cell sections for the crashworthiness design. International Journal of Impact Engineering 2008; 35:1355–1367.
[10] Song J, Guo F. A comparative study on the windowed and multi-cell square tubes under axial and oblique loading. Thin-Walled Structures 2013; 66:9–14.
[11] Chen W, Nardini D. Experimental study of crush behaviour of sheet aluminium foam-filled sections. International Journal of Crashworthiness 2000:447-468.
[12] Najafi A, Rais-Rohani M. Mechanics of axial plastic collapse in multi-cell, multi-corner crush tubes. Thin-Walled Structures 2011; 49:1–12
[13] Hong W, Fan H, Xia Z, Jin F, Zhou Q, Fang D. Axial crushing behaviors of multi-cell tubes with triangular lattices. International Journal of Impact Engineering 2014; 63:106-117.
[14] Zhang X, Cheng G. A comparative study of energy absorption characteristics of foam-filled and multi-cell square columns. International Journal of Impact Engineering 2007; 34:1739–1752
[15] Abaqus. Abaqus/Standard user’s manual volumes I–III and ABAQUS CAE manual. Version 6.9-EF1, Dassault Systemes Corp., Providence, USA. 2010
[16] Ramberg W., Osgood W.R. Description of stress–strain curves by three parameters. Technical Note No 902, Washington, DC: National advisory committee for aeronautics 1943
[17] Rasmussen KJR. Full-range stress–strain curves for stainless steel alloys. Journal of Constructional Steel Research 2003;59:47–61.
Department of Civil Engineering, North Eastern Regional Institute of Science and Technology, Nirjuli, Itanagar, Arunachal Pradesh, India.
[19] Theofanous M, Gardner L. Testing and numerical modelling of lean duplex stainless steel hollow section columns. Engineering Structures 2009; 31: 3047–58.
[20] Hassanein MF. Numerical modelling of concrete-filled lean duplex slender stainless steel tubular stub columns. Journal of Constructional Steel Research 2010; 66:1057–68.
[21] Ashraf M, Gardner L, Nethercot DA. Finite element modeling of structural stainless steel cross-sections. Thin Walled Structures 2006;44:1048–62
[22] Gardner L. A new approach to structural stainless steel design. PhD thesis. Structures Section, Department of Civil and Environmental Engineering, Imperial College London, UK; 2002.
[23] Patton ML, Singh KD. Numerical modeling of lean duplex stainless steel hollow columns of square, L-, T-, and +-shaped cross sections under pure axial compression. Thin-Walled Structures 2012; 53:1–8
[24] Umbarkar KR, Patton ML, Singh KD. Effect of single circular perforation in lean duplex stainless steel (LDSS) hollow circular stub columns under pure axial compression. Thin-Walled Structures 2013; 68:18–25
[25] Riks E. The application of Newton’s method to the problem of elastic stability. Journal of Applied mechanics 1972; 39:1060–5.
[26] Riks E. An incremental approach to the solution of snapping problems. International Journal of Solids and Structures 1979; 15:529–51.

![Fig. 3. Experimental stress-strain curve of LDSS material Grade EN 1.4162 (Theofanous and Gardner [19])](https://thumb-us.123doks.com/thumbv2/123dok_us/1537296.1188555/4.612.66.283.186.336/experimental-stress-strain-curve-material-grade-theofanous-gardner.webp)