Simulation of Disparity Map Estimation for
Stereo Vision in MATLAB
Rohini Chincholkar
P.G. Student, Department of Electronics, MIT College, Kothrude, Maharashtra, India
ABSTRACT: It is evident that the accuracy of stereo matching algorithms has continued to increase, based on quantitative evaluations of the resulting disparity maps. Today a number of stereo matching algorithms are available to compute disparity maps. These algorithms are mainly classified as Local and Global algorithms. This paper focuses on designing a system for the estimation of disparity map using a simulation tool with the help of Local stereo matching algorithm. Here the designed system first extract corner feature from input side stereo image pair, then a fundamental matrix is calculated to get an epi polar geometry of a stereo image pair. Using epipoalar geometry, SSD and sub pixel accuracy distance between best similar points is calculated. Finally using this distances Disparity map is estimated. The system gives good disparity results within lesser time.
KEYWORDS: Stereo Vision, Stereo matching algorithms, Disparity, Epipolar Geometry, SSD, Sub pixel accuracy.
I. INTRODUCTION
Stereo Image matching is a key component in almost every image analysis process as it gives high resolution of images. This matching has received a great attention because of its crucial applications in digital photogrammetry, navigation, automatic surveillance, robot vision, satellite imagery.Similarity is the guiding principle for solving the correspondence problem in stereo matching. Corresponding features or areas should be similar in the two images. For a particular feature in one image, there are usually several matching candidates in the other image. It is usually necessary to use additional information or constraints to assist in obtaining the correct match. Some of the commonly used constraints are:
Epipolar constraint: Under this constraint, the Matching points must lie on the corresponding Epipolar lines of the two images.
Uniqueness constraint: Matching should be Unique between the two images.
Continuity constraint: The cohesiveness of matters suggests that the disparity of the matches should vary smoothly almost everywhere over the image. This constraint fails at discontinuities of depth, for depth discontinuities cause an abrupt change in disparity.
In Local (window-based) algorithms, the disparity computation at a given point depends only on intensity values within a finite window; usually make implicit smoothness assumptions by aggregating support. Some of these algorithms can cleanly be broken down into steps 1, 2,3. For example, the traditional sum-of-squared-differences (SSD) algorithm can be used here as follows:
1. The matching cost is the squared difference of intensity values at a given disparity;
2. Aggregation is done by summing matching cost over square windows with constant disparity; 3.Disparities are computed by selecting the minimal (winning) aggregated value at each pixel.
Take Stereo image pair from workspace
Resize Stereo Image Pair
Convert Stereo Image into
Intensity Image
Extract & Compute a
Cornerness Map
Compute a Fundamental
Matrix
Process Epipolar Geometry
Estimate Disparity Map
II. RELATEDWORK
This paper describe a system which take stereo image pair as input side and process it to estimate a disparity map as output. Here simulation tool is used to design and analyze the system. In Simulink, it is very straightforward to represent and then simulate a mathematical model representing a physical system. Models are represented graphically in Simulink as block diagrams. A wide array of blocks is available to the user in provided libraries for representing various phenomena and models in a range of formats. One of the primary advantages of employing Simulink (and simulation in general) for the analysis of dynamic systems is that it allows us to quickly analyze the response of complicated systems that may be prohibitively difficult to analyze analytically. Simulink is able to numerically approximate the solutions to mathematical models that we are unable to, or don't wish to, solve "by hand."
The flow of the system is explained as follows.
Figure1
.
System FlowchartIII.SYSTEMBLOCKS
1. System input :
Here the first part of the system is designed to take the stereo image pair as input. The input pair is then resized to reduce the search area; the resize factor should lie between 0 to 1. Here in this system resize factor is 0.75. The stereo pair can be a real or synthetic image.
The resized image pair then converted into intensity images using a RGB to intensity conversion block. As we are using intensity images, we get dense disparity map as an output. Disparity can be dense or sparse type. In sparse type, disparity calculated at each feature point.
Figure 2 shows, Source block which consists of resizing block and RGB to Intensity conversion block, the output of this source block is resized color and intensity images.
2.Feature Extraction :
The demo uses the Corner Detection block to find image features. If you would like to feed your own data into the demo you may wish to explore the various corner detection methods and other settings of the Corner Detection block. Here our system extract corner features from input images and output of this extraction is cornerness map which gives approximate corner positions in the input image. Corner Detection block is comprised with two blocks, first block is corner metric where method, maximum no. of corners, neighborhood size has to set. Here for corner metric block we set Local intensity comparison method.
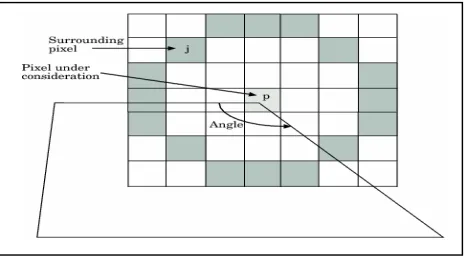
3.Local Intensity Comparison
This method determines that a pixel is a possible corner if it has either, N contiguous valid bright surrounding pixels, or N
contiguous dark surrounding pixels. Suppose that p is the pixel under consideration and j is one of the pixels surrounding p. The locations of the other surrounding pixels are denoted by the shaded areas in the following Figure 3.
Figure Figure3. Local Intensity Comparison
Local maxima block which outputs 2 by N matrix which shows Location and N i.e. no. of corners detected.
Figure 4 Corner Detection
Figure 4 shows a Corner Detector which consists of a corner metric and a local maxima block.
IV.EXPERIMENTAL RESULTS
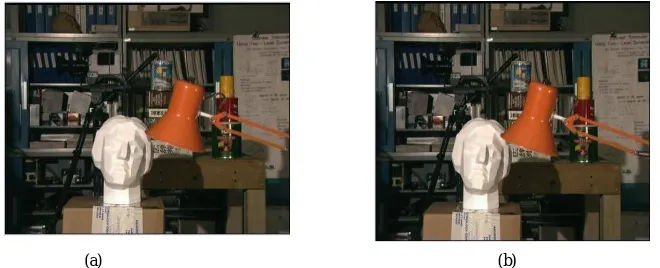
Here Tsukoba stereo image pair is used which taken from Middlebury image dataset. Here one can use Venus, teddy, cones stereo image pair.
Here image (a) is left image and (b) is right image. Image (c) is left intensity image whereas image (d) is right intensity image. Image (e) shows left image cornerness map and image (f) shows right cornerness map.
(c) (d) (e) (f)
Here Image (g) indicates disparity map of our input stereo image pair.
(g)
V.CONCLUSION
The proposed system is used to estimate a disparity map for stereo image pair. The key step during this estimation is to detect corners, for detecting corner features we are using local Intensity Comparison and get a corner ness map which indicate approximate locations of corners, maximum 100 corners it can detect within a few seconds. So it is easy to calculate fundamental matrix and epi polar geometry as corner features are already detected. This system gives better results for already rectified stereo images.
REFERENCES
[1] Kim, Chang, Park, Soon-Yong, Yong; “Fast Stereo matching of feature links”; International conference on 3D Imaging, Modeling, Processing, Visualization and Transmission (3DIMPVT),16-19 May 2011. Venue Hangzhou, China.
[2] Sang Hwa Lee; “Real Time Disparity Estimation Algorithm for stereo camera systems”; Consumer Electronics, IEEE Transactions on, August 2011.
[3] Kaaniche, Mounir;”DenseDisparity maprepresentations for stereo image coding”,ImageProcessing(ICIP),IEEE International Conference on,2009, Ravenna,Italy
[4] XiaoyanXu; Ran Liu; Lin Yi; "A New Methodfor Epi-polar Rectification" ; IEEE Conference onIntelligent Computing and Intelligent Systems ,TBD Shanghai , China , 20 Nov - 22 Nov 2009
[5] Marcelo Bertalmio, Luminita Vese, Guillermo Sapiro, Stanley Osher, “Simultaneous Structure and Texture Image Inpainting”, IEEE Transactions On Image Processing, vol. 12, No. 8, 2003.
[7] Eftychios A. Pnevmatikakis, Petros Maragos “An Inpainting System For Automatic Image Structure-Texture Restoration With Text Removal”, IEEE trans. 978-1-4244-1764, 2008
[8] S.Bhuvaneswari, T.S.Subashini, “Automatic Detection and Inpainting of Text Images”, International Journal of Computer Applications (0975 – 8887) Volume 61– No.7, 2013
[9] Aria Pezeshk and Richard L. Tutwiler, “Automatic Feature Extraction and Text Recognition from Scanned Topographic Maps”, IEEE Transactions on geosciences and remote sensing, VOL. 49, NO. 12, 2011
[10] Xiaoqing Liu and Jagath Samarabandu, “Multiscale Edge-Based Text Extraction From Complex Images”, IEEE Trans., 1424403677, 2006 [11] Nobuo Ezaki, Marius Bulacu Lambert , Schomaker , “Text Detection from Natural Scene Images: Towards a System for Visually Impaired
Persons” , Proc. of 17th Int. Conf. on Pattern Recognition (ICPR), IEEE Computer Society, pp. 683-686, vol. II, 2004
[12] Mr. Rajesh H. Davda1, Mr. Noor Mohammed, “ Text Detection, Removal and Region Filling Using Image Inpainting”, International Journal of Futuristic Science Engineering and Technology, vol. 1 Issue 2, ISSN 2320 – 4486, 2013
[13] Uday Modha, Preeti Dave, “ Image Inpainting-Automatic Detection and Removal of Text From Images”, International Journal of Engineering Research and Applications (IJERA), ISSN: 2248-9622 Vol. 2, Issue 2, 2012