University of Windsor University of Windsor
Scholarship at UWindsor
Scholarship at UWindsor
Electronic Theses and Dissertations Theses, Dissertations, and Major Papers
2008
Numerical model development of a heavy mining vehicle
Numerical model development of a heavy mining vehicle
multi-piece wheel assembly for structural analysis
piece wheel assembly for structural analysis
Vivek Vijayan University of Windsor
Follow this and additional works at: https://scholar.uwindsor.ca/etd
Recommended Citation Recommended Citation
Vijayan, Vivek, "Numerical model development of a heavy mining vehicle multi-piece wheel assembly for structural analysis" (2008). Electronic Theses and Dissertations. 8053.
https://scholar.uwindsor.ca/etd/8053
Numerical model development of a heavy mining
vehicle multi-piece wheel assembly for structural
analysis
by
Vivek Vijayan
A Thesis
Submitted to the Faculty of Graduate Studies
through Mechanical, Automotive, and Materials Engineering
in Partial Fulfillment of the Requirements for
the Degree of Master of Applied Science at the
University of Windsor
Windsor, Ontario, Canada
2008
1*1
Library and Archives CanadaPublished Heritage Branch
395 Wellington Street OttawaONK1A0N4 Canada
Bibliotheque et Archives Canada
Direction du
Patrimoine de I'edition
395, rue Wellington OttawaONK1A0N4 Canada
Your file Votre reference ISBN: 978-0-494-82080-3 Our file Notre reference ISBN: 978-0-494-82080-3
NOTICE:
The author has granted a
non-exclusive license allowing Library and Archives Canada to reproduce, publish, archive, preserve, conserve, communicate to the public by
telecommunication or on the Internet, loan, distribute and sell theses
worldwide, for commercial or non-commercial purposes, in microform, paper, electronic and/or any other formats.
AVIS:
L'auteur a accorde une licence non exclusive permettant a la Bibliotheque et Archives Canada de reproduire, publier, archiver, sauvegarder, conserver, transmettre au public par telecommunication ou par I'lnternet, preter, distribuer et vendre des theses partout dans le monde, a des fins commerciales ou autres, sur support microforme, papier, electronique et/ou autres formats.
The author retains copyright ownership and moral rights in this thesis. Neither the thesis nor substantial extracts from it may be printed or otherwise reproduced without the author's permission.
L'auteur conserve la propriete du droit d'auteur et des droits moraux qui protege cette these. Ni la these ni des extraits substantiels de celle-ci ne doivent etre imprimes ou autrement
reproduits sans son autorisation.
In compliance with the Canadian Privacy Act some supporting forms may have been removed from this thesis.
Conformement a la loi canadienne sur la protection de la vie privee, quelques formulaires secondaires ont ete enleves de cette these.
While these forms may be included in the document page count, their removal does not represent any loss of content from the thesis.
Bien que ces formulaires aient inclus dans la pagination, il n'y aura aucun contenu manquant.
AUTHOR'S DECLARATION OF ORIGINALITY
I hereby certify that I am the sole author of this thesis and that no part of this thesis has been published or submitted for publication.
I certify that, to the best of my knowledge, my thesis does not infringe upon
anyone's copyright nor violate any proprietary rights and that any ideas, techniques,
quotations, or any other material from the work of other people included in my thesis, published or otherwise, are fully acknowledged in accordance with the standard
referencing practices. Furthermore, to the extent that I have included copyrighted material that surpasses the bounds of fair dealing within the meaning of the Canada
Copyright Act, I certify that I have obtained a written permission from the copyright
owner(s) to include such material(s) in my thesis and have included copies of such copyright clearances to my appendix.
I declare that this is a true copy of my thesis, including any final revisions, as approved by my thesis committee and the Graduate Studies office, and that this thesis has
ABSTRACT
Over the past few decades, a significant number of incidents and fatalities have
been associated with mining vehicle wheels. Correspondingly, a literature review was completed dealing with various topics associated with the mining wheels with specific
attention to the incidents arising as a result of servicing multi-piece wheels. A detailed
analysis of the obtained data indicated that three piece mining vehicle wheels were found to be most commonly involved in such incidents.
To assess the mechanical performance of three piece mining wheels, experimental
testing was completed on such a wheel. Additionally, a numerical model of the wheel assembly used in the experimental testing was developed and simulated under similar
loading conditions as in the experimental work. Predictions of the finite element model
were in good agreement to the experimental findings with percentage errors typically in the range of 10% to 20%.
Numerical simulation of the SAE J1992 wheel cornering fatigue testing condition was completed on the numerical model of the wheel. The predictions from simulation
were used to assess fatigue factors of safety utilizing the modified Goodman theory (von
Mises and Sines approaches), simplified damage mechanics and critical plane approaches considering multi-axial loading. This predicts an infinite life for the wheel, whereas in
practical applications, it is observed that the wheels do not usually have an infinite life as predicted. This contradiction in the numerical prediction is attributed to the wear and
degradation of the mining wheel as a result of environmental effects and localized
ACKNOWLEDGEMENTS
First of all, I would like to thank my academic supervisor, Dr. William Altenhof
for his time, technical support and guidance all through the research. I would also like to
thank Dr. Nader Zamani and Dr. Sreekantha Das for the knowledge they shared with me throughout my degree.
I am also grateful to Mr. Richard Banting from MASHA, who has given me insights into the project, and Mr. Patrick Skeldoch from J & M tires who has provided me
with the three piece mining wheel for experimentation. I would also like to thank
North Shore Industrial for providing me with CAD data of the wheel.
With regards to experimentation, I would like to acknowledge the support of Mr. Andy Jenner, Mr. Lucian Pop, Mr. Patrick Seguin and Mr. Neil Turton.
TABLE OF CONTENTS
AUTHOR'S DECLARATION OF ORIGINALITY iii
ABSTRACT iv
ACKNOWLEDGEMENTS v
LIST OF TABLES x
LIST OF FIGURES xi
NOMENCLATURE xiii
1. INTRODUCTION 1
1.1. Mining industry in Canada 1 1.1.1. Benefits of the mining industry 1
1.1.2. Revenue to the governments 2
1.1.3. Problems faced by the industry 3
2. LITERATURE REVIEW 6
2.1. Difference between awheel and a rim 6
2.2. Difference between a typical road wheel and a mining wheel 7
2.2.1. Size of the tire 7 2.2.2. Wheel material 8 2.2.3. Application 8
2.2.4. Type of wheel 8
2.2.5. Difference in the procedure for fitting tires on wheels 11 2.3. Rules and regulations from health and safety organizations 11 2.4. Incidents from service and maintenance of wheels in mining industry 14
2.5. Fatigue in metals 17 2.6. Theories of fatigue failure under multi-axial stress states 18
2.6.1. Modified Goodman approach 18 2.6.2. Simplified Lemaitre's approach 21
2.7. Wheel cornering fatigue test 24
2.8. Past numerical investigations on fatigue life assessment of wheels 26
3. RESEARCH OBJECTIVES 27
4. EXPERIMENTAL INVESTIGATIONS 29
4.1. Manufacture of auxiliary fixtures 29
4.1.1. Loading shaft 29
4.1.2. Adapter plate 30 4.1.3. Wheel supporting fixtures 31
4.2. Configuration of the data acquisition system 32
4.3. Strain gauge application 32 4.4. Setup of the ARAMIS system 33
4.5. Setup of the experimental test 35
4.6. Experimental results 36 4.6.1. Results from the data acquisition system 36
4.6.2. Discussions 39 4.6.3. Results from the ARAMIS system 41
4.6.4. Discussions 44
5. FINITE ELEMENT MODELING OF THE EXPERIMENTAL TEST 45
5.1. Numerical model development of the three piece wheel 45
5.1.1. Discretization of the wheel model 45
5.1.2. Material models 48 5.1.3. Contact definition 48 5.1.4. Application of boundary conditions 48
5.2. Simulation procedure 49 5.3. Results of the simulations 49
6. VALIDATION OF THE FINITE ELEMENT MODEL 54
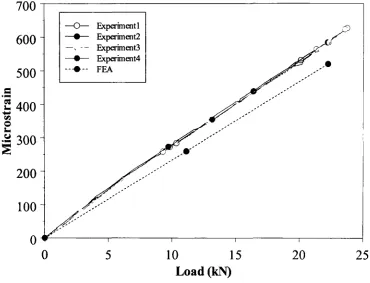
6.1. Comparison of numerical predictions with the experimental results 54
6.2. Discussions of strain versus load profiles from experiments and finite
elements 55
6.2.1. Strain gauge location 2L1 on the shaft 56 6.2.2. Strain gauge location 2L2 on the shaft 56
6.2.3. Strain gauge location 1L1 on the mounting ring 57
6.2.4. Strain gauge location 1L2 on the mounting ring 58
6.2.5. Strain gauge location 1L3 on the mounting ring 59
6.2.6. Strain gauge location 1L4 on the flange 60 6.2.7. Strain gauge location H5 on the flange 61
6.2.8. Strain gauge location H6 on the flange 62
6.2.9. Strain gauge location H7 on the wheel base 63 6.2.10. Strain gauge location H8 on the wheel base 64
7. FINITE ELEMENT SIMULATION OF THE WHEEL CORNERING
FATIGUE TEST 66
7.1. Finite element model development for fatigue simulation 66
7.1.1. Contact definition 67
7.1.2. Application of boundary conditions 68
7.2. Simulation procedure 68
8. RESULTS AND DISCUSSIONS OF WHEEL CORNERING FATIGUE
TEST 71
8.1. Analysis of the results of wheel cornering fatigue test 71 8.1.1. Development of fatigue analysis software 71 8.1.2. Results from fatigue analysis software 72
8.1.3. Discussions 74
REFERENCES 78
APPENDIX A 86
APPENDIX B 89
APPENDIX C '. 93
APPENDIX D 95
LIST OF TABLES
Table 4.1 Average strain results from the four experiments during peak load
application 39
Table 4.2 Strains from the ARAMIS system 44
Table 5.1 Aspect ratios of elements in the model 46
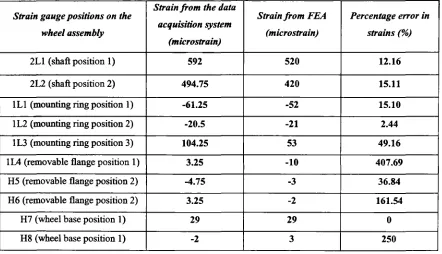
Table 6.1 Comparison of average strain values from the four experiments and strain
predictions of FEA at the peak load 54
Table 8.1 Finite elements with lowest four fatigue factors of safety predicted by
each approach 73 Table 8.2 Comparison of fatigue factors of safety predicted by different approaches
LIST OF FIGURES
Figure 1.1 Contribution ofthe mining industry to Canada's GDP 2
Figure 1.2 Revenue to the governments from the mining industry 3
Figure 1.3 Fatalities in mining, quarrying and related industries 4
Figure 2.1 Difference between a wheel and a rim 7
Figure 2.2 A typical single piece road wheel 9
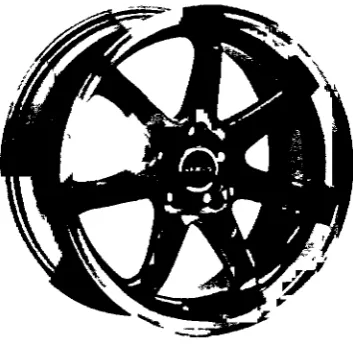
Figure 2.3 A three piece mining wheel 9
Figure 2.4 Single piece wheel 10
Figure 2.5 Multi-piece wheel 10
Figure 2.6 Incidents categorized based on rim type 16
Figure 2.7 Goodman, Gerber parabola, and Soderberg lines plotted on am - aa
axes for fluctuating stress fatigue failure criteria 19 Figure 2.8 Wheel cornering fatigue test based on the SAE J1992 25
Figure 4.1(a) Experimental setup illustrating the shaft, the fixtures and the point of
load application 30
Figure 4.1(b) Experimental setup illustrating the adapter plate 31 Figure 4.2 Positions of strain gauges on the testing apparatus 33 Figure 4.3 Location of strain observation by the ARAMIS system 35
Figure 4.4(a) Strain versus load profiles for all ten strain gauge positions from the
second experiment 37
Figure 4.4(b) Strain versus load profiles for all strain gauge positions
(wheel assembly) from the second experiment 38
Figure 4.5 Output from the ARAMIS system illustrating the method of strain
measurement 41 Figure 4.6(a) Strains versus length ofthe horizontal section from the second
experiment 43
Figure 4.6(b) Strains versus length ofthe vertical section from the second
Figure 5.1 Discretized wheel model 47
Figure 5.2(a) Strain versus load profiles from numerical predictions on the entire test
apparatus 50
Figure 5.2(b) Strain versus load profiles from numerical predictions on the wheel
assembly 51
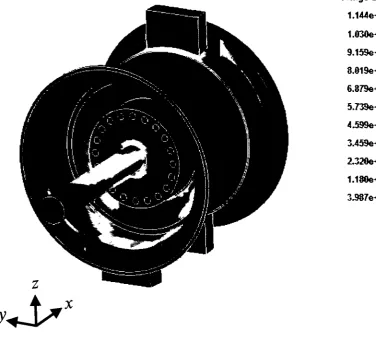
Figure 5.3 An effective strain distribution on the testing apparatus at maximum
load 52
Figure 6.1 Strain versus load profile for shaft position 1 (2L1) 55 Figure 6.2 Strain versus load profile for shaft position 2 (2L2) 56
Figure 6.3 Strain versus load profile for mounting ring position 1 (1L1) 57
Figure 6.4 Strain versus load profile for mounting ring position 2 (1L2) 58
Figure 6.5 Strain versus load profile for mounting ring position 3 (1L3) 59
Figure 6.6 Strain versus load profile for flange position 1 (1L4) 60 Figure 6.7 Strain versus load profile for flange position 2 (H5) 61
Figure 6.8 Strain versus load profile for flange position 3 (H6) 62
Figure 6.9 Strain versus load profile for wheel base position 1 (H7) 63 Figure 6.10 Strain versus load profile for wheel base position 2 (H8) 64
Figure 7.1 Finite element model for fatigue analysis 67
Figure 7.2 P as an equivalent of Py and Pz 69
Figure 8.1 1/20* section of the wheel with 5048 elements considered for fatigue
analysis 71 Figure 8.2 Elements with lowest four fatigue factors of safety predicted by each
NOMENCLATURE
d wheel inset or outset
E Young's modulus
/ length of moment arm
L test load
LR load rating
n factor of safety
ncp fatigue factor based on critical plane approach
nDM fatigue factor based on damage mechanics approach
n$ fatigue factor based on Sines approach
HVM fatigue factor based on von Mises approach
P rotating bending moment
PY bending load in Y direction
Pz bending load in Z direction
rs largest static loaded radius
i?v tri-axiality ratio
S accelerated test factor
Se modified fatigue strength of the material
Sut ultimate tensile strength of the material
t simulation time
tAjB fatigue strength in torsion (depending on crack case A or B)
e effective strain
ex maximum principal strain
s2 2nd principal strain £3 minimum principal strain
£EXP strain value from individual experiments at maximum loading
^ P mean value of strain from all four experiments at maximum loading
sFEA strain value from numerical predictions at maximum loading
v Poisson's ratio
p density
aa alternating stress component calculated by von Mises and Sines methods
(Teg effective stress calculated by von Mises approach
(feffimux maximum effective stress by simplified damage mechanics approach
an hydrostatic stress
o^max maximum normal stress in the maximum shear stress amplitude plane
os,m mean stress component calculated by Sines method
OvM,m mean stress component calculated by von Mises method
Oxx normal stress in X direction
Oyy normal stress in Y direction
a^ normal stress in Z direction
Oxx,a alternating normal stress in X direction
0yy,a alternating normal stress in Y direction
azz,a alternating normal stress in Z direction
Oxx,m mean normal stress in X direction
OyyM mean normal stress in Y direction
Gzz,m mean normal stress in Z direction
Gxx,max maximum value of stress-time waveform on normal stress in X direction
OxxMin m i n i m u m value of stress-time waveform o n normal stress in X direction
XA shear stress amplitude (crack case A )
tij shear stress in j direction o n i face
%a alternating shear stress in y direction on x face
tyz^a alternating shear stress in z direction on y face
izx,a alternating shear stress in x direction on z face
Tyy^m mean shear stress in y direction on x face
iyz,m mean shear stress in z direction on y face
*zx,m m e a n shear stress in x direction on z face
1. INTRODUCTION
1.1. Mining industry in Canada
The presence of an established mining industry indicates the availability of plentiful natural resources in a country and hence a significant impact on the economic
growth. In the last century, the mining industry has changed the complete phase of the world in a sense that, most of the technology being used today would not have been
possible without mining facilities. With the availability of vast natural resources and the
existence of a well developed mining industry, Canada remains one of the world's leading mining countries. Canada was the top most destination for global exploration
spending in 2006, receiving 19% of world spending followed by Australia at 11% and the United States at 8%. In Canada, most of the mining activities occur in the northern and
remote areas of the country. Canada ranks first in the world in potash and uranium
production; second in nickel and cobalt; third in titanium concentrate, aluminum, magnesium, gypsum and platinum-group metals; fourth in chrysotile and cadmium; and
fifth in zinc and molybdenum [1].
1.1.1. Benefits of the mining industry
Canada's mining industry plays a key role in the foundation of the country's economy by exporting 80% of its products accounting for 17% of annual Canadian exports. For example, in the year 1997, the minerals and metals industry contributed $26.2 billion to the Canadian economy which equalled 3.8% of the national gross
domestic product (GDP). Figure 1.1 illustrates the contribution of the mining industry to the Canadian GDP (in million dollars) from the years 2000 to 2006. Additionally, the industry provides employment opportunities to a significant number of people in the northern territories of Canada with relatively high wages compared to other industries. In the year 1997 alone, the mining and mineral processing industries employed 368,000
the mining and minerals industry, the total being significantly higher than the number of research and development employees in the agri-food, oil and gas, electrical equipments,
and automotive sector and almost close to the aerospace and pharmaceutical sectors. Products of the industry are utilized in building highways, electrical and communication
networks, housing, automobiles, consumer electronics, various other products and
infrastructure essential for modern life [1].
2000 2001 2002 2003 2004 2005 2006
Years
Figure 1.1. Contribution of the mining industry to Canada's GDP [1].
1.1.2. Revenue to the governments
The provincial and federal governments of Canada receive revenues from the mining industry in the form of royalties, mining taxes, corporate and personal income taxes. The total revenue including royalties and taxes generated by the mining industry
6000
Figure 1.2. Revenue to the governments from the mining industry [3].
1.1.3. Problems faced by the industry
Although, there are numerous benefits received by a country from its mining industry, the fact remains that the workers are subjected to serious negative effects.
Work associated in the mining industry poses serious occupational health hazards. First and foremost mining industry causes mental stress in people due to long hours of work, the nature of the work and finally, the nature of employee shift patterns. These irregular shift patterns lead to extreme fatigue in workers due to lack of sleep. Secondly, the repetitive nature of the job, high concentration demands at work and the after effects of
job-related physical disabilities lead to mental depression. This high state of mental stress and depression leads to significant behavioural changes among the aboriginal workers of the northern communities of Canada. These behavioural changes can be attributed to high dosage of alcohol and nicotine, addiction to other harmful drugs (drug
any given year. In spite of the several improvements in the workplace safety that have occurred through technological innovations, safe work practices and policy regulations,
injuries and fatalities still occur in the industry. However, these measures have resulted in a decrease in the annual fatality rate (deaths per 100,000 miners) from 329 (average
rate from 1911 - 15) to 25 (1996 97). A summary of number of fatalities in the mining
industry from year 2000 to 2006 is illustrated in Figure 1.3 [5 22]. Various causes behind these fatalities can be classified into (i) mine fires, (ii) falls, (iii) individual(s) run
over by mining vehicles, (iv) individual(s) being caught in machinery, and (v) maintenance personnel(s) being struck by heavy objects with great forces.
2000 2001 2002 2003 2004 2005 2006 Years
Figure 1.3. Fatalities in mining, quarrying and related industries [5 - 22].
predominantly the reason for such incidents, at times, even mechanical wear and
2. LITERATURE REVIEW
An extensive literature review was completed focusing on the general topics of
mining vehicles and the wheels used on mining vehicles, with an emphasis on multi-piece wheels and statistics of fatalities and injuries arising as a result of incidents
that occur during maintenance of the multi-piece wheels. A thorough study was completed to understand (i) the technology behind multi-piece wheels and the need for
such wheels in the mining industry, (ii) the differences between a typical road wheel and
a multi-piece mining wheel, (iii) rules and regulations to be followed while installing or servicing multi-piece wheels, and (iv) fatalities and injuries associated with servicing and
maintenance of the multi-piece wheels in places such as North America, Australia, parts of Asia and Africa with a particular focus on Canada and United States. Additionally,
various standards related to experimental fatigue testing of wheels, state of the art
techniques in numerical modeling of mining wheels and other relevant research topics were considered during the literature review part of this investigation.
2.1. Difference between a wheel and a rim
In the scope of the research presented in this thesis, 'wheel' and 'rim' are two different entities associated with a mining vehicle. Figure 2.1 illustrates the difference between a typical wheel and a rim. Wheel as illustrated in Figure 2.1(a) has a wheel base
with an integrated flange, a removable side flange and a locking ring which holds the removable flange in position. Additionally, the wheel has an integrated mounting ring which is either welded or riveted to the wheel base. This mounting ring aids in fastening the wheel to the hub of the vehicle. However, a rim is made of a rim base, a removable
(c)
Figure 2.1. Difference between a wheel and a ran, (a) Wheel, (b) Run, (c) Cast spoke wheel.
2.2. Difference between a typical road wheel and a mining wheel
Road wheels are generally referred to the wheels on road cars and pick-up trucks, whereas mining wheels are generally utilized by vehicles such as loaders, dump trucks, and graders, in the mining industry. Mining wheels differ from typical road wheels in a
number of aspects including but not limited to size of tires, geometry, material, application, type of the wheel (single piece / two-piece / three-piece) and the procedure for fitting tires.
2.2.1. Size of the tire
2.2.2. Wheel material
Road wheels are usually made in a single piece through casting process either with magnesium or aluminum to improve fuel economy. Mining wheels are
conventionally made of mild steel because of the weight of the vehicle and the payload they have to support during transportation.
2.2.3. Application
Conventional road wheels are meant to be used on smoothly paved roads at speeds up to approximately 120 km/hr, whereas mining wheels are used on sand, gravel,
rugged and marshy terrains with relatively lower speeds of approximately 20 to 40 km/hr. The gross load on a typical road wheel from a road vehicle is approximately 1 to 3 tons
whereas, in the case of mining vehicles, apart from the weight of the vehicle that the
wheels have to support, they will be additionally subjected to payloads on the order of 30 tons on a surface mining vehicle to 45 tons on an underground mining vehicle.
2.2.4. Type of wheel
Road wheels are typically single piece, as illustrated in Figure 2.2. Mining wheels are usually multi-piece wheels as illustrated in Figure 2.3. The components of a three-piece wheel are the wheel base (consisting of a fixed flange and a mounting ring), the removable side flange, and a locking ring. The locking ring can be either continuous
Figure 2.2. A typical single piece road wheel.
Rim base Removable flange Locking ring Mounting ring
Figure 2 3 . A three-piece mining wheel.
A cross-sectional view of a typical single piece wheel is provided in Figure 2.4 with annotations to indicate the rim width, rim diameter, and rim offset, which is defined
outward motion of the removable flange when the tire is fully inflated. Any damage or
misalignment between these contacting entities significantly increases the potential for
incidents involving wheel assembly.
Rim
diameter-Figure 2.4. Single piece wheel.
GUTTER
SPLIT SIDE RING
t
RIM BASE
FIXED FLANGE
BEAD SEAT
(a)
C O N T I N U O U S SIDE RING SPLIT LOCK RING
f
RIM BASE
(b)
2.2.5. Difference in the procedure for fitting tires on wheels
There is a significant difference between the procedure for fitting a tire onto a mining wheel and a road wheel. Typically in conventional automobiles, as a result of the
use of a single piece wheel, the bead of the tire is pushed onto the wheel from one side
and the other bead is brought into the wheel by means of prying action. This procedure can be done either by manually prying the tire onto the wheel or the entire process of
putting the tire on the wheel can be automated.
Due to the fact that a mining wheel has to support significantly high payloads and
as a result of the high pressures that mining tires have to hold inside, the beads of the tires used on mining wheels are very stiff by having a significant tire side wall thickness. This
large amount of rubber does not allow prying of the tire onto a single piece wheel as
damage to either the wheel or tire will result. Therefore a multi-piece wheel is often used in the mining industry. As a first step in the procedure for fitting a tire onto a mining
wheel, the wheel base is held without the removable side flange and the tire is pushed onto the wheel base. Afterwards, the removable side flange is placed on the
wheel base / tire assembly and is maintained in place by insertion of the split
locking ring and inflation of the tire. Once the wheel is pressurized, the removable flange is pushed against the locking ring and so the components of the tire are held in proper
location to ensure the structural integrity of the wheel under operation. Rubber 'O' rings are used at the locking ring and wheel interface.
2.3. Rules and regulations from health and safety organizations
Inflating a truck tire appears simple and non-hazardous until one realizes that a 0.50 m tire inflated to 690 kPa can contain up to approximately 180 kN of explosive force [23]. A tire which has been properly maintained has the ability to handle that
amount of pressure. However, a poorly maintained tire or a tire which has been run flat or under-inflated for a long period of operation has the potential for serious catastrophes. Operating the vehicles for a long duration with flat or under-inflated tires significantly increases the potential for damage or misalignment of various components of the wheel.
resulting due to tire explosions. In spite of the fact that the tire was run under-inflated,
the pressure inside while servicing is more than sufficient to project various wheel parts,
potentially causing serious injuries or death to nearby workers.
A number of different health and safety organizations throughout the world
including, but not limited to, Occupational Safety and Health Administration (OSHA),
National Institute of Occupational Safety & Health (NIOSH), Mines and Aggregates Safety and Health Administration (MASHA), and WorkSafe have framed a set of rules,
regulations, and guidelines to be followed by individuals who are involved in service and maintenance of multi-piece wheels. It is the responsibility of every employer in the
mining industry to ensure safety of all employees by exposing them to various
regulations of the safety organizations. This can be achieved through the following methods:
1) Posting safety instructions for servicing in the area where service and maintenance of tires are performed.
2) Training new workers on safety procedures to handle such wheels and testing workers after the training to assess their level of understanding.
3) Lastly, documenting the training given to new workers.
SAFEWORK [24] specifically lists the following rules, which are to be abided by workers while servicing multi-piece wheels:
1) Tires must be completely deflated by removing the valve core prior to removal of the tire from the rim.
2) Tires must be mounted on compatible wheels of matching bead diameter and
3) A non-flammable lubricant must be applied to the bead and wheel mating surfaces
before mounting the bead.
4) The tire must be inflated only inside a restraining cage.
5) No tool other than the ones prescribed by the manufacturer should be used to
work on the tire.
6) A clip on chuck with an in-line pressure gauge and a sufficient length of hose
must be used while inflating the tire.
7) Tires must not be inflated to more than the recommended tire pressure.
8) Heat of any nature must not be supplied to the wheels. Cracked, broken, bent or
otherwise damaged wheels must not be reworked, welded, brazed or heated.
Maintenance personnel who are involved in service and maintenance of
multi-piece wheel are faced with a potential threat of serious injuries or even loss of Ufe,
if the rules dictated by various health and safety organizations are not properly followed. An investigation into the statistics of fatalities and injuries in the mining industry as a result of incidents from servicing multi-piece wheels was completed. Identification
of the causes of these incidents, the type of vehicle (or even specifically the wheel involved), and rationale for the failure of wheel components, and death / injury were completed. Causes of these incidents were identified to be mine fires, falls, individual(s) run over by mining vehicles, individual(s) being caught in machinery, and lastly,
maintenance personnel(s) being struck by heavy objects. In the category of being struck by heavy objects, multi-piece wheels used on mining vehicles and their components were observed to be more commonly involved in incidents than any other heavy object utilized by the industry. In most of the documentation of such incidents, critical information
(as previously listed in the third and fourth lines of this paragraph). The remaining
documentation did not make reference to any critical information associated with the
incident. As a result of this lack of critical information in the published documentation,
personal contact with associated personnel was attempted wherever possible. This
information, either extracted from the published documentation, or obtained through
personal contact is discussed in section 2.4.
2.4. Incidents from service and maintenance of wheels in mining industry
One incident associated with a single piece rim involving a tire failure, commonly addressed as a zipper type failure, was attributed to the weak side wall of the tire. The weakened sidewall significantly reduced the tire's ability to hold pressure and the tire
failed upon inflation, leaving a zipper pattern on the tire. The failure caused an explosion, which hurled the tire against a nearby worker with excessive force causing fatal injuries [25].
Specific to the two-piece rim assembly, two incidents were noted in which the workers were young (aged 20 years and 24 years). Moreover, they were not
appropriately trained enough prior to performing maintenance work on the wheels. The rationale behind these incidents was observed to be carelessness, and negligence in following the safety procedures prescribed by the wheel manufacturers. Additionally, improper tools (i.e., a pneumatic impact wrench) which were branded unsafe by the wheel manufacturers were used during wheel servicing [26 and 27].
Eleven incidents involved three-piece rim assemblies, and two cases out of the eleven employed young workers to service multi-piece rims [28 and 29]. The incidents
resulted due to carelessness at work and lack of understanding the importance of adherence to maintenance procedures specified by the wheel manufacturers, as previously noted in the two cases involving two-piece rim assemblies. Two other incidents, where a worker failed to use an in-line pressure gauge [30] and another worker
use caused the tires to explode projecting the wheel components against nearby workers, resulting in fatal injuries [25 and 32 - 36]. Two incidents revealed specific information
such as the locking ring just being partially seated prior to inflation [32] and the locking
ring not being fully engaged in the rim gutter because of a distorted side ring [25]. Most or all of the incidents noted above could have been prevented by proper use of a
restraining cage during inflation of the tires. Another incident resulted only in injuries to two maintenance personnel [37]. While they were trying to remove the lug nuts from the
wheel utilizing a socket wrench without completely deflating the tire, the removable
flange projected off the wheel with great force and came in contact with the workers. Consequently both suffered lacerations.
One fatal incident involving a five piece rim assembly was noted from the reviewed literature. When the worker was removing the outer tire on a dual tire
assembly, either a damaged component or some form of a misalignment in the inner
wheel caused it to fail resulting in its explosion. The explosion propelled the outer wheel assembly along with the failed components of the inner wheel assembly [38].
Eleven incidents were noted in the category that had no specific reference made to
the type of the rim assembly involved. Seven out of the eleven had fatalities owing to the
same reasons mentioned in the previous paragraphs. A number of different causes associated to the damage imparted to the wheel assembly during operation were
responsible for the incidents in the remaining four cases. It was noted that very old rims were still used in the industry and they were severely pitted and corroded owing to
excessive usage. These rims were not strong enough to hold the tire during inflation and
hence failed leading to a catastrophe [39 and 40]. As reported previously in most of the cases, the workers were very young and were found inflating the wheels without using a
restraining cage. In one other incident, a young worker observed a crack appearing on the split rim while he started removing the bolts from the rim assembly without deflating
the tire. As he continued further to remove the bolts, the assembly exploded resulting in
the loss of the worker's life [41]. As per the report referenced in [33], an 85-ton truck traveled close to a 138 kV electrical line with its box elevated and as a result, six tires of
explosion caused the components of the wheel assemblies to be sent to distances as far as
30 metres from the truck.
Although, it can be concluded that, for the majority of cases, the main rationale
behind wheel assembly explosion resulting in injury or death was due to worker or maintenance personnel failing to follow appropriate safety procedures, a number of cases
[25, 27, 28, 33, 37, and 39-41] existed where damage and reduced fatigue life of the rim
assembly also contributed to failure. Additionally, amongst the entire range of multi-piece wheels used in the mining industry, three-piece wheels were more commonly
involved in incidents as illustrated in Figure 2.6, which summarizes the number of incidents associated with each type of rim assembly. For this reason, a three-piece wheel
was selected to complete the experimental and numerical investigations needed for this
research. 20 42 15 a ."2 °3 a o u j a S 10 0 -1 2
^ 1 ^ ^
^ ^ ^ ^
_ i l _
^^^^^^^^^H ^^^^^^^^H
1 2 3 5 Unspecified
Number of pieces on rim
Figure 2.6. Incidents categorized based on rim type.
review of the obtained literature, it was concluded that, no standard specific to the fatigue
testing of a mining wheel exists. Hence, the SAE J1992 wheel cornering fatigue test
protocol which was developed by the Society of Automotive Engineers (SAE) for
assessing the fatigue performance of multi-piece bolted military vehicle wheel assemblies
was applied in numerical investigations involved in this research.
2.5. Fatigue in metals
Many structures and machine components are often subjected to highly
fluctuating stresses due to the nature of the cyclic loading they experience. These components have been found to fail even though they were subjected to stresses well below the ultimate tensile strength or in some cases even below the yield strength of the material. This nature of failure under the action of repeatedly occurring alternating or fluctuating stresses though within the yield stress is called fatigue failure. A fatigue
failure in any component occurs as a three step process. The first stage is the initiation of one or more micro-cracks due to cyclic plastic deformation followed by crystallographic propagation. These cracks are not normally visible to a naked eye. In the second stage, propagation from micro-cracks to macro-cracks occurs. The final stage corresponds to an
unstable crack growth and fracture occurs when the remaining material can no longer support the applied load [42]. Fatigue failure in metals can be divided into two classifications such as low cycle fatigue and high cycle fatigue, depending upon the number of load cycles they withstand before failure. In low cycle fatigue, the
components do not last more than ideally 103 cycles due to the significant amount of
plastic straining induced every cycle by the cyclic loading, whereas, in high cycle fatigue, a component typically lasts more than 103 cycles as the strains induced are well within
the elastic range. The current investigation on mining wheels is a high cycle fatigue
problem and out of the three major fatigue life classifications namely stress-life, strain-life, and linear-elastic fracture mechanics, the stress-life method based on the stress levels is the most appropriate method for this problem. In spite of being the least accurate method (especially for low cycle fatigue applications), it is the most traditional
state of stress experienced by the mining wheel under fatigue loading will be the same in
any cycle, whereas the strains will keep increasing gradually with every cycle owing to
the degradation of the material. Hence it is easy to get an estimate of the state of stress to
calculate fatigue life of the wheel.
2.6. Theories of fatigue failure under multi-axial stress states
A structure or a mechanical component (multi-piece wheel in this current
investigation) experiences periodic, time-varying, multi-axial stresses under the action of
a fatigue load. The stress state of a particular location within a component at any instant of time can be completely described with a stress tensor involving all the normal and
shear stresses (o^, am a^, r^, T^, r^). The alternating (a^a, Oyy,a, Gzz,a, Txy.a, *yz.a, w ) and
mean (o^m, %;,m, Ozz,m, *xy,m, Tyz,m, tzx,m) stresses which are significant in determining the
fatigue life of a component can be calculated using equations (2.1) and (2.2). These
equations are for normal x-axis stress component and the equations can be modified as needed to calculate the alternating and mean stresses for other components in the stress
tensor.
<T —<y
axx,a = ~ (2-1)
(7 +<J
axx,m = ~ (2-2)
2.6.1. Modified Goodman approach
Figure 2.7 illustrates a number of different fatigue failure theories utilizing the safe limit line for each theory plotted in the am - aa domain. The modified Goodman
approach which has a linear profile in the am - aa domain is considered one of the most
alternating stresses on the ordinate. The line connects Sut on the abscissa and Se on the
ordinate. The modified Goodman relation can be written as shown in equation (2.3).
?*- + ZL = 1 (2.3)
c
< S.
\ \
\ \
\ i— Yield (Langcr) line
\ \
Modified Goodman line
Load line, slope r = SJSm
ASME-elliptic line
Midrange stress <rm
Figure 2.7. Goodman, Gerber parabola, and Soderberg lines plotted on am - aa axes for fluctuating stress
fatigue failure criteria [42].
In order to utilize this relation in practical fatigue life assessments, a factor of safety needs to be considered. The alternating and midrange stresses aa and am can be
replaced with stresses naa and nam where n is the factor of safety and then the modified
Goodman relation takes the form in equation (2.4).
$e Su, n
The distortion energy theory or von Mises theory of failure suggests that for a
condition of folly reversed loading in ductile materials, this theory can be applied to
convert a multi-axial stress state under a fatigue loading into an equivalent uni-axial
situation, if the effective alternating stress is calculated based on the von Mises approach
utilizing the alternating stress components as represented in equation (2.5) [43]. In cases
where non-zero mean stresses exist, even the mean stresses play a significant part in the
assessment of fatigue life and the effective mean stress based on von Mises approach can
be estimated utilizing equation (2.6) which deals with the mean stress components
[44&45J.
IfrxM. - ^ . J 2 + ( < V - ^ . a )2 +((J^a - ^ . J2 +6(T\, +T\-„a +T2zx,a)
<7VM,a=\ Z (2-5)
°W,m=\ z (2.6)
Similar to the distortion energy theory, Sines theory of failure [46] can also be implemented to calculate effective alternating and mean stresses to assess fatigue life. The effective alternating stress calculated using the approach suggested by Sines is
consistent with the von Mises definition of utilizing the alternating stress components as presented in equation (2.7). However, to calculate the effective mean stresses, unlike the von Mises approach, only normal stress components are employed as illustrated in equation (2.8). The theory does not incorporate mean components of shear stress in the
effective mean stress definition, and it is consistent with experimental observations for multi-axial fatigue loading of smooth, polished, un-notched specimens [47].
°*«
=-\i
0"c« = G^ », + 0\„, m + 0"~». (2.8)
i , m xx,m W»m zz,m V *v/ The effective alternating and mean stresses calculated by von Mises and Sines
approaches are used in the modified Goodman theory of failure to assess a fatigue factor
of safety. Based on equation (2.4), fatigue factors of safety nVM (von Mises approach)
and ns (Sines approach) were calculated utilizing the formulae presented in equations
(2.9) and (2.10).
(2.9)
ns ~
®vM,a
s s,
e id
$ul + GvM,m
s s,
• S , +<7ut S,m Q
s
ea.
(2.10)2.6.2. Simplified Lemaitre's approach
Material damage starts to occur at very early stages of fatigue loading and this
initiates defects at micro and nano scales under cyclic stresses that are well below the engineering yield stress of the material as previously discussed [48]. As a result of this, failure due to fatigue is not easily identifiable in metals. Lemaitre provides a simplified approach to estimating the fatigue life under a fully reversed multi-axial stress state
which states that the maximum effective stress (o^nax) within the component should be ideally less than the modified fatigue strength (Se) of the material. A fatigue factor of
safety of the component utilizing this approach can be estimated based on equation (2.11).
eff.msx
where o^max is calculated as:
*«*-=*« R'n (2-i2>
where,
aeg=\ " (2-13)
^
=2 J l _
tv )
+ 3 ( l_
2 v ) (^
/^
) 2 (2_
14)<7 + <7 +CT
0-w =_ « 2 s. (2.15)
<7e9 and o// are calculated utilizing the maximum values of all the components
presented in equations (2.13) and (2.15) respectively. aeq is the equivalent stress
calculated based on the von Mises approach and OH is the hydrostatic stress. The ratio of
OH / Geq is called the stress triaxiality and Rv is called the triaxiality function. The
knowledge of this stress triaxiality is very important as it partly governs the damage growth through the triaxiality function [48].
2.6.3. Critical plane approach
In addition to the above mentioned approaches of fatigue life estimation, a critical plane approach for estimation of fatigue life proposed by McDiarmid [49] was
incorporated in this study. According to McDiarmid's theory, fatigue strength depends on the shear stress amplitude and the maximum normal stress on the plane of maximum shear stress amplitude (which is referred to as the critical plane). Based on data from a series of experimental fatigue tests conducted by McDiarmid on thin walled tubular
fatigue (which is relevant to the current study involving multi-piece mining wheel) as
presented in equation (2.16).
Ta=q-C2-an^ (2.16)
In equation (2.16), the shear stress amplitude^, is a function of crnmax, which is
the maximum normal stress (equal to the sum of alternating and mean components of the normal stress) on the critical plane of maximum shear stress amplitude. According to
McDiarmid [49], for a reversed shear fatigue problem, the constant Cj can be assumed to
be equal to the reversed shear fatigue strength and Q equal to the reversed shear fatigue strength divided by twice the ultimate tensile strength of the material. The reversed shear
fatigue strength (tAiB) as presented in equation (2.17) depends on the crack type, either
case A or B. Case A is a crack which initiates on the surface and subsequently
propagates through the component, whereas the crack initiation site occurs within a
component and propagates outward in case B. Upon incorporating the type of crack growth, the new criterion for failure can be written as in equation (2.17).
rm=t4B-^-*rmjmi (2.17)
To apply the failure criterion in practical design application, a factor of safety ncp
has been incorporated into the failure criterion and can be estimated utilizing equation (2.18). McDiarmid [50] proposed that for multi-axial loading conditions resulting in
combined normal and shear stresses, value of the reversed shear fatigue strength can be assumed as the fatigue strength of the material in torsion which is estimated as 0.3 times the value of ultimate tensile strength of the material. This approximation has been used in this study.
2Sia -tiJt
» ,u +°" .max -UB
2.7. Wheel cornering fatigue test
There existed no specific standard to perform a fatigue test on a multi-piece
mining wheel. In this current investigation, a wheel cornering fatigue test was performed
on a three-piece wheel utilizing the procedure obtained from the Society of Automotive Engineers' standard SAE J1992, the testing methodology for a multi-piece bolted wheel
used in military vehicles. Figure 2.8 illustrates the setup of wheel cornering fatigue test based on the SAE J1992 testing protocol.
According to the SAE J1992 protocol, the test is conducted by subjecting the
wheel to a rotary fatigue load. This is achieved by either applying a rotating bending moment to a fixed wheel assembly or a fixed load which is capable of generating the
corresponding bending moment, to a rotating wheel assembly. The shaft to which the load is applied is attached to the mounting ring of the wheel assembly utilizing the bolts
specified by the wheel manufacturer. Correspondingly, the nuts have to be tightened to
the torque levels suggested in the manufacturer's guidelines. The wheel under no load should not have an eccentricity of more than 0.254 mm in its clamped position. The test
load is applied at the free end tip of the shaft in a position parallel to a plane through the centre of the wheel and the test load should be capable of mamtaining the applied load
within ±3% throughout the duration of the test [51]. Equation (2.20) can be used to
calculate the test load 'L' to be applied to the wheel assembly.
L
J».r
s+d).S.L
R (22Q)where,
L is the test load to be applied to the wheel assembly fi is the co-efficient of friction between the tire and the road
rs is the static loaded radius of the largest possible tire for the wheel d is the inset or outset on the wheel
LR is the load rating of the wheel as specified by the wheel manufacturer
/ is the moment arm
In the current study, it was not possible to estimate the test load utilizing equation
(2.20) due to the fact that this standard was not specific to a multi-piece mining wheel and as a result most of the above mentioned parameters were unavailable. However,
based on the load rating of the wheel obtained from the wheel manufacturer, and the gross vehicle weight of the mining vehicle, an approximate value of the test load to be
applied to the wheel during the experimental testing was calculated as 22 kN.
PO
MONBCTAflM 7 K M M ( 3 D H ) i a N
TABLE
Figure 2.8. Wheel cornering fatigue test setup based on SAE J1992 [52].
The wheel assembly should be able to withstand a minimum of 20,000 cycles of
the applied rotary fatigue load in order to pass the test. However, during the fatigue testing of the wheel, if the wheel assembly reaches a state where it cannot support the applied load any longer, (or) a visually detected crack appears and penetrates through any section of the wheel assembly (or) any of the wheel clamps break and separate from the
2.8. Past numerical investigations on fatigue life assessment of wheels
Shang [52] has previously completed numerical analysis involving dynamic impact and cornering fatigue conditions on magnesium road wheels in an effort to
enhance their mechanical performance. Initially, a numerical model of a wheel and tire assembly incorporating material in-homogeneity within the wheel was developed to
complete dynamic impact test simulations. Impact was investigated between a rigid
striker and the wheel assembly. To reduce the complexity of the model and hence computational time for analysis, the tire was removed from the model and an
approximate 20% reduction in the initial kinetic energy of the striker was considered to account for the tire removal. Experimental investigations for dynamic impact testing
were completed on a similar magnesium road wheel and the observations from these
experiments were utilized in validating the developed numerical model. Wheel cornering fatigue test simulations were performed utilizing two different approaches. In the first
method involving static stress analysis, loads in different bending directions were applied to the hub, whereas in the second method with a dynamic stress analysis, a rotating
bending moment was applied to the hub. Predictions from both the static and dynamic
stress analyses were applied to the Goodman linear fatigue failure criterion for multi-axial stresses to assess the fatigue life of the wheel. The numerical model was
capable of predicting exactly the location of fatigue crack growth. Design modifications were applied to the wheel model, which resulted in an improved fatigue performance of
3. RESEARCH OBJECTIVES
Based upon a thorough analysis of the obtained literature, the following findings were obtained:
1) The mining industry demands the use of multi-piece wheels on mining vehicles due to various reasons discussed in chapter 2 of this thesis. Unfortunately, most
of the incidents / fatalities that occur in the industry are found to be associated
with multi-piece wheels and most specifically three-piece wheels as documented in the obtained literature.
2) The rationale associated for these incidents were maintenance personnel failing to follow safety guidelines. In some incidents, the mechanical degradation of the
wheel as a result of impact or damage was found to initiate failure.
3) Numerical analyses to enhance the mechanical performance of road wheels have been previously completed. For mining wheels, no numerical investigations
relating to the assessment of wheel performance under different loading conditions or rather enhancement of wheel's mechanical performance has been
attempted. Additionally, to the best of author's knowledge, no finite element
model of a multi-piece mining wheel has ever been developed.
To address the above findings from the literature review, various objectives for this current study were defined and are specified as:
1) A three-piece mining wheel assembly will be selected to complete the proposed experimental and numerical investigations of this study.
completed at the University of Windsor to assess the mechanical performance of
the wheel assembly.
3) A finite element model of the three-piece wheel incorporating all wheel geometry
aspects, elastic material behaviour and proper contact between all wheel
components will be developed. The experimental testing will be simulated on the
developed model numerically using LS-DYNA.
4) Numerical predictions from the simulation of the experimental test will be compared to observations from the experiment to validate the numerical model.
5) The validated numerical model will be utilized to perform numerical analyses
involving the SAE J1992 wheel cornering fatigue test. Predictions from these
analyses will be used to assess the fatigue performance of the three-piece wheel
4. EXPERIMENTAL INVESTIGATIONS
Experimental testing with the application of a quasi-static loading through the
mounting ring of the wheel was performed following the testing procedure prescribed in the wheel cornering fatigue test standard SAE J1992 to understand the state of stress on
the wheel under simulated SAE J1992 tests. The entire testing procedure was repeated four times. The fatigue testing apparatus at the University of Windsor did not have the
facility to apply the boundary conditions specified in the SAE J1992 protocol and as a
result experiments were conducted under quasi-static loading condition in contradiction to the specified rotating dynamic bending loading. This experimentation necessitated the
manufacture of auxiliary fixtures such as a shaft to apply the bending load onto the wheel, an adapter plate to fasten the shaft to the mounting ring of the wheel, and other
wheel supporting fixtures to hold the wheel in position during experimentation.
Additionally, to observe the strain distribution on the apparatus, ten strain gauges were mounted on different locations of the wheel and shaft as illustrated in Figures 4.2(a) and
4.2(b). These locations were selected based upon strain magnitudes and high strain gradients predicted by the numerical analyses of the experimental tests.
4.1. Manufacture of auxiliary fixtures
4.1.1. Loading shaft
The loading shaft was the structural member that transmitted the load from the
hydraulic actuator to the wheel through the adapter plate. The shaft was manufactured from AISI 4140 [42] steel based upon design calculations (provided in Appendix A) to support a load of 22 kN, which is equal to the load on one of the rear axles of the rnining vehicle the wheel is intended for use. The diameter of the shaft was 100 mm and the
length of the shaft was 700 mm. The shaft was press fitted into the bore of the adapter plate and this assembly was fastened to the wheel utilizing one inch diameter bolts, in such a way that the centreline of the assembly was inline with the centreline of the wheel. A quasi-static bending load was applied in a direction perpendicular to the centreline of
Figure 4.1(a). Experimental setup illustrating the shaft, the fixtures and the point of load application.
4.1.2. Adapter plate
The adapter plate was manufactured to transmit the applied load from the shaft to the wheel assembly. The adapter plate was a thick cylindrical plate, 350 mm in diameter,
slightly larger than the bolt circle diameter of the mounting ring. The adapter plate had a thickness of 120 mm and was constructed of AISI 1018 steel [42]. The dimensions of the plate were based on design considerations mentioned in Appendix A. The adapter plate had twenty holes (one inch diameter) threaded in an identical pattern to that of the mounting ring. A bore with a diameter of 100 mm was manufactured into the centre of
Figure 4.1(b). Experimental setup illustrating the adapter plate.
4.1.3. Wheel supporting fixtures
Three wheel supporting fixtures were manufactured to maintain the wheel in a
fixed position during testing. Two lower support fixtures to support the wheel from the bottom, on the two flanges and one upper support fixture to hold the upper portion of the flange which is furthest from the point of load application, were constructed. The fixtures were flat on one side and had a curved profile on the other side to exactly match the curvature on the flanges of the wheel. The fixtures were manufactured out of AISI
4.2. Configuration of the data acquisition system
The data acquisition system (DATASCAN) was setup to accommodate ten strain gauges, a load cell and a linear variable differential transformer (LVDT). The load cell
and the LVDT were mounted on the enerpac hydraulic cylinder, to measure the load on the wheel and the displacement of the shaft respectively. The resistance on the load cell
was 350 Q and voltage rating was 2 mV The load cell had a measurement range of
110 kN and after connecting the load cell to the data acquisition system, it was calibrated using a Tinius Olsen compression testing machine. The measuring range of the LVDT
utilized was 150 mm. The system was capable of recording data at 1 Hz.
4.3. Strain gauge application
The strain gauges used in this experimentation were Omega precision strain gauges with serial number SGD-3/350-LY11. The strain gauges had a nominal resistance of 350 Q, and a maximum voltage rating of 9.5 V. The strain gauges were adhered to the
testing apparatus through the following process; grinding of the auxiliary fixtures and the wheel components was first completed to remove any form of paint; the surface was then treated with isopropyl alcohol to remove any grease or oily content on the surface; the surface was cleaned by gently rubbing with mild acetic acid after which a neutralizer was
applied to remove any moisture present. The strain gauges were carefully removed from the packaging and fastened to the wheel with a small amount (one drop) of M-Bond 200 adhesive manufactured by Davidson Measurement Pty. Ltd. The adhesive selected has been certified by VISHAY Micro-Measurements for large deformations on the order of
60,000 microstrain if utilized with appropriate strain gauges. The accuracy of the measured strains depended on the thickness of the adhesive layer that existed between the strain gauges and the wheel and hence it was ensured that just a thin layer of adhesive existed. Figures 4.2(a) through 4.2(c) illustrate the positions of the strain gauges on the
testing apparatus.
Three strain gauges (1L1, 1L2 and 1L3) were mounted on the outer surface of the mounting ring, three strain gauges (1L4, H5 and H6) on the removable side flange and
strain gauges on the flanges of the wheel were mounted in a radial direction.
Additionally, two strain gauges (2L1 and 2L2) were fastened to the shaft to measure
strains in the axial direction along the x-axis.
(a) (b)
(c)
Figure 4.2. Positions of strain gauges on the testing apparatus, (a) Positions of strain gauges on the shaft,
(b) Positions of strain gauges on the mounting ring, (c) Positions of strain gauges on the wheel base and the
removable side flange.
4.4. Setup of the ARAMIS system
ARAMIS is a non-contact optical three dimensional large deformation measurement system developed by GOM mbH, Germany. The ARAMIS system is particularly suitable for three-dimensional deformation measurements under static and
of analyzing, calculating and documenting material deformations and the ability of the system to graphically represent the measured results provides an optimum understanding
of the behaviour of the object to be studied. ARAMIS recognizes the surface structure of the object through digital camera images and allocates coordinates to the image pixels.
The initial condition of an apparatus where typically no load exists is referred to as the
reference condition and the first coordinates are assigned when recording the reference condition. With relevance to the current investigation, the position where the mining
wheel was not subjected to any bending load was recorded as the reference condition. When the actual loading begins, ARAMIS records further series of images depending
upon a preset frequency. The ARAMIS system compares the digital images at different
steps and calculates the displacement and the deformation in the region of a testing apparatus prepared for the optical strain evaluation.
The region of the mounting ring symmetric to the vicinity of strain gauge 1L2 as
illustrated in Figure 4.3 was selected within the wheel assembly for optical strain measurement. The mining wheel investigated in this research had a homogeneous
surface and as a result of that, the region to be observed with the ARAMIS system had to be painted white followed by spots of black sprayed on the white background for the
camera to be able to recognize and allocate coordinates to the image pixels. A typical
Figure 4 3 . Location of strain observation by the ARAMIS system.
The region of the wheel selected for optical strain investigation measured approximately 300 mm in length and 250 mm in width. Hence, in order to calibrate the ARAMIS system for this field of view, a calibration panel of dimensions 350 mm in
length and 280 mm in width was used which led to a total measuring volume of 350 x 280 x 280 mm3 The focal length of the lens used in the cameras was 12 mm with a fully
closed aperture. The cameras were at a distance of 280 mm apart and at an angle of 25° The measuring distance, which is the distance between the front face of the camera
support bar and the object of measurement, was set at 570 mm based on the ARAMIS manual. Specimen lighting was provided by a 650 watt halogen lamp. The system was configured to capture data every 5 seconds.
4.5. Setup of the experimental test
concrete floor of the laboratory, and the supporting fixtures that were utilized to hold the
wheel in position from the bottom of the wheel were welded to this column. The upper support fixture was placed on top of the flange, farthest from the point of application of
the load and the support's motion was arrested to ensure negligible movement of the flange. Figure 4.1 illustrates the setup utilized for this experimental testing. An enerpac
hydraulic cylinder with a stroke of approximately 250 mm and a loading capacity of
900 kN was positioned at the far end tip of the shaft to load the system up to 22 kN. The load was gradually applied from 0 to 22 kN in a span of approximately
7 minutes. After reaching that maximum load, the system was held undisturbed in that state for approximately one minute after which the system was unloaded. All strain
gauges connected to the data acquisition system along with the load cell and LVDT were
recording data at the rate of 1 Hz and ARAMIS was recording data at the rate of 0.2 Hz. The entire experimental testing was captured using a Sony (HDR-SR10) high definition
camcorder.
4.6. Experimental results
4.6.1. Results from the data acquisition system
Strains measured at various locations of the wheel were plotted against bending load to establish the relation between the two parameters. A linear relationship existed
between the strains measured at all ten locations on the wheel and the bending load. This linear relationship between the strains and the bending load was expected as the wheel was loaded within the elastic limit of the material throughout the period of testing. Observations from test to test were generally consistent and hence a good repeatability was established. Observations from the second test were calculated and graphed as a
700
600
500
e 400
1 300
§ 200
100
0
•100
-O— 2Ll(Shaft) - • — 2L2(Shaft) - C-— 1 LI (Mounting Ring) - • — lL2(Mounting Ring) - u? — 1 L3(Mounting Ring)
lL4(Flange) H5(Flange) H6(Flange) H7(Whed Base) H8(Wheel Base)
{•Shaft
•Wheel
0
10 15
Load(kN)
20
25
Figure 4.4(a). Strain versus load profiles for all ten strain gauge positions from the second experiment.
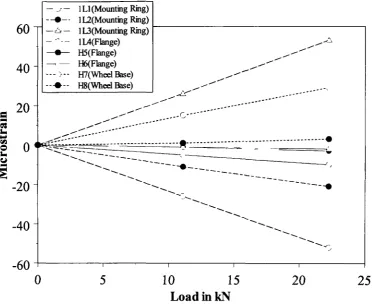
The strains measured at different locations on the testing apparatus are illustrated
in Figure 4.4(a). The two curves 2L1 and 2L2 correspond to the two strain gauge
positions on the shaft. The remaining eight curves (ILl, 1L2, 1L3, 1L4, H5, H6, H7, and H8) represent the strains measured at different locations within the wheel assembly. In
140
105
70
—o-— • —o-— —/-— — ; —
• —i>— O -— • "
1 LI (Mounting Ring) lL2(Mounting Ring) lL3(Mounting Ring) lL4(Flange) H5(Flange) H6(Flange) H7(Wheel Base) H8(Wheel Base)
, *
^sr-...ZA
-j£
- • ^ e ^ ' - - < J ^
10 15
Load(kN)
20
25
Figure 4.4(b). Strain versus load profiles for strain gauge positions (wheel assembly) from the second
experiment.
![Figure 1.1. Contribution of the mining industry to Canada's GDP [1].](https://thumb-us.123doks.com/thumbv2/123dok_us/1470008.1180107/17.611.99.504.205.486/figure-contribution-mining-industry-canada-s-gdp.webp)
![Figure 1.2. Revenue to the governments from the mining industry [3].](https://thumb-us.123doks.com/thumbv2/123dok_us/1470008.1180107/18.616.102.505.61.346/figure-revenue-governments-mining-industry.webp)
![Figure 1.3. Fatalities in mining, quarrying and related industries [5 - 22].](https://thumb-us.123doks.com/thumbv2/123dok_us/1470008.1180107/19.611.103.502.267.557/figure-fatalities-mining-quarrying-related-industries.webp)