CSEIT184660 | Published – 08 May 2018 | May-June 2018 [ (4 ) 6 : 318-324 ]
National Conference on Engineering Innovations and Solutions (NCEIS – 2018)
International Journal of Scientific Research in Computer Science, Engineering and Information Technology © 2018 IJSRCSEIT | Volume 4 | Issue 6 | ISSN : 2456-3307
318
Risk Factor Analysis of Diseases Using Machine Learning
Techniques
Vanishri Arun*1, Rakshitha Hathwar1, Keerthana Basavaraj1, Sonali C H1, Chaitra J P1, Dr. Murali Krishna2,
Dr. Arun Kumar B V3
*1Department of Information Science and Engineering, S.J.C.E., JSS S&T University, Mysuru, Karnataka, India 2Consultant Psychiatrist, FRAME, Mysuru, Karnataka, India
3Department of Anaesthesiology, BGS Apollo Hospital, Mysuru, Karnataka, India
ABSTRACT
Analysing the risk factors of Mental health from Electronic Health Records is a challenging task as it is difficult to assess the prevalence of diseases due to lack of culturally adapted and validated assessments. In this study, we find the risk factors of Memory deterioration using Machine Learning techniques by implementing Correlation, Regression Analysis and Random Forest algorithms on MYNAH cohort (Mysore Studies of Natal effect on Ageing and Health) which was carried out at the Epidemiological Research Unit, CSI Holdsworth Memorial Hospital, Mysuru, South India. Correlation is used to find the influence of one parameter on the other which play roles in identifying risk factors of Memory deterioration. Regression analysis helps in estimating the relationships among parameters that are used for disease prediction. Random forests or random decision forests algorithm brings extra randomness into the model to search for the best parameter among a random subset of parameters. It is an ensemble learning method for classification, regression and other tasks in which a multitude of decision trees are constructed at training time and the class is output. In Classification problem, the ensemble of simple trees vote for the most popular class. In the Regression problem, the responses are averaged to obtain an estimate of the dependent parameter. Implementation of tree ensembles has lead to significant improvement in prediction accuracy. This work facilitates health care organizations to perform analysis on sector of population prone to various diseases using Electronic Health Records and educate people regarding the risk factors of diseases to enable effective therapy at the right time and place.
Keywords: Electronic Health Records, Correlation, Regression Analysis, Random Forests
I.
INTRODUCTION
Electronic health record is a digital format containing a systematic collection of health information of an individual patient or populations that is maintained by the provider over a period of time [1]. It contains information such as the patient’s demographics, contact information, medical history, current and past medications, vital signs, allergies, daily routine, immunizations, family history,
radiology reports and laboratory data [2]. It is a more longitudinal collection of health information of individual patients or population. EHRs make it easier to store and retrieve health information and make information available instantly and securely to authorized users.
the memory are caused due to the damage of neuro-anatomical structures[4]. The damage to these structures reduces the capacity of the brain with regard to the retention and storage. It also leads to problem in recollection of memories. Memory disorders can range from mild to severe, but they all result in severe diseases at the end such as Alzheimer. There are several reasons that can cause memory disorders such as high blood pressure, alcohol consumption, wrong consumption of medicines, etc. Some past events, shocks, and strokes also lead to such diseases. Even depression can cause symptoms similar to dementia. Some of the disorders affecting memory deterioration include ability to reason, remember, completing daily chores, muddled thinking, and loss of skill or hobby, make decisions and communicate [5].
In this paper, we develop a model to mine the EHR for important features that play vital role in identifying risk factors for memory deterioration using Machine Learning techniques.
Correlation is a statistical measure that indicates the relationship between two variables and the association between them. The two most popular correlation coefficients are: Spearman's correlation coefficient rho and Pearson's product-moment correlation coefficient. Pearson’s product-moment coefficient is used in this study as a measurement of correlation and it ranges from minus one to plus one. Plus one indicates the strongest positive correlation possible and minus one indicates the strongest negative correlation possible. A correlation of zero indicates that there is no relationship between the two variables, hence values closer to zero highlight weaker or poorer correlation than those closer to plus one or minus one. When there is a positive correlation between two variables, it indicates that as the value of one variable increases, the value of the other variable also increases. When there is a negative correlation between two variables, it indicates that as the value of one variable increases, response variable (dependant variable) and predictor variable (independent variable). The dependant variable is the main factor we are trying to predict or understand and analyze. The independent variables are the factors we suspect to have an impact on our dependant variable. Hence, regression analysis helps us to understand which among the independent variables are related to the dependent variable and to explore the forms of these relationships [7].
The Logistic Regression is a regression model used for regression analysis in which the response variable (dependent variable) has categorical values such as True/False or 0/1. It actually measures the probability of a binary response as the value of response variable based on the mathematical equation relating it with the predictor variables. It is used when the response variable is categorical in nature.
diameters of the mother, etc. The cohort size is 1321 patient records with 1201 parameters from which features relevant to memory deterioration are chosen for the implementation of Correlation, Regression Analysis and Random Forest algorithms to identify risk factors [10].
Mizanur Khondoker et al, compare the performance of classification of important attributes using machine learning algorithms. The classification algorithm shows better correlation between variables, but Random Forest goes bad when the variables are very high [11]. V Y Kulkarni et al present approaches for improving performance of Random Forest classifier in ways like accuracy and time for learning and classification and show that Random Forest has inherent parallelism and can be easily parallelized for scalability and efficiency [12]. V. Arun et al find the relevant features of the data sets using Principal Component Analysis and an ensemble classification framework is used which consists of three modules, namely data acquisition and preprocessing, classifier training and Hierarchical Majority Voting ensemble model for disease classification and prediction [13]. K.Rajeswari et al use the Brute force approach and genetic search feature selection for heart disease to reduce features and improve the performance [14].
Artificial intelligence methods for the diagnosis of dementia in epidemiological studies in low- and middle-income country (LMIC) settings have been implemented by Bhagyashree et al by developing a culture and education fair battery of cognitive tests. Validation is done for population based studies in low- and middle-income countries including India by the 10/66 Dementia Research Group. Machine learning methods are used based on the 10/66 battery of cognitive tests for the diagnosis of dementia based in a birth cohort study in South India [15].
In the existing system, the diagnosis of memory disorders is done considering various tests and assessments which include the personal history of the patient, physical examination and laboratory tests, cognitive tests, neuropsychological tests, radiology tests, brain imaging techniques and numerous other tests [16].
In the proposed system, we develop a model to estimate the relationships among parameters used for
disease prediction using Regression analysis. Random forest approach is used to search for best parameters among a random subset of parameters. An ensemble of trees vote for the most popular class that leads to improved prediction accuracy.
II.
METHODOLOGY
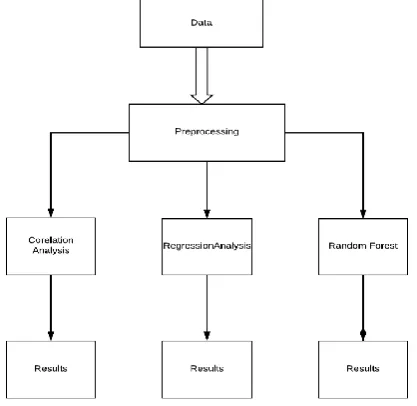
The risk factor analysis and prediction analysis based on correlation and regression models involves finding the relationship between the attributes and then considering the subset of the attributes most responsible for prediction of a person having memory deterioration. The MYNAH cohort consists of 30 related predictor variables which are in the form of questionnaires and one categorical response variable which indicates the presence or absence of memory deterioration. The questionnaire predictor variables such as apathy, difficulty in completing chores, loses place in conversation etc have discrete values such as 0 and 1.
The process of analyzing the risk factors and then performing the prediction analysis on the cohort involves the following procedures:
Step 1 : Input MYNAH dataset.
Step 2 : Preprocess data by handling missing or NA values.
Step 3 : Perform Correlation analysis on the whole data and find the most and least correlated attributes. Step 4 : Perform Regression analysis on the whole data and obtain the significant attributes.
Step 5 : Implement Random Forest algorithm on the same data and obtain the attributes ranked in logistic regression model using train set.
Step 8 : Predict the class of test set using the trained model.
Step 9 : Evaluate the performance of the regression model.
The correlation among 30 predictor variables D(x1, x2, ..., x30) along with the response variable y is identified. In general, the correlation of two variables X,Y is given as in (1)
cor(X,Y) = P(XUY)/P(X)P(Y) (1)
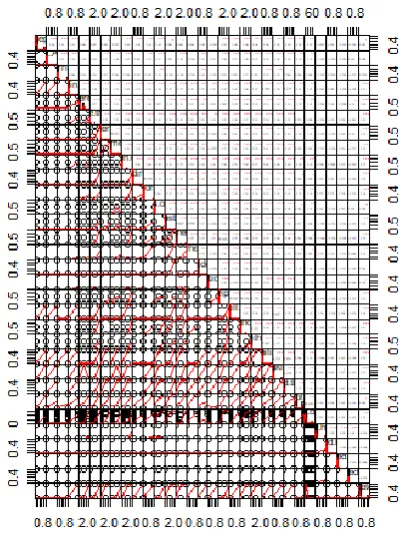
If the correlation value of x and y is between 0 to 1 then they are said as positively correlated which in turn indicates the increase in variable x will result in increase of variable y. According to the parameters we have considered in the data, we find there exists positive correlation between attributes such as forgets friends names and forgets family names with correlation co efficient 0.66. The highest positive correlation is found to be between attributes forgets when last saw informant and forgets where he/she is with the value of the correlation co-efficient 0.8.
Figure 1. Risk factor Analysis Model
If the correlation value of x and y is between -1 to 0 then they are said to be negatively correlated which in turn indicates increase in variable x will result in decrease of variable y. According to the attributes we have considered, there exists a negative correlation between irritability and forgets what did previous day attributes with negative correlation coefficient of -0.04. Few attributes such as depression and difficulty completing chores, gets lost inside house and apathy are found to be least correlated. Thus the inter relationship between the 30 predictor attributes can be found out using the correlation analysis.
Logistic regression gives the quantified value to measure the strength of relationship among the attributes of the data. The logistic regression is concerned only about the probability of the outcome dependant variable. The expression of regression model of our research can be written as in (2).
y = f(x1, x2, ..., x30) + ↋ (2)
where y is dependant(response) variable and x1,x2,...,x30 are independent(predictor) variables. ↋ is the standard error associated with analyzing the association of attributes with the class attribute-memory deterioration. The results of the regression analysis consists of estimated co-efficient, standard error associated with the co efficient, z value which indicates the ratio of estimated value and error value and pr value which indicates the significance of the attributes.
Table 1 consists of the values of attributes such as forgets where things are put, loses places in conversation and difficulty handling money.
Figure 2. Prediction Analysis Model
conversation are found to highly significant attributes in predicting the presence of disease. The prediction of the test set is done using the regression values obtained from the attributes and the trained model assigns the class. In our case, the binomial logistic regression has class variable memory deterioration with categorical values 0 or 1.
The importance of the features can be measured and ranked by using Random Forest algorithm. Considering the data with 30 attributes, the importance of each attribute is calculated using the mean squared error obtained during the fitting process.
Table 1.
Regression Values Of Attributes
Attribute name
Estimate Standard error
Z value
Pr value Forgets
where things are kept
1.21e+00 2.23e-01 5.44
5.16e-08
Loses place in
conversation
1.03e+00 4.35e-01 2.37 0.01
Difficulty handling money
1.91e+00 9.98e-01 1.91 0.05
The tree is formed fitting the values of regression and the error associated with it is calculated. The difference in error values obtained are averaged and the importance score is obtained. Attributes with high scores such as forgets where things are kept, forgets where things are put, loses place in conversation, forgets friends names, general decline in mental function are ranked as important than attributes with the low scores such as past history of family.
III.
RESULTS AND DISCUSSION
The highest correlation value was found to be 0.8 between the attribute forgets when last saw informant attribute and forgets where he/she is attribute. Difficulty coping with change in routine and difficulty handling money has correlation coefficient of value 0.76. Attributes like gets lost in the house and difficulty completing chores, apathy, irritability are found to be least correlated.
The Logistic Regression on the data identified attributes such as Forgets where puts things, forgets friends names, loses place in conversation, difficulty handling money as the high risk factors as their significance values are less than 0.05. The attributes such as dwells on past and past history of family are not considered as risk factors as the pr value of those attributes are higher making them least significant. The Random Forest ranks and orders the attributes based on values of percentage increase in mean squared error. The attributes such as forgets where things are put, forgets where things are kept, loses place in conversation, forgets friends names, forgets family names, general decline in mental function are ranked highest. The past history of the family attributes are ranked last in the analysis.
Figure 3. Correlation Plot of all the attributes
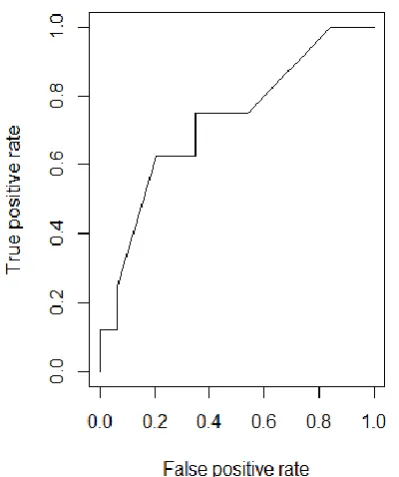
The performance of the binomial logistic regression is evaluated using the Receiver Operating Characteristic (ROC) curve as shown in Figure 5. The curve is plotted with true positive rate against the false positive rate.
turn indicates that the classifier model is efficient. The Accuracy of the model is found to be 88.72%. The results help in early diagnosis of cognitive impairment in patients which may lead to Alzheimer’s disease in future [17 18].
Figure 4. Variable importance plot obtained by Random Forest
Figure 5. ROC Curve to evaluate the performance
IV.
CONCLUSION
Correlation analysis is done in order to find the relationship between the attributes of MYNAH dataset. The symptoms identified and their correlation indicate the association of them with causing the memory deterioration. The Logistic Regression and Random Forests results give us the important risk factors of memory deterioration. The Random Forest ranks many attributes as risk factors when compared to regression. The binomial regression model identifies the subset of risk factors and does the prediction with better accuracy in population based epidemiological studies.
V.
FUTURE ENHANCEMENT
In future analysis, we intend to implement PCA
in order to optimize the number of risk factors
responsible for a person having or prone to get
memory deterioration. The prediction analysis
can also be done using other classifiers such as
decision trees, support vector machine and
others. A comparative study on the results of
different classifiers can be done in order to
predict the presence of various diseases using
EHR.
VI.
REFERENCES
1. https://en.wikipedia.org/wiki/Electronic_health_ record
2. https://searchhealthit.techtarget.com/definition/e lectronic-health-record-EHR
3. Vanishri Arun, Arunkumar B.V., Padma S.K., Shyam V. (2018) Evidence-Based Technological Approach for Disease Prediction Using Classification Technique. Proceedings of International Conference on Cognition and Recognition. Lecture Notes in Networks and Systems, vol 14. Springer, Singapore. DOI : https://doi.org/10.1007/978-981-10-5146-3_27. 4. https://en.wikipedia.org/wiki/Memory_disorder 5. http://www.human-memory.net/disorders.html 6.
https://www.statpac.com/statistics-calculator/correlation-regression.htm
8. https://medium.com/@Synced/how-random- forest-algorithm-works-in-machine-learning-3c0fe15b6674
9. Prof Anisor and PhD Flavia.“Analysis of performance of organization using multiple regression”, International conference of scientific Research in Computer Science. (2014).
10. Murali Krishna et al, “Cohort Profile: The 1934– 66 Mysore Birth Records Cohort in South India”, International Journal of Epidemiology, 2015, 1833–1841 doi: 10.1093/ije/dyv176.
11. Mizanur Khondoker, Richard Dobson, Caroline Skirrow, Andrew Simmons and Daniel Stall for Alzheimer’s disease, “A comparison of machine learning methods for classification using simulation with multiple real data examples from mental health studies”, International Journal of Engineering and Innovative on Computer Systems (May 2014).
12. Vrushali Y Kulkarni, Pradeep K Sinha, “Effective learning and classification using random forest algorithm”, International Journal of Engineering and Innovative on Computer Systems (2014). 13. V. Arun et al, “Disease Classification and
Prediction using Principal Component Analysis and Ensemble Classification Framework “, International Journal of Control theory and Applications, 2017, ISSN: 0974-5572, Vol 10, no. 14.
14. Prof.K.Rajeswari, Dr.V.Vaithyanathan and Shailaja V Pedi, “Feature Selection for classification on medical Data Mining”, International Journal of Engineering and Innovative on Computer Systems. (April 2013). 15. Bhagyashree S R et al., “Diagnosis of Dementia
by Machine learning methods in Epidemiological studies: a pilot exploratory study from south India”, Soc Psychiatry Psychiatr Epidemiol. 2018 Jan;53(1):77-86. doi: 10.1007/s00127-017-1410-0. Epub 2017 Jul 11.
16. Ms. Sumathi M.R., “Prediction of Mental Health Problems Among Children Using Machine Learning Techniques”, (IJACSA) International
Journal of Advanced Computer Science and Applications, Vol. 7, No. 1, 2016.
17. Aram So et al, “Early Diagnosis of Dementia from Clinical Data by Machine Learning Techniques” Applied Sciences, ISSN 2076-3417.
18. Ana Luiza Dallora et al., “Machine learning and microsimulation techniques on the prognosis of dementia: A systematic literature review”, PLOS
one, 2017,