Taxonomy Beats Corpus in Similarity Identification, but Does It Matter?
Minh Ngoc Le
VU University Amsterdam [email protected]
Antske Fokkens
VU University Amsterdam [email protected]
Abstract
We present extensive evaluations compar-ing the performance of taxonomy-based and corpus-based approaches on SimLex-999. The results confirm our hypothesis that taxonomy-based approaches are more suitable to identify similarity. We intro-duce two new measures of evaluation that show that all measures perform well on a coarse-grained evaluation and that it is not always clear which approach is most suit-able when a similarity score is used as a threshold. This leads us to conclude that the inferior performance of corpus-based approaches may not (always) matter.
1 Introduction
Similarity measures are used in a wide variety of Natural Language Processing (NLP) tasks (see Pilehvar et al. (2013), among others for examples). They may be used, e.g. to increase coverage of an approach by using information from similar words for unseen data, or to establish average similarity between a question and a potential answer.
Due to its importance, similarity measures have received steady attention in computational linguis-tics. There are two widely followed, but different, schools: taxonomy-based approaches and distri-butional, or corpus-based, approaches. Apart from a few exceptions, these approaches have mostly been studied separately.
Our main goal is to examine how the ap-proaches perform when identifying true similar-ity, in contrast to the more general relatedness, which also includes association, between word-pairs. We evaluate the approaches on the new gold-standard SimLex-999 (Hill et al., 2014b). We compare taxonomy-based approaches that use WordNet (Fellbaum, 1998) to the corpus-based approaches that performed best on SimLex-999 in
Hill et al. (2014a). We hypothesize that taxonomy-based approaches outperform corpus-taxonomy-based ap-proaches on a true similarity set, because corpus-based approaches tend to mix-up similarity and as-sociation.
We carry out several evaluations which investi-gate (i) the difference in performance on pure sim-ilarity sets and sets that combine simsim-ilarity and association, (ii) the influence of associative pairs while identifying true similarity, and (iii) various evaluation metrics that compare similarity mea-sures to the gold standard of SimLex-999.
We perform more than one evaluation metric for two reasons. First, different ranking coeffi-cients can lead to a completely different outcome when evaluating similarity scores (Fokkens et al., 2013). Second, we want to gain more insight into the differences between individual measures. To do so, we introduced two new, more flexible, eval-uation methods which reveal high results for all similarity measures. We argue that these new eval-uations provide a better insight into how suitable similarity measures are to be used in NLP tasks than the commonly used Spearman’s correlation (henceforth Spearmanρ).
Our results show that most of the evaluations confirm our hypothesis. The few cases where corpus-based methods outperformed taxonomy-based approaches reveal much smaller differences than the many cases where taxonomy-based ap-proaches have higher results. However, all sim-ilarity measures perform very well when they are evaluated on the relative ranking of word-pairs that are further apart in the gold-standard. We there-fore conclude that, even though taxonomy-based are better at identifying similarity than corpus-based approaches, this may not (always) matter.
The rest of this paper is structured as follows. In Section 2, we motivate our approach and ad-dress related work. Section 3 describes the sim-ilarity measures we investigate. In Section 4, we
outline our experimental methodology, including used datasets and evaluation methods. The results are presented in Section 5, and our conclusions and future work in Section 6.
2 Background and Motivation
Several gold-standards have been created that rank word-pairs based on their similarity. Agirre et al. (2009) point out that association and similarity are mixed up in these sets, where associated pairs such as coffee and cup rank higher than truly similar pairs such as car and train. The confusion di-rectly influences the performance of corpus-based approaches, which also tend to have difficulties distinguishing association from similarity (Hill et al., 2014a).
Hill et al. (2014b) introduce a new gold stan-dard dataset that is annotated with pure seman-tic similarity and larger than previously created similarity sets, such as Rubenstein and Goode-nough (1965) and Agirre et al. (2009)’s sets. Hill et al. (2014a) evaluate corpus-based approaches and show that they indeed have trouble identifying similarity, performing well-below the upperbound of agreement between human annotators.
It is not surprising that corpus-based approaches confuse similarity and association: semantically related words tend to occur close to each other and hence in similar contexts. Approaches that make use of a relatively narrow context window perform slightly better, because they can capture more sub-tle differences in context to some extend.
Taxonomies represent word meanings in hyper-nym and hypohyper-nym hierarchies, directly capturing their similarity. The closer two terms are in the hierarchy, the more similar they are. Similarity measures that make use of this structure are less likely to confuse whether two terms are similar or related in some other way.
These well-known properties of corpus-based and taxonomy-based approaches led to the follow-ing hypothesis:
Taxonomy-based approaches are better suited to identify similarity than corpus-based ap-proaches
Agirre et al. (2009) seem to contradict this hy-pothesis showing that corpus-based approaches can be as good at identifying similarity (when the right model is based on enough data). However, Hill et al. (2014b) point out that Agirre et al.’s
evaluation set does not form a representative set for measuring similarity, even after they made an alternative set that separates association and sim-ilarity. We therefore expected that the hypothesis would nevertheless hold on SimLex-999.
The outcome of our experiments confirmed our hypothesis, thus contradicting Agirre et al. (2009)’s results and being, to our knowledge, the first to show this on such a large and reliable benchmark. Banjade et al. (2015) also applies WordNet-based and corpus-based similarity mea-sures to SimLex-999, but do not examine or dis-cuss the difference between taxonomy-based ap-proaches and corpus-based apap-proaches in detail. Instead, they focus on the strength of combining several approaches to yield better results.1 We in-vestigate the difference between the approaches in various evaluations showing that taxonomy-based approaches outperform corpus-based approaches, a conclusion that cannot be drawn (clearly) from Banjade et al. (2015)’s results. It should be noted that our conclusions only apply to the task of iden-tifying pure similarity. Markert and Nissim (2005) show, for instance, that a corpus-based approach with sufficiently large corpus works better than WordNet for anaphora resolution.
The next step in our investigation was to de-termine the strengths and weaknesses of each ap-proach. The original idea was to investigate pairs that are ranked more or less correctly by one ap-proach, but are far off in the other to identify pat-terns of errors in each approach. We did not find such patterns, partially because the examples that have large differences in ranking compared to the gold are relatively rare.
We therefore developed two alternative evalua-tion methods that are less sensitive to minor dif-ferences in ranking. The first evaluation directly tests the comparison of pairs and, more impor-tantly, allows us to study the contribution of par-titions of the dataset. The second evaluation re-volves around thresholds for similarity. In this evaluation, we set thresholds to establish a binary distinction between highly similar pairs and other pairs. The pairs above the similarity threshold are compared to those falling above the threshold in the gold (see Section 4.2).
Many studies compare similarity measures (see Baroni et al. (2014) and Pedersen (2010), among
1We independently confirmed this result in our own
others) but, to our knowledge, Agirre et al. (2009) and Banjade et al. (2015) are the only ones that look at both taxonomy-based approaches and dis-tributional approaches. As mentioned above, they do not dive into the details of the differences be-tween the two. Furthermore, apart from Fokkens et al. (2013), who do not propose new rankings, we are not aware of studies applying multiple eval-uation metrics for similarity-based rankings.
3 Similarity Measures
This section describes the similarity measures compared in this paper.
3.1 Taxonomy-based Similarity Measures
WordNet (Fellbaum, 1998) organizes nouns and verbs in hierarchies of hypernym-hyponym rela-tions. We selected WordNet for our taxonomy-based experiments, because it is widely used and probably the most popular taxonomy when it comes to determining word similarity. Many mea-sures of similarity based on WordNet have been proposed over the years. Early work (Rada et al., 1989) advocates the use ofis-ahierarchy and later approaches continue to use it heavily. In order to make a clean comparison between WordNet and distributional models, we do not include in our study measures that make use of a corpus such as Resnik (1995) and Jiang and Conrath (1997).
Path length similaritytakes the inverse of the path length (i.e. the distance in number of nodes) froms1tos2plus one.
PL= 1
d(s1, s2) + 1
Wu and Palmer’s similarity(Wu and Palmer, 1994) takes the fact into account that senses deeper in the hierarchy tend to be more specific than those high up. It therefore incorporates the depth of the hierarchy in their similarity calculation:
WUP= 2depth(lcs)
d(s1, lcs) +d(s2, lcs) + 2depth(lcs) Leacock and Chodorows similarity (Lea-cock and Chodorow, 1998) normalizes path-based scores by the maximum depthDof the hierarchy. This corrects for the difference in the depth of verb and noun hierarchy:
LCH=−logd(s1, s2) + 1
2D
3.2 Distributional Semantic Models
We selected two representative models from the large and growing literature on corpus-based mod-els of lexical semantics: Word2vec (Mikolov et al., 2013, W2V) and dependency-based word embed-dings (Levy and Goldberg, 2014a,DEPS).
Word2vec is the first model to use a Skip-Gram with Negative Sampling (SGNN) algorithm for constructing semantic models and performed best on SimLex-999 in Hill et al. (2014a). Levy and Goldberg (2014b) argue that SGNN implicitly fac-torizes a shifted positive mutual information word-context matrix, not unlike traditional distributional semantic models. The use of a small window size and the weighting scheme that favors nearby contexts are supported by a systematic study of Kiela and Clark (2014) that shows the superior-ity of small windows. Moreover, Sahlgren (2006) presents empirical evidence that smaller windows lead to a cleaner distinction between syntagmatic and paradigmatic relations (which can be consid-ered the linguistic version of similarity and asso-ciation).
Levy and Goldberg (2014a) extend SGNN to work with arbitrary contexts and experiment with dependency structures. It is generally believed that dependency structures are better at capturing simi-larity (Pad´o and Lapata, 2007) although Kiela and Clark (2014) found mixed results.
The Skip-gram model captures the distribution p(c|t) of a context word c within a certain win-dow around a target wordt. For a vocabulary of millions, computing normalized probabilities (i.e. summing to one) for each example can be pro-hibitively expensive. Negative sampling was used to avoid the cost.
For each context-target pair (c, t) taken from training data, we replace the context by random words drawn from the vocabulary to obtain new pairs{(c0, t)}. We callD 3 (c, t) positive
distri-butionandN 3 (c0, t) negative distribution. The task of the model is to identify which pairs come fromD and which fromN. Formally. that is to maximize the negative log likelihood:
`=−Xlogp(D|c, t) +Xlogp(N|c0, t)
The probability is calculated using target em-beddings et ∈ Rd andcontext embeddings eˆc ∈
Rdsuch that:
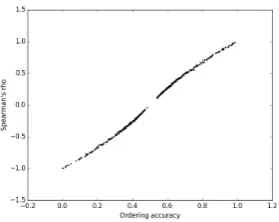
func-Figure 1: Ordering accuracy and Spearman’sρon a synthesized dataset of 100 word pairs.
Model SL-999nv MENnv WS-353
WUP 0.47 0.39 0.35
PL 0.52 0.39 0.30
LCH 0.55 0.39 0.31
W2V 0.42 0.77 0.70
DEPS 0.45 0.61 0.63
Table 1: Spearman’s correlation of models to sim-ilarity benchmarks.
The final evaluation measure is based on the ob-servation that many approaches use a threshold to determine which words are similar enough to be used for contributing features or approximations, or to be candidates for lexical substitution (Mc-Carthy and Navigli, 2009; Biran et al., 2011, e.g.).
Threshold accuracy sets a similarity threshold and determines how many of then-highest ranking word pairs in a given measurement are also in the top-n pairs of the gold standard. In other words, this evaluation determines whether the right word-pairs would end up above the threshold of being similar.
5 Results
We calculated the similarity scores of all noun and verb pairs in SimLex-999 (a set of 888 pairs), MEN (2,034 pairs), and all pairs in WordSim-353 using the measures outlined in Section 3 and ranked the word pairs according to the outcome.
5.1 Spearman’s Rank Correlation
Table 1 shows the performance of models on all three benchmarks. Taxonomy based approaches perform higher on SimLex-999, whereas corpus-based approaches reveal high performance on MEN and WordSim-353 and score significantly lower on SimLex-999. This result confirms
Model SL-999 SL-999 SL-999 Diff.
nv nv nv,assoc assoc
Using tie corrections
WUP 64.9 66.6 67.3 +0.7
PL 61.1 68.0 68.2 +0.2
LCH 65.1 69.2 69.1 -0.1
W2V 64.4 64.6 57.5 -7.1
DEPS 65.5 65.6 60.9 -4.7
Table 2: Ordering accuracy (percentage) of simi-larity measures on SimLex-999nv.
that taxonomy-based approaches capture similar-ity rather than association, whereas corpus-based approaches do not clearly distinguish the two.
5.2 Ordering Accuracy
Table 2 presents the evaluation of our metrics us-ing orderus-ing accuracy. The first column indicates the standard score. The scores in the second and third column are calculated while giving partial credits to ties. Note that this only affects the per-formance of taxonomy-based approaches, where it is common for word pairs to have identical scores. Without correction for ties, scores for taxonomy-based and corpus-based measures are highly similar, with the corpus-based DEPS leading to the highest results. Taxonomy-based approaches uniformly beat corpus-based ap-proaches again when we do correct for ties, confirming the outcome of our Spearman ρ evaluation.
We also evaluate on a subset of highly-associated words. The results are presented in column 3 of Table 2. Sizeable decrease is ob-served in corpus-based measures for highly asso-ciated terms while taxonomy-based measures re-main largely unaffected. This result confirms our hypothesis once more that taxonomy-based mea-sures are more suited to capture similarity and that corpus-based methods tend to have difficulties separating similarity from association.
5.3 Decomposition of Ordering Accuracy
sim-∆ = 0
pollution-president forget-learn take-leave succeed-try army-squad girl-child emotion-passion collect-save
sheep-lamb attention-awareness ∆ = 1
spoon-cup argue-differ remind-sell apple-candy
book-topic argument-agreement corporation-business kidney-organ alcohol-wine beach-island
Table 3: Is the pair in the left or in the right more similar? (All pairs are extracted from SimLex-999)
ilarity. This is illustrated by the sample pairs in Table 3. The fact that ranking such pairs is highly challenging for humans leads to the question how meaningful differences in performance of similar-ities measures on these pairs actually are.
To overcome this issue and gain deeper insight into how often low performance is the result of many small errors piling up and how often it is the result of a set of pairs being ranked completely wrongly, we apply our ordering accuracy to a de-composed dataset. We divide SimLex-999nv into
five equal similarity ranges{gi}based on
SimLex-999’s original ranges. The first rangeg1 contains
highly dissimilar pairs of words with a similarity between 0 and 2. Final set g5 contains very
sim-ilar or synonymous pairs with a simsim-ilarity from 8 to 10.
We use different granularity levels ∆ (∆ = 0, ...,4). Component accuracy is calculated by comparing each pair ingi to every pair ingj such
that|i−j|= ∆.
The results reported in Figure 2 show that all models perform consistently well on coarse-grained similarity while only marginally beating chance-level at the most fine-grained level. Fur-thermore, taxonomy-based approaches only out-perform corpus-based approaches when compar-ing pairs that are further apart in the gold rankcompar-ing. Because the two most fine-grained components (∆ = 0 and ∆ = 1) together have a weight of 58%, the ordering accuracy as reported in Table 2 is dominated by fine-grained similarity compar-ison. Spearman’s ρ highly correlates with order-ing accuracy, indicatorder-ing that fine-grained
differ-Figure 2: Ordering accuracy varies with degrees of granularity on SimLex-999nv. ∆ = 0 means
two pairs fall in the same range of similarity (e.g. 0-2);∆ = 1means they fall in neighboring ranges of similarity (e.g. 0-2 and 2-4), etc.
ences also had a major impact on previous work. It is questionable whether it is really necessary for these measures to capture the small differences in similarity that are even difficult for humans to find. This outcome shows that similarity measures per-form better than they seem to do according to re-cent evaluations in the literature.
5.4 Threshold Evaluation
The final evaluation we carry out is the so-called
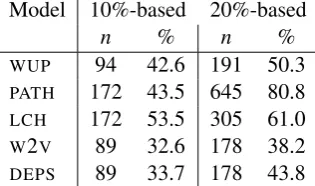
threshold evaluation. It evaluates how well a threshold performs that separates highly similar terms from less similar terms based on a specific score. We use the 10% and 20% most similar terms as a starting point. In a total set of 888 ex-amples, this means we compare the top 89 and top 178 pairs of each measurement’s output with the top pairs of the gold data. We report on the ac-curacy (i.e. percentage of pairs correctly classified as highly similar) of each scores. As mentioned above, taxonomy-based approaches often assign the same score to multiple pairs. If this was the case for the pairs around the threshold, we ex-tended the range of comparison as to include all pairs with an identical score. Table 4 provides an overview of the results.
The top-n sets increase significantly for taxonomy-based approaches. Because approaches tend to fare better when the size of the group changes, we calculated the scores for W2V and DEPSwith the top-nranks found in the taxonomy-based scores. Table 5 shows the results of this analysis. The scores of the relevant taxonomy-based approach are repeated in the third row.
Model 10%-based 20%-based
n % n %
WUP 94 42.6 191 50.3
PATH 172 43.5 645 80.8 LCH 172 53.5 305 61.0 W2V 89 32.6 178 38.2 DEPS 89 33.7 178 43.8
Table 4: Threshold based evaluation, comparing the set of top-nsimilar pairs
model n-value
94 172 191 305 645
W2V 33.0 38.4 39.8 48.5 82.0 DEPS 31.9 43.6 42.9 52.8 81.4 taxo. 42.6 43.5/53.5 50.3 61.0 80.8 Table 5: Scores of corpus-based methods on the n-values used for taxonomy-based scores.
variation than our other metric. In three out of twelve cases,3 the corpus-based approach leads to more accurate results than the taxonomy-based score. In combination with the outcome of the ac-curacy ordering result, this outcome underlines the importance of using a variety of evaluation met-rics.
Overall, the outcome seems to confirm that taxonomy-based approaches are better at identify-ing similarity. First, taxonomy-based approaches outperformed corpus-based approaches on identi-fying the most accurate pairs. Second, corpus-based approaches only beat taxonomy-corpus-based ones in few measures and with comparatively small margins (the largest difference being 1.2%, com-pared to differences up to 15.1%).
6 Discussion and Conclusions
This paper investigated the difference in perfor-mance of taxonomy-based approaches and corpus-based approaches on identifying similarity. The outcome of our experiments confirmed our hy-pothesis that taxonomy-based approaches are bet-ter at identifying similarity. This is mainly due to the fact that corpus-based approaches have diffi-culties distinguishing association from similarity, as also noted by Hill et al. (2014a).
We presented several results that confirm our hypothesis by (i) comparing performance of
3We compare eight corpus-based outcomes with one
tax-onomy score and two with two scores forn=172, leading to twelve comparisons in total.
taxonomy-based and corpus-based methods on a dataset designed to capture similarity, (ii) relating this to the results of the same measures on eval-uation sets that measure both association and re-latedness, and (iii) looking what the influence is of testing against a set that consists of associated terms.
The results show that taxonomy-based ap-proaches excel at identifying similarity whereas corpus-based approaches yield high results when similarity and association are not distinguished. Furthermore, taxonomy-based approaches are not influenced by association between words whereas performance of corpus-based measures drop when their task is to identify similarity.
We applied more than one evaluation to com-pare the models’ performance on SimLex-999. This was done for two reasons. First, different evaluation measures can sometimes lead to dif-ferent conclusions even if they are meant to ad-dress the same question on the same dataset. This also happened in our evaluation, where ordering accuracy without tie-correction and some thresh-olds led to different results. Second, the evalua-tion metrics revealed different aspects of the per-formance. Most notably, the results of our decom-posed ordering accuracy showed that all similarity measures are quite good in a coarse-grained set-ting.
Together with the mixed outcome of the threshold-evaluation, this shows that corpus-based approaches have good potential to be used when similarity needs to be detected. In particular, when taxonomy-based approaches run into coverage is-sues, they may be the preferred choice. We there-fore believe that it will ultimately depend on the application which approach works best. Future work will need to show whether and how these ap-proaches differ when used in actual applications.4
Acknowledgments
The research for this paper was supported by the Netherlands Organisation for Scientific Re-search (NWO) via the Spinoza-prize Vossen projects (SPI 30-673, 2014-2019) and the Bi-ographyNet project (Nr. 660.011.308), funded by the Netherlands eScience Center (http://
esciencecenter.nl/). We would like to
thank the anonymous reviewers for their feedback.
4All our code is published onhttps://bitbucket.
Sebastian Pad´o and Mirella Lapata. 2007. Dependency-based construction of semantic space models. Computational Linguistics, 33(2):161–199. Martha Palmer, Hoa Trang Dang, and Christiane Fellbaum. 2007. Making fine-grained and coarse-grained sense distinctions, both manually and automatically. Natural Language Engineering, 13(02):137–163.
Ted Pedersen. 2010. Information content measures of semantic similarity perform better without sense-tagged text. In Human Language Technologies: The 2010 Annual Conference of the North American Chapter of the Association for Computational Lin-guistics, pages 329–332. Association for Computa-tional Linguistics.
Taher Mohammad Pilehvar, David Jurgens, and Roberto Navigli. 2013. Align, disambiguate and walk: A unified approach for measuring semantic similarity. InProceedings of the 51st Annual Meet-ing of the Association for Computational LMeet-inguistics (Volume 1: Long Papers), pages 1341–1351. Asso-ciation for Computational Linguistics.
Roy Rada, Hafedh Mili, Ellen Bicknell, and Maria Blettner. 1989. Development and application of a metric on semantic nets. Systems, Man and Cyber-netics, IEEE Transactions on, 19(1):17–30, Jan. Philip Resnik. 1995. Using information content to
evaluate semantic similarity in a taxonomy. In Pro-ceedings of the 14th international joint conference on Artificial intelligence-Volume 1, pages 448–453. Morgan Kaufmann Publishers Inc.
Herbert Rubenstein and John B Goodenough. 1965. Contextual correlates of synonymy. Communica-tions of the ACM, 8(10):627–633.
Magnus Sahlgren. 2006. The word-space model: Us-ing distributional analysis to represent syntagmatic and paradigmatic relations between words in high-dimensional vector spaces.
Zhibiao Wu and Martha Palmer. 1994. Verbs seman-tics and lexical selection. InProceedings of the 32nd annual meeting on Association for Computational Linguistics, pages 133–138. Association for Com-putational Linguistics.