A Suite to Compile and Analyze an LSP Corpus
Rogelio Nazar, Jorge Vivaldi, Teresa Cabré
Institut Universitari de Lingüística AplicadaUniversitat Pompeu Fabra Pl. de la Mercè 10-12
08002 Barcelona
E-mail: {rogelio.nazar; jorge.vivaldi; teresa.cabre}@upf.edu
Abstract
This paper presents a series of tools for the extraction of specialized corpora from the web and its subsequent analysis mainly with statistical techniques. It is an integrated system of original as well as standard tools and has a modular conception that facilitates its re-integration on different systems. The first part of the paper describes the original techniques, which are devoted to the categorization of documents as relevant or irrelevant to the corpus under construction, considering relevant a specialized document of the selected technical domain. Evaluation figures are provided for the original part, but not for the second part involving the analysis of the corpus, which is composed of algorithms that are well known in the field of Natural Language Processing, such as Kwic search, measures of vocabulary richness, the sorting of n-grams by frequency of occurrence or by measures of statistical association, distribution or similarity.
1
Introduction
This paper presents a software that consists of an integrated set of tools for the acquisition of a specialized corpus from the web and its subsequent exploration by means of a collection of statistical techniques. Our aim was mainly terminology extraction, but we are aware of the fact that other users may find these techniques useful for other research interests.
The system is divided in two main modules. The first one is devoted to corpus compilation from the web with some facilities for the selection of documents of a given domain. The second module is organized in a series of algorithms used in natural language processing. Both modules are independent, which means that the corpus extracted with the first module is not necessarily the one that will serve as input for the second module. The program is currently implemented as a web application1, however new versions as a Perl Module and a cross-platform GUI application are about to be released.
2
The First Module: Extraction of a
Corpus from the Web.
Since it became massively used, linguists have become aware that the Internet is an invaluable source of data. Programs that simply download massive collections of documents are now common, but the result is usually a highly noisy corpus. “Bootcat” (Baroni & Bernardini, 2004) is a better choice because it accepts a set of seed words as input. In our particular case, however, we are interested in going further. Since our aim is the study of technical terminology, therefore we need a tool capable of gathering a high quality collection of specialized documents of a given domain.
1
The URL is http://jaguar.iula.upf.edu
2.1. The Algorithm.
The system proposed requires, as BootCat, a term or a collection of terms for starting the downloading process. However, there are different possibilities to train the system with feedback about the desired kind of documents. For instance, by providing or selecting terms or documents considered relevant or irrelevant, among other parameters such as the language or the format (html, pdf, doc, ps, etc.). According to our experience, the selection of the document format has a dramatic impact on the quality of the downloaded corpus. The probabilities of gathering a specialized corpus is much higher when downloading pdf or ps formats instead of html.
As mentioned above, based only on a single term, it can retrieve a collection of documents and perform an unsupervised classification to offer clusters to be selected as representative of the desired domain. After that, more documents will be retrieved and ranked according to their similarity with the selected cluster. The clustering is done by building co-occurrence networks with the best weighted terms as nodes. Nodes are weighted using Mutual Information, and a corpus of general language is taken as reference for the expectation of word frequencies. The weight of an edge between a node i and a node j (Wij) is log ( Fij / N ), where Fij is the frequency
We were enthusiastic with these models of coocurrence graphs because they work well as a disambiguation tool. For example, in another experiment we downloaded a sample of 100 documents with the term sudoku fever, that can have at least two meanings, one for a rat bite fever and the other for the popular game of numbers. Among those documents, only 4 where about the disease while the rest were about the game. The algorithm could identify the existence of both classes and assigned correctly three of the documents that used the term in the medical sense, leaving one without classification. After a while we realized, though, that from a practical point of view, in order to resolve such problems of ambiguity it is a better procedure to provide more input than just one term. Using instead groups of conceptually related terms as input renders a less noisy corpus. These graphs can be used precisely to obtain, given a single term, such a group of related terms. However this involves the supervision of a user who will accept or discard clusters of terms to reiterate the process.
The final classification of documents is, however, not the result of a single algorithm but a combination of d ifferent ones. One of them, for instance, ranks the documents according to their degree of specialization exploiting certain features that are typical from the scientific literature, namely their structure with a division into segments (like abstract, introduction, methods, results, and so on) and their system of bibliographic references, with the names of the authors and year of publication typically enclosed by parenthesis, the same names that are listed in alphabetical order in the final section of the document. This means that the criteria is not only terminological but also pragmatical.
The user can stop downloading documents when a curve that represents the rate of growth of the vocabulary size of the collection tends to zero. At this point the sample may be considered representative from the point of view of the vocabulary.
2.2. The Evaluation.
We conducted preliminary evaluation only on the first module because it contains original algorithms while the second is mostly composed of well-known techniques. The evaluation consisted of five experiments where we provided one term (randomly selected from a database of around 4,000 diseases) and the system attempted to download 100 pdf documents for each term, ranking the documents according to a final score that represents its degree of relevance. Documents that receive a score
below a certain threshold are considered irrelevant. Figure 2 shows the ranking of documents (horizontal axis) for the term Spastic Diplegia. We can see that the first 50% of the ranking contains relevant documents and from that point the cumulative precision (vertical axis) begins to decay, indicating a satisfactory binary classification. We considered as valid documents only scientific papers or PhD dissertations on the given domain and not congress programs, presentation slides, press articles, outreach, institutional, educational or other non-specialized texts.
Table 1 shows the results for the selected five terms. For those documents tagged as relevant, precision is defined as the proportion of correct decisions, while recall is the proportion of relevant documents that where tagged as such2 considering the total number of relevant documents that where downloaded for that term.
As reference for statistical significance, figure 3 shows the theoretical probability distribution of the precision as a random variable, showing the performance of 10,000 random classifiers on the same data. Our average precision (83,75%) is outside the area below the curve that indicates the normal probability (60%-70%). The probability of having such an outcome by chance is very low (0.003%, determined by Binomial Test).
2
The results should not be compared to state of the art supervised text categorization because this is a different scenario.
Figure 1: Example of a network showing two hubs, one for each sense of Broca.
sense
Figure 2: Cumulative precision in the ranking of documents with Spastic Diplegia
Term: Documents: Precision: Recall: Spastic Diplegia 67 88,46% 92,00% Giant Cell Aortitis 21 92,85% 81,25% DNA Virus Infections 50 79,31% 74,19% Meige Syndrome 76 73,07% 90,47% Down Syndrome 76 85,10% 92,15% Average: 83,75% 86,01%
Table 1: Precision and Recall for the experiments.
3
Second Module: Exploration of the
Corpus with Statistical Techniques.
Some of the most well known tools to measure statistical association between words are NSP (Banerjee & Pedersen, 2003) for sorting n-grmas; UCS (Evert, 2004) for collocation extraction; the Sketch Engine (Kilgarriff, 2004) for different uses including the comparison of words by their profile of cooccurrence and T-LAB (Lancia, 2007) with utilities such as co-occurrence analysis and document or word clustering. However, none of the above mentioned covers completely the range of functionalities our suite does. For an overall introduction to most of the techniques used here, Manning & Schütze's manual (1999) remains as a valid source.Leaving aside the typical set of functions like Kwic extraction or the ranking of n-grams, the second module includes some other functions like the ranking of cooccurrences by different measures of statistical association, the ranking of terms on the base of their distribution in documents or in a collection of documents, and finally a set of similarity coefficients that are used for the comparison of strings of text like terms or documents or any kind of object that can be represented as a vector.
3.1. Automatic Language Recognition.
This process is accomplished by vector comparison with models of nine languages that the program has incorporated from corpora of general language (downloaded from Quasthoff et al, 2006). It is a particular instance of document categorization. Each language is represented as a vector of its function words (the 100 more frequent words in those corpora) and each document is assigned the language that has the grater overlap. Except in cases of mixed languages, or when the document is too short or written in a language that is unknown to the program, our experiments show correct categorization with more than 90% probability. This can be useful for example to filter out documents that are not from the language we are interested in.
3.2. Measures of Vocabulary Richness.
There are several indexes to measure vocabulary richness, but in essence they all study the type/token ratio. In this case we use Herdan's (1964) index because it is claimed to be independent from the size of the sample. The formula is: log(types)/log(tokens).
3.3. Analysis of Sample Representativeness.
As a measure of sample representativeness we use the curve that represents the vocabulary size. It is supposed that when a corpus is representative of the terminology of a domain, few new words are encountered as new documents are included in the corpus. Thus, the curve that represents the rate of grow of the vocabulary size tends to zero, as stated in 2.1.
3.4. Kwic.
This is the typical extraction of contexts of occurrence of a certain term or a group of terms in a corpus. The contexts may consist of a sentence or a parameterizable number of words at each side of the term.
3. 5. N-grams Extractio n and Sorting.
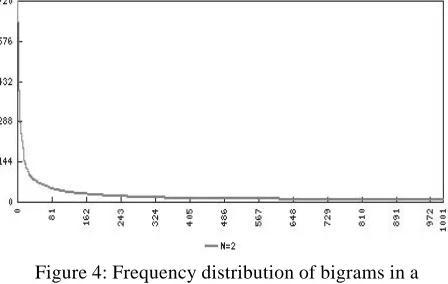
This function extracts sequences of N words from a corpus and sorts them by alphabetical or frequency order. This is a simple way to extract words that tend to appear together. Such listing can be also filtered with stoplists or only-these-words lists. Figure 4 shows the typical skewed distribution of frequencies of bigrams in a corpus. The vertical axis shows the frequencies and the horizontal shows the rank.
3. 6. Sorting Collocates by Variance.
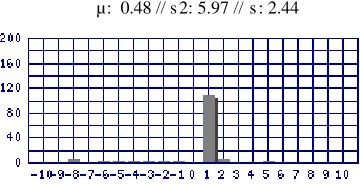
Providing a word as input, this submodule outputs histograms that characterize the collocational behavior of that lexical unit. Analyzing, for example, the verb
contraer (to contract) in a Spanish corpus, we can see what the typical things that it is possible to contract are:
matrimonio (marriage), obligación (obligation),
enfermedad (disease) among others.
In the histogram shown in Figure 5, the verb contraer
occupies position number 0, and at left and right, the bars indicate how frequent the occurrence of the collocate we are analyzing in each position is. In this case, the mode, that is the most frequent position, is 1.
Figure 3: Probability distribution of precision as a random variable.
Word: matrimonio // Frequency: 103 // Mode: 1 µ: 0.48 // s 2: 5.97 // s : 2.44
Example:...Alfons Almirall Sardá y Dª María Rovira Roig contrajeron matrimonio el 13 de septiembre de 1939 y tuvieron... Figure 5: Histogram for “contraer” and “matrimonio”.
3. 7. Measures of Association.
Other ways of testing the significance of a cooccurrence is using measures of association. In a way, this subsection is similar to n-grams (3.5.) because it offers listings of n-grams; however the difference lies in that now the sorting is based on a score given by a statistical measure, which is of greater significance than simple frequency of co-occurrence. The first two measures currently supported are widely used in statistics as a means for hypothesis testing.
t-score:
The symbols
x
,µ
,s²
and N represent, respectively, the mean of the sample; the mean of the theoretical distribution; the variance of the sample and the size of the sample.chi-square:
The chi-square measure is bas ed on 2 x 2 contingency tables and the symbols Oij and Eij represent the observed
and expected value respectively on every cell ij of the table. The four positions of the table represent the frequency of occurrence of two lexical items together; the two frequencies of one without the other and finally the number of cases where none of them occur.
Another measure, Mutual Information, has became also popular among linguists since it was promoted by Church & Hanks (1991).
Mutual Information:
Where P(xy) represents the probability of coccurrence of lexical items x and y while P(x) and P(y) represent the probability of their independent occurrence.
Cubic Mutual Information:
This latter measure (first reported in Daille, 1994) is similar to the previous one but with the numerator raised to the power of 3. While the previous has the tendency to highlight the most rare words, this other one makes up for that tendency.
These calculations can be parameterized with the use of a general language reference corpus that will inform the normal expectation of word frequencies. Figure 6 shows a screenshot of the Web version of the program sorting bigrams by MI from a Spanish Genome corpus.
3.8. Models of Term Distribution.
Besides their frequency, the way in which terms are distributed along a document or a document collection is also useful to infer some intrinsic properties of those terms. A term that only appears at the beginning of a text, for instance, is possibly not as important as one that is more regularly distributed. However, non-informative terms can be regularly distributed across a document as well, then the weighting should also consider their distribution across a collection of documents. Figure 7 shows an output of this program where the vertical axis is the relative frequency of occurrence and the horizontal axis shows the documents, in this case with no particular order, however, documents are sorted by default in ascending order according to their names. We have made, for instance, interesting diachronic studies with this tool assigning years to the names of documents.
Figure 7: Distribution of a term in a collection of documents.
N
s
µ
x
=
t
2
−
(
)
∑
−
ij ij ij
E
E
O
=
X
2²
( )
( ) ( )
( )
y
P
x
P
xy
P
=
y
x,
I
log
2³
Figure 6: Bigrams sorted by MI score
( )
( ) ( )
( )
y
P
x
P
xy
P
=
y
x,
tool has been conceived in a modular way, therefore, it will be enhanced with new functions and algorithms as necessary to satisfy the requirements of our Institute. Currently, the program can be freely accessed from the web but we plan to turn it into a desktop application in order not to overload the server.
5
Acknowledgments
The authors would like to thank the anonymous reviewers for their valuable comments. This paper was possible thanks to the ADQUA scholarship granted to the first author by the Government of Catalonia, Spain, according to the resolution UNI/772/ 2003.
6
References
Baroni, M. & Bernardini, S. (2004). BootCaT: Bootstrapping corpora and terms from the web.
Proceedings of LREC 2004, Lisbon: ELDA. pp. 1313-1316.
Banerjee, S. & Pedersen, T. (2003). The Design, Implementation, and Use of the Ngram Statistics Package. In Proceedings of the Fourth International Conference on Intelligent Text Processing and Computational Linguistics, February 17-21, 2003, Mexico City.
Church, K., & Hanks, P. (1991). Word Association Norms, Mutual Information and Lexicography, Computational Linguistics, Vol 16:1, pp. 22-29. Daille, B. (1994). Approche mixte pour l'extraction
automatique de terminologie: statistiques lexicales et filtres linguistiques. Thèse de Doctorat en Informatique Fondamentale. Université Paris 7. 1994. Evert, S. (2004). The Statistics of Word Coocurrences;
PhD Thesis; IMS; University of Stuttgart.
Herdan, G. (1964). Quantitative Linguistics. Washington, Butterworths.
Juilland, A. & Chang-Rodríguez, E. (1964). Frequency Dictionary of Spanish Words. The Hague: Mouton. Kilgarriff, A. (2004). The Sketch Engine. In Proceedings
of Euralex, pp. 105–116.
Lancia F. (2007). Word Co-occurrence and Similarity in Meaning. In Salvatore S., Valsiner J. (eds.), Mind as Infinite Dimensionality, Roma, Ed. Carlo Amore (forthcoming, 2008).
Manning, C. & Schütze, H. (1999). Foundations of Statistical Natural Language Processing. MIT Press. Sparck Jones, K. (1972). A statistical interpretation of
term specificity and its application in retrieval. Journal of Documentation, 28 (1), pp. 11-21.