Cell proliferation in the attainment of constant sizes
and shapes: the Entelechia model
ANTONIO C. GARCÍA-BELLIDO and ANTONIO GARCÍA-BELLIDO*
Centro de Biología Molecular Severo Ochoa, C.S.I.C. and Universidad Autónoma de Madrid, Madrid, Spain
ABSTRACT The Entelechia model is a generative model of morphogenesis where individual cells exhibit surface labels that express scalar difference and planar polarity along two orthogonal axes X and Y. The amount of surface label depends on the level of Martial (M) gene product within each cell. The model assumes that the confrontation of cells on both sides of compartment borders causes an increase in their level of M gene expression. The resulting disparity between the M value of border cells and that of their neighbors induces the latter to divide. After each division the daughter cells increase their own M value, and allocate to the best matching value position. The increase in M value at the borders therefore extends through the anlage in a cascade of proliferation. The Entelechia condition is reached when the border cells attain the species-specific maximal M values, and the value differences between adjacent cells become indistinguishable. Computer simulations reveal that this model accounts for a variety of observations made on imaginal discs, e.g., 1) each disc attains a constant size in terms of number of cells, independently of the growing conditions; 2) clonal restrictions separate populations of cells which proliferate by intercalar growth; 3) dissociated cells are capable of reconstructing original patterns upon reaggregation, and 4) genetic mosaics of morphogenetic mutations show local effects that may differ depending on the position of the mutant cells in the growing anlage.
KEY WORDS:
pattern formation, growth control, clonal analysis, compartment borders
0214-6282/97/$10.00
© UBC Press Printed in Spain
*Address for reprints: Centro de Biología Molecular Severo Ochoa, C.S.I.C. and Universidad Autónoma de Madrid, Cantoblanco, 28049 Madrid, Spain. FAX:
34-1-397-4799. e-mail: AGBELLIDO@TRASTO.CBM.UAM.ES
Introduction
Morphogenesis, the attainment by developing organs of a constant size and shape, is associated with the interaction of two different processes, growth and pattern formation. The former is usually related to cell proliferation, the latter to spatial cell differen-tiation. So far, major experimental attention has been paid to understanding cell differentiation. We are starting to have an increasingly clearer picture of the role of cell-cell signaling, signal transduction pathways and transcriptional control in the differentia-tion of many different types of cells. Less understood are the processes leading to the patterned distribution of different cell types in space and in particular the relation of patterned cell differentiation to cell proliferation.
Ordered cell proliferation is obviously related to cell division, which is becoming well understood in molecular genetic terms. But how cell proliferation leads to the generation of morphogenetic space of constant species-specific dimensions is unknown. And yet this is the classical question of how organisms attain their completion or, in Aristotle’s terms, their Entelechia. In this paper we present a formal model, the “Entelechia model”, of how cells, through proliferation and cell-cell communication generate
mor-phological space of finite size and eventually shape. To that end, we shall make use of data of how cells of the wing disc of Drosophila proliferate and behave under normal and experimental conditions.
Current views about pattern formation
There are two classical models currently dealing with patterned cell differentiation. In both models, individual cells acquire their specification (cell differentiation) from the system where they grow, i.e., they respond to an already grown or organized primordium.
In the first model, the structure of the primordium can be that of a morphogenetic field, as in the “prepattern” theory of C. Stern (1954). These fields are defined by centers, outwards from which the intensity of a signal (translated into “positional values”) de-creases, and to which cells respond, or not, depending on their genetic state. The positional values are in this model scalar values communicated between neighboring cells acting as relays. Fields expand from initial centers (maximal concentration of signals) and can be split into subfields.
proved to be very elusive, because in the dualism of prepattern and response to it, all known mutations turned out to affect only the latter. In genetic mosaics, mutant cells in a wildtype background cell-autonomously differentiate the mutant phenotype without af-fecting the surrounding ones [e.g., lack of chaetae in certain positions in scute mutations (García-Bellido and Santamaría, 1978, García-Bellido, 1979) or growth of homeotic tissue in bithorax mutations (Morata and García-Bellido, 1976]. These results are interpreted as failures to respond to an invariant prepattern. Only very recently have genes operationally involved in these prepatterns been described (see below and discussion).
The second model, that of “positional information”, states that cells differentiate according to their positional values, defined there as the concentration of a diffusible signal (morphogen or other) starting from a source and monotonically decreasing to a sink (Wolpert, 1969,1971). Cells would respond to these signals inde-pendently of each other and differentiate various cell types or states depending on the distance from source and sink, thus formally ensuring pattern size invariance.
This model was first used to successfully explain epimorphic regeneration in hydra. It is now extended to explain patterning in other developing systems, such as early segmentation in the syncytial eggs of insects. Related models have been proposed to deal with epimorphic regeneration in appendages, like the “clock” (polar coordinates) model (French, et al., 1976) which contem-plates positional values along a proximo distal and a circular axis of reference. The discovery of clonal restriction boundaries in imaginal discs of Drosophila allows for the assignment of sources of signals to concrete entities in the developing organ. Several putative morphogens have been molecularly characterized (Law-rence and Struhl, 1996; Gómez-Skarmeta et al., 1996). Again, this
model attempts to explain the patterning of cell differentiation in an already grown organ. These models hardly deal with the problem of growth, with the definition of the dimensions of the sources (because they rely on size invariance), with the acquisition of species specific final shapes and sizes, and with local pattern “accommodation” found in genetic mosaics (see below and discus-sion).
Both models invoke global supracellular properties impinging on individual cells, i.e., are systemic models. By contrast, the Entelechia model presented here relates to cell behavior (reflect-ing active genomes) and cell communication. Here the properties of the system result from the local properties of cells adding up to the whole. It aims, in the end, at understanding the mechanisms of the genetic control of size and shape via ordered cell proliferation, and to explain the attainment of species specific forms.
Parameters of growth of the wing disc
The wing disc of Drosophila is the best characterized imaginal disc in terms of its cell proliferation parameters. The wing disc singularizes as a primordium of about 30 epidermal cells in the second thoracic segment of the embryo. At that time it is already clonally subdivided into two developmental compartments, an anterior (A) and a posterior (P) one. The primordium invaginates into the lumen of the embryo and after a quiescent period starts a cell division regime at the end of the first instar larval stage. Following cell proliferation new clonal restrictions separate dorsal from ventral, and proximal (notum/pleura) from distal (wing proper) compartments. At the end of the second instar, clonal restrictions begin to define the presumptive veins, and proliferation becomes restricted within intervein sectors. The wing disc evaginates at
Fig. 1. The Entelechia model for the wing. (A)
Upper panel, the generative gradients correspond-ing to the Entelechia condition for compartments (E1) and for vein sectors (E2) in either the dorsal or
the ventral surface of the wing. Note that the slopes need not to be the same for each vein sector, as they may depend on local variations of the incre-mental value for E. A, anterior; P, posterior; D, dorsal; V, ventral. Lower panel: A/P section of the adult wing with the dorsal and ventral epithelia indicating the longitudinal veins (L2-6) and the wing margins (Co, costa; pwm, posterior wing margin).
(B) Two stages of the growth in which the increas-ing amount of M gene expression (ordinate: ampli-tude value of martial genes and their ligands) is correlated with position (numbers correspond to positional values). (C) The components of the Entelechia model, showing how cell communica-tion controls cell division. The activated form of the receptors may be associated to specific adhesion molecules, not shown in the figure. The cell will enter CD, cell differentiation, or CP, cell prolifera-tion, depending on the balance between M (martial) gene expression and M gene titration by the acti-vated receptors. Bottom, a row of cells with differ-ent amounts of activated receptors, illustrating how the distribution of activated receptors polarizes each cell. (D) Gradients of scalar positional values and scalar discontinuities in the X and Y axes of the epithelium. Cell division (arrows) is elicited whenever discontinuities are above the threshold for M disparity detection, and primarily at the position where there is a disparity in both X and Y axes.
pupation, and after one more round of cell divisions, at about 30 h of pupal development, cuticular differentiation is initiated. (García-Bellido and de Celis, 1992)
Cell proliferation is intercalar throughout the growth phase, with an average rhythm of 8.5 h. The grown disc contains about 50,000 adult cells. This final number remains constant, independent of disc growing conditions (García-Bellido, 1965). Certainly adult wings can be smaller (in terms of cell numbers) under restrictive nutritional conditions, but then they differentiate less than normal numbers of pattern elements such as chaetae (García-Bellido, 1972), i.e., their pattern is not size invariant.
Specific precedents indicating local control of cell
pro-liferation
During the proliferative phase of the wing disc, the cells divide synchronically in clusters of a few non-clonally related cells. Mitotic orientation in these clusters is at random but the daughter cells subsequently allocate preferentially along the proximo-distal axis of the prospective wing (Milan, et al., 1997). This postmitotic allocation is reminiscent of the capability of dissociated cells from mature imaginal discs to partially reconstruct patterned territories in mosaics, thanks to positional labels and polarities of the disso-ciated cells (García-Bellido, 1966).
Genetic mosaics have shown large local autonomy in cell proliferation. Thus wild type cells in a Minute background, growing faster, give rise to larger than normal clones, but allow the construc-tion of an otherwise normally sized and patterned wing (Morata and Ripoll, 1975). M/+ cells, which can give rise to whole organisms, fail to live in clones in a +/+ background because they cannot compete with the pace of proliferation of the surrounding, normally growing cells. This competitive behavior reveals that +/+ cells make the developmental decisions of dividing and generating morphoge-netic space earlier than M/+ cells (Simpson and Morata, 1981). Haploid cells (Santamaría and Gans, 1980, Santamaría, 1983) or cells harboring mutations that make them smaller (Diaz-Benjumea and García-Bellido, 1990), will however make patterns that are normally spaced in terms of cell numbers. Mosaics of these cells and normal cells show repetition of pattern elements along the mosaic border. Reciprocally, mosaics of larger than normal cells cause normally patterned outgrowths (Ferrus and García-Bellido, 1976; Held, 1979). Both results indicate that cells compute pattern distances in term of cell numbers, rather than responding to physical distances as postulated for morphogens.
Local autonomy in pattern formation is also shown by the offspring of isolated cells grown in a “feeder layer”; they form normally patterned territories that are fractions of the whole pat-tern. (García-Bellido and Nöthiger, 1976)
Genetic mosaics of extramacrochaete (emc) mutations that cause changes in cell differentiation to vein or intervein histotypes show differential cell behavior, their clones proliferating towards or away from veins, revealing local autonomy related to final positions of cells in the pattern (García-Alonso and García-Bellido, 1988; García-Bellido et al., 1994; de Celis et al., 1995). Mosaics of mutations such as vein (vn) or nubbin (nub), which cause reduced wings, also show local autonomy, causing reduced or absent vein sectors and consequently an “accommodation” of the remaining wing to match in size the mutant territory (García-Bellido et al., 1994; Cifuentes and García-Bellido, 1997).
Reciprocally, clonal ectopic expression of genes involved in the generation of compartment boundaries can, when present in the middle of compartments, cause duplication of wing territories in order to maintain the continuity of positional values of engrailed (en) and hedgehog (hh) (Basler and Struhl, 1994; Tabata et al., 1995; Zecca et al., 1995). These local effects depend on the position of the clones (far from or close to the compartment border), irrespective of clone size (i.e., of the size of the source). Accommodation in cell proliferation dynamics also follows apoptosis induced in given compartments or wing regions (Milan et al., 1997). In all of these cases accommodating cell proliferation also affects cells of adjacent compartments, indicating that prolif-eration in the proximo-distal and anterior-posterior axes are interdependent variables.
The entelechia model
Intercalar cell proliferation occurs within territories defined by clonal restriction boundaries. At the beginning of wing disc growth, cell proliferation takes place on both sides of the anterior/posterior (A/P) compartment boundary. This boundary is both an axis of symmetry and a reference for cell proliferation on both sides of it. The establishment of the dorso/ventral (D/V) clonal restriction
boundary, after the disc has reached a given size in terms of cell numbers, generates a new axis of symmetry. From now on, these two boundaries become references for growth along two axes, anterior-posterior and proximo-distal, and subdivide the anlage symmetrically into four compartments. The model proposes that signals deriving from the confrontation of cell types across com-partment boundaries elicit cell proliferation, and that intercalar cell division is triggered by signals deriving from the surrounding cells. In the model, cells are assumed to have scalar values corre-sponding to their distance from the compartment borders, in addition to their specification by compartment selector genes (engrailed for posterior and apterous for dorsal). These scalar values are different for the two axes, X (for the anterior-posterior axis) and Y (for the proximo-distal one, which in the case of the wing sectors is the same as the dorso-ventral axis); they are highest in the cells forming the borders and lowest in the cells farthest away from them. In addition, these values are represented as cell recognition features (ligands and receptors, or adhesion mol-ecules associated to the receptors). These recognition molmol-ecules are in principle symmetrically distributed in the cell membrane but become later asymmetrically active (Fig. 1D). Thus, according to the model, growing cells have not only recognition features control-led by selector genes, but also positional, scalar, values and polarities.
The essence of the model is that on both sides of compartment boundaries, exchange of signals between cells in the opposite compartments leads to the activation of nuclear genes (herewith called “martial”, M), one for each axis. Thus cells closer to the border have higher M values than those away from it. Martial genes activate specific ligands in amounts proportional to their own scalar
value. These ligands consequently activate the apposed receptors of neighboring cells. Ligands are limiting in amount, but receptors need not be. Although receptors and ligands are homogeneously distributed in the cell membrane, activated receptors will be asym-metrically distributed, being more abundant on the surface closer to the border than on the opposite one. Cells will therefore be polarized.
Each cell sums up the input of ligands from neighboring cells in the form of activated receptors, and enters cell division when the amount of activated receptors titrates the products of the corre-sponding martial gene down to a level which fails to maintain repression of the cell division machinery. Thus a cell will be pushed into division whenever one of its martial values (either X or Y) is lower than that of its neighbors.
Following cell division, the daughter cells increase their martial values (by positive feedback of the M products on their rate of transcription) to match those of their neighbors. Thus, signals starting at the restriction borders elicit waves of cell divisions away from them. The system for comparing the M value of a cell to that of its neighbors (M disparity detection) has a threshold of sensitiv-ity, called "increment value" in the model. This threshold, which reflects the efficiency in receiving and transducing the signals that titrate the martial gene products, determines the sensitivity of cells to differences of M values with neighboring cells. Cell division will continue in the primordium until border cells have reached maximal martial values (maximal M gene expression) while the differences between cells are below threshold. The compartment has then reached the Entelechia condition.
Cell proliferation in the disc uses borders of clonal restrictions as references. The wing proper has, in addition to the four
Fig. 3. Dissociation and reaggregation of cells dissociated from discs that had attained the Entelechia condition.(A) Random arrangement of cells following dissociation of a territory as in Figure 2. Dorsal and ventral cells, border and internal cells carrying their membrane labels are intermixed. (B)
compartments mentioned above, sectors or intervein regions, separated by clonal restrictions running along the veins (González-Gaitán et al., 1994). The model assumes that the same system of positional allocation is at the basis of the successive entelechia condition for smaller and smaller developmental subunits, start-ing from parasegments and endstart-ing (provisionally) with intervein regions. At each subdivision, new M genes may enter into function, or the same M gene may be used again in a new context. The model postulates that the process of ordered cell proliferation leading to the final wing is the same as that which occurs in the compartments of the early disc, but leads now to a final size and shape.
In this process, the spatial allocation of post-mitotic cells as seen in vivo (Milán et al., 1996b), using the mechanisms revealed in dissociation/reaggregation experiments (García-Bellido, 1966), is crucial. We suggest that the activated receptors themselves, or associated adhesion molecules different in the two axes, asym-metrically label the cell surface with orientations orthogonal to each other. After cell division, which is at random in the planar axes of the epithelium, one of the daughter cells retains its martial value and position while the other, with intermediate martial values, allocates to a position best matching in values with those of neighboring cells. Occasionally a daughter cell might have identi-cal values to those of one of the surrounding cells; those are assumed to enter apoptosis. The elongated shape of the wing then results from preferential allocation of postmitotic cells in the proximo-distal axis, perhaps because differences in positional values are smaller along that axis than along the antero-posterior axis in vein sectors.
Simultaneous discontinuities in martial values along the two axes, X and Y, may lead to larger clusters of mitotic cells, as observed in vivo (Milán et al., 1996a; Fig. 1D). Cell proliferation in the anlage ends when the Entelechia condition is reached across the vein sectors (X axis) and along the proximo-distal (Y) axis are completed, and all the positional values are therefore filled (Fig. 2).
Algorithms used in the computer simulation
We use a window of wing morphological space including the dorsal and ventral surfaces of an intervein sector (Fig. 2). The cells have both a selector label and a positional label. The latter distinguishes two parameters, corresponding to the two axes of computation, X and Y. The values in these axes are, for conven-ience, graded in intervals of ten. We represent cells as circles in the figures, although their outlines are hexagonal in the disc epithelia. The two martial values (X,Y) are represented as vectors, the size of which indicates the amount of M value, while the direction reflects cell polarities corresponding to the differential distribution of adhesor/receptors in their membranes. The polarity reflects, in the X axis, anterior vs. posterior, and in the Y axis, dorsal vs. ventral. The M value being maximal at the two borders, there is an inversion of polarity in the middle of the sectors, resulting in a symmetry line separating cells with opposite polarities at both sides of it (Fig. 2).
Cells respond with mitosis when either of the two axial signals arising from neighbor cells surpasses by 20% of the maximal M value any of its own martial values. Ensuing cell division is oriented at random. One of the daughter cells retains its martial value and position while the other computes the martial values of neighboring cells and increase its own value to average those of neighbors. The second cell which now has assumed intermediate martial values, moves to a position best matching in values with those of neighboring cells. If both X and Y values are identical to those of a neighbor cell, one of the two cells dies by apoptosis. For convenience every round or wave of divisions is initiated by an increase of 20% in martial value of the cells at either restriction border (X or Y). Cycles, or generations of cell divisions are discontinuous in the simulation (our computer lacks parallel multiprocessors), unlike the process in vivo where several divisions may occur in different places of the same sector at the same time. For convenience we have set the maximal martial value (maximal M gene expression) to 50 in each axis, and the increment value (threshold of M disparity detection) to 10.
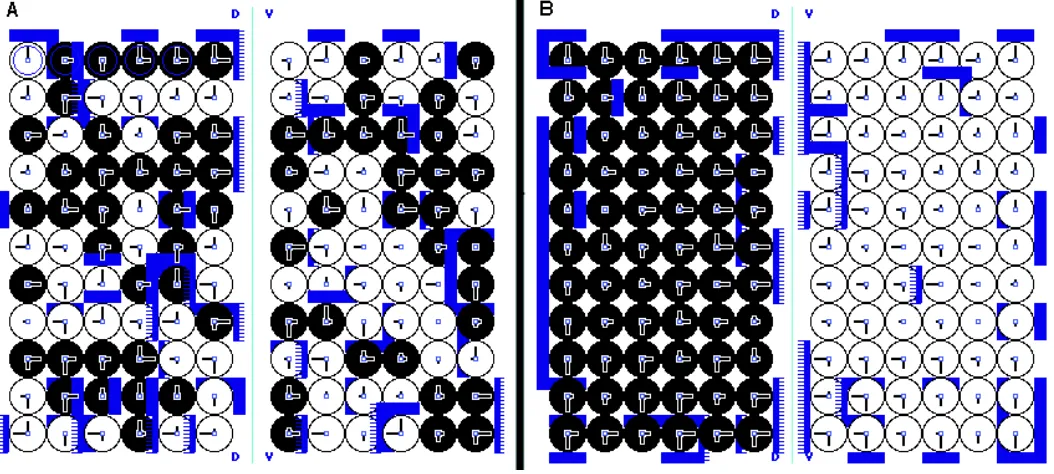
Cell sorting out and pattern reconstruction
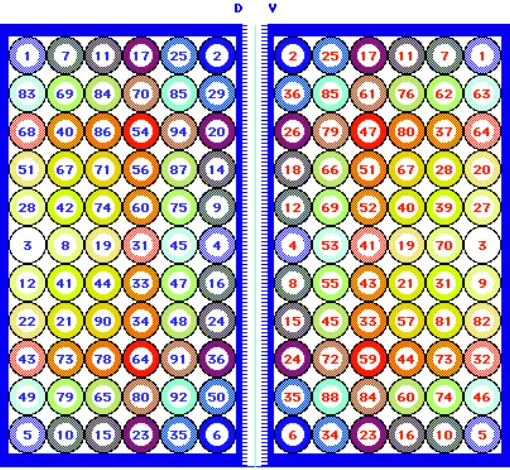
In Figure 2 we represent the cells of a wing sector with the two dorsal and ventral aspects in the final Entelechia condition. In experiments of cell dissociation and reaggregation individual cells from different compartments sort out. However, cells of the same region of the disc are capable of reconstructing local patterns, recognizable by characteristic cuticular elements, such as chaetae or veins (García-Bellido, 1966,1972). These recon-structed patterns correspond to small regions of the complete pattern, an indication that in sorting out, cells first reaggregate by region and undergo finer allocation later. In this process of cell allocation, cell adhesion asymmetries in the cell membrane (both in the X and in the Y planar axes) play a major role. This leads to matching of cells not only with respect to position but also to polarity, because of the associated cell asymmetries (García-Bellido, 1966). We have modeled these processes by reaggregating dissociated cells of the final anlage (i.e., as in Fig. 2) in two steps. In the first step, cells sort out using the selector (dorsal vs. ventral) label (Fig. 3A). In a second step we allow cells with very different positional labels to sort out, in groups of similar values and then to allocate to final position by swapping places (martial values and polarity) with next neighbors. At the end of the process (Fig. 3B) groups of cells appear associated in clusters of matching values, but as expected from the experimental data the reaggregates show partial pattern reconstruction rather than the complete Entelechia condition. From here on, intercalar regen-eration may follow driven on by the confrontation of cells with different positional values (not shown, but see below; García-Bellido, 1972).
Cell proliferation to the entelechia condition
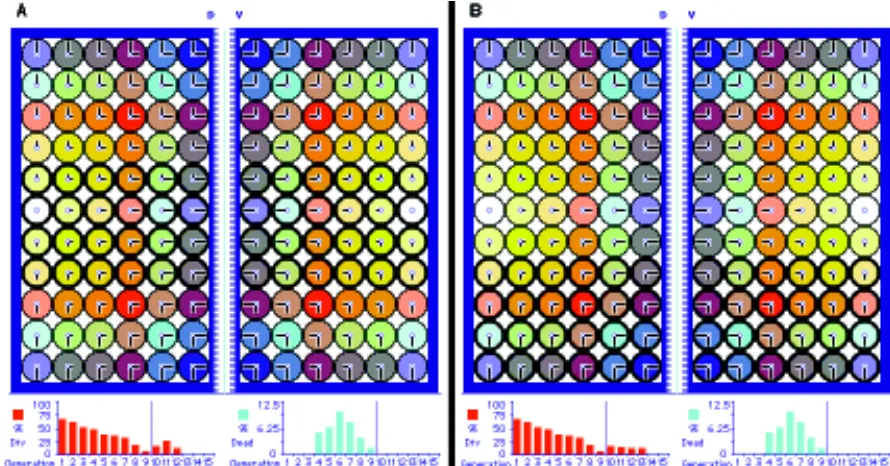
In Figure 4A, we present the starting condition of the growing anlage primordium with 6 cells on either side of the D/V restriction border. After 10 computer cycles of cell division the primordium reaches the Entelechia condition (Fig. 4C). The end result is
obviously the same in different runs of simulation, but differences appear between runs because the various steps are resolved by random decisions (Figs. 2,4,5 and 7). Thus the number of cell divisions, expressed as percentage of dividing cells, varies in each cycle, in part as an artifact of the computer simulation. However this percentage is more or less constant in the first cycles and de-creases in the last ones (Fig. 4B), as occurs in vivo (Milán et al., 1996a,b). Cell death varies in different runs of simulation but
Fig. 5. (A,B) Examples of twin clones initiated in the same position in the second generation of cells. (Offspring of grandmother cells in twin clones: yellow and red, blue and cyan). Notice split clones, clones cross-ing the A/P symmetry line within the sector, and clones of different sizes in terms of cell numbers.
ranges between 5-10% cells per cycle, similar to the rates ob-served in vivo (2% of cells).
If we label the progeny of early cells in a simulation of clonal analysis (Fig. 5A,B), we observe a large variety of clone sizes and shapes for twin clones initiated in one of the 12 cells of Figure 4A. This is similar to the experimental observations. Clones appear compact and may cross the symmetry line within the sectors, again as in vivo, but not the D/V boundary. Cells along the restriction borders have exclusive clonal relationships, as we also find in vivo in clones running along veins. However, an algorithm modification that occasionally causes a border cell to leave the border and enter the rest of the population reproduces the in vivo situation even more accurately (not shown). In this computer simulation we can trace back the birth time of each postmitotic cell. As seen in Figure 6, the oldest postmitotic cells remain closer to the borders and in the middle line the youngest appear in intermediate regions. This indicates that clones grow from borders inwards, probably reflect-ing the in vivo process.
Regeneration
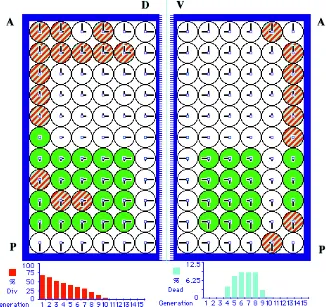
The same algorithms used to simulate cell proliferation under normal conditions can be used to follow processes of regeneration. We here simulate two types of regeneration, intercalar and distal. We model intercalar regeneration by removing several rows of cells of a final anlage (in Entelechia condition), and allowing cells at the border of the wound to come into contact and compute their positional values. Positional value differences elicit, as in normal development, cell division and cell allocation until the missing cells are finally regenerated, as indicated in Figure 7A (cells with thicker outlines). Both proximal and distal cells of the wound border are engaged in cell division, as is known to occur in vivo (Bohn, 1970). The same happens if the regeneration occurs in young, still growing primordia, which continue to grow later until they reach Entelechia condition (not shown).
In distal regeneration, where border cells are missing, following the joining of wound cells which belong to different compartments or sectors, cells exchange signals. This exchange leads to stepwise increase of their positional values, and to proliferation as in normal development (Fig. 7B). Alternatively, distal regeneration may be of the intercalar type if the signals that are generated upon joining generate immediately the maximal M value. In both cases the anlage reaches the Entelechia condition by local cell proliferation. It is not known which of the two modalities of distal regeneration takes place in vivo. Interestingly, apoptosis is not observed during the process of regeneration, contrary to the normal development (Fig. 7B, below).
Cell behavior in genetics mosaics
The existence of cell positional values operating in the devel-opment of epithelia is corroborated by mutations that affect them. We model here the situation found in mosaics of several muta-tions which cause the preferential allocation of the mutant cells within the positional map of the growing anlage. This is the case of genes encoding for ligands, membrane receptors or martial genes (see discussion). For example, cells carrying loss of function alleles of extramacrochaetae (emc), a nuclear gene, tend to grow in elongated clones towards and along veins, whereas gain of function alleles of the same gene tend to grow away from veins (García-Alonso and García-Bellido, 1988; de Celis et al., 1995). Assuming that veins appear in the highest positional values in a sector, then the behavior of emc clones suggests that an insufficiency of emc function provides cells with higher than normal positional values, such that the daughter cells of the clone allocate to positions closer and closer to veins. If we provide dividing cells, in our model, with an incremented value in the X axis, clones duplicate the behavior observed in vivo (Fig. 8). If the emc clone is large (because initiated early) and all the cells of the sector are mutant, cell proliferation reaches the Entelechia
dition earlier, with less cells both in the X and in the Y axes, i.e., giving rise to smaller sectors (not shown), again duplicating the behavior of real emc clones.
Discussion
The computer simulation of the process of cell proliferation leading to the Entelechia condition is based on cell behavior properties found in normal development and in mutant and experimental conditions. This includes 1) the role of differential gene expression at compartment boundaries (Blair, 1995; Law-rence and Struhl, 1996); 2) scalar diffeLaw-rences revealed in cell recognition of dissociated cells with respect to position and polarity, within compartments and vein sectors (García-Bellido, 1972; García-Bellido and de Celis, 1992); 3) random mitotic orientations followed by preferential allocation of daughter cells along the primordium axes (Milán et al., 1996b); 4) the attainment of constant sizes and shapes in imaginal discs grown under various experimental conditions (García-Bellido, 1965) and 5) the behavior of cells in clones in genetic mosaics (see below). The model postulates non-identical daughter cells with subsequent differential allocation to new positions, but we do not know how this is accomplished. Ensuing cell apoptosis, when new daughter cells and neighboring cells have identical M levels, is also an ad hoc proposition, but it could reflect insufficient cell signals as is the
Fig. 8. Clones of cells with intrinsically higher values in a martial gene. (Due to mutation, for example, in emc). The mutant cells (striped) allocate to higher value positions (towards and along restriction borders) as cell proliferation proceeds. Notice that the twin clones (labeled cells) grow normally.
case for apoptotic cells in vivo (Raff, 1992). However the low occurrence of apoptosis in the simulation compares well with the rare apoptosis found in normally growing discs (Mi-lan et al., 1997). The model postulates further an increase of M values after each cell division, a feature for which we have no observational data.
The algorithm used here reflects known biological features, but it is at best an analogy to the real situation. Its simplicity will hopefully help the search for properties operating in vivo. Although there are genetic candidates for the role of ligands (vein), receptors/adhesion mol-ecules (Notch, veinlet, top) (Clifford and Schüpbach, 1989; García-Bellido, et al., 1994; Schnepp et al., 1996; Simcox et al., 1996) and nuclear genes mobilizing the other signals (blistered, extramacrochaetae, Garrell and Modolell, 1990; de Celis et al., 1995; Montagne et al., 1996), we have no clear candidate for the role assigned to martial genes that could deter-mine the X, Y positional values through scalar variations in their level, and trigger cell division following titration by activated receptors. emc, a nuclear HLH encoding gene, might control the expression of the corresponding martial gene, perhaps another HLH gene, for the X axis. Another candidate martial gene is nubbin (encoding a transcription factor) which causes, in the mutant condition or in genetic mosaics, the compaction of the wing in both the proximo-distal and anterior posterior axis (Cifuentes and García-Bellido, 1997). The X and Y func-tions are intimately related to each other, as seen in “accommo-dation” processes caused by mutations in genes at work at the clonal restriction boundaries (García-Bellido and Santamaría, 1972; Mohler and Vani, 1992; Diaz-Benjumea and Cohen, 1993; Basler and Struhl, 1994; Tabata et al., 1995; Zecca, et al., 1995). Thus, genes under the control of the selector engrailed and apterous, or those encoding the ligands and receptors mentioned above (García-Bellido et al., 1994), may cause, in mutant flies or in genetic mosaics, reduction (or excess) of growth in both axes of the wing.
It seems reasonable to assume that the Entelechia function operating in early compartments, once completed, becomes substituted by new ones, corresponding to shorter distances between new borders which later will expand by cell division to fulfill new Entelechia functions (Fig. 1A). The Entelechia model may obviously apply to other imaginal discs as well. Patterning of cell types (chaetae, veins) will, like in the “prepattern” model, reflect cell responses to highest (or lowest) positional values. The Entelechia model generates patterns of constant sizes: it is not size invariant, as opposed to the “positional information” model. It only accounts for the generation of sheets of patterned cells. Conic appendages can also be considered, at the local level, as bidimensional patterns (Held, 1979). This model, however, cannot readily be extended to explain constant sizes and shapes in multilayered cell epithelia, muscles, or conden-sation of chondrocytes into bones, as found in vertebrate development.
Acknowledgments
We thank Antonio Baonza and other colleages in our laboratory for helping with determination and preparation of the Figures. This work was supported by Grant PB92-0036 from the Dirección General de Investigación Científica y Técnica and an institutional grant from the Fundación Ramón Areces to the Centro de Biología Molecular Severo Ochoa.
References
BASLER, K. and STRUHL, G. (1994). Compartment boundaries and the control of Drosophila limb pattern by hedgehog protein. Nature 368: 208-214.
BLAIR, S.S. (1995). Compartments and appendage development in Drosophila. Bio Essays 17: 299-309.
BOHN, H. (1970). Interkalare regeneration und segmentale Gradienten bei den Extremitäten von Leucophaea-Larven (Blattaria). Roux Arch. Dev. Biol. 165: 303-341.
CIFUENTES, F.J. and GARCÍA-BELLIDO, A. (1997). Proximo-distal specification in the wing of Drosophila by the nubbin gene. Proc. Natl. Acad. Sci. USA 94: 11405-11410.
CLIFFORD, R.J. and SCHÜPBACH, T. (1989). Coordinately and differentially muta-ble activies of torpedo, the Drosophila melanogaster homolog of the vertebrate EGF receptor gene. Genetics 123: 771-787.
DE CELIS, J.F., BAONZA, A. and GARCÍA-BELLIDO, A. (1995). Behaviour of extramacrochaetae mutant cells in the morphogenesis of the Drosophila wing. Mech. Dev. 53: 209-221.
DIAZ-BENJUMEA, F. and COHEN, S.M. (1993). Interactions between dorsal and ventral cells in the imaginal disc directs wing development in Drosophila. Cell 75: 741-752.
DIAZ-BENJUMEA, F. and GARCÍA-BELLIDO, A. (1990). Behaviour of cells mutant for an EGF receptor homologue of Drosophila in genetic mosaics. Proc. R Soc. Lond. (Biol.) 242: 36-44.
FERRUS, A. and GARCÍA-BELLIDO, A. (1976). Morphogenetic mutants detected in mitotic recombination clones. Nature 260: 425-426.
FRENCH, V.P., BRYANT, P.J. and BRYANT, S.V. (1976). Pattern regulation in epimorphic fields. Science 193: 969-81.
GARCÍA-ALONSO, L. and GARCÍA-BELLIDO, A. (1988). extramacrochaetae, a trans-acting gene of the achaete-scute complex of Drosophila is involved in cell communication. Roux Arch. Dev. Biol 197: 328-338.
GARCÍA-BELLIDO, A. (1965). Larvalentwicklung transplantierter organe von Dro-sophila melanogaster im adultmilieu. J. Insect Physiol. 11: 1071-1078.
GARCÍA-BELLIDO, A. (1966). Pattern reconstruction by dissociated imaginal disc cells of Drosophila melanogaster. Dev. Biol. 14: 278-306.
GARCÍA-BELLIDO, A. (1972). Pattern Formation in Imaginal Disks. In Results and Problems in Cell Differention. (Eds. H. Ursprung and R. Nöthiger).
Springer-Verlag. Berlin. Vol. 5. pp. 59-91.
GARCÍA-BELLIDO, A. (1979). Genetic analysis of the achaetae-scute system of Drosophila melanogaster. Genetics 91: 443-453.
GARCÍA-BELLIDO, A. (1983). Comparative anatomy of cuticular patterns in the Genus Drosophila. In Development and Evolution (Eds. B.C. Goodwin, N. Holder and C.C. Wylue). Cambridge University Press. pp. 227-255.
GARCÍA-BELLIDO, A. and DE CELIS, J.F. (1992). Developmental genetics of the venation pattern of Drosophila. Annu. Rev. Genet. 26: 275-302.
GARCÍA-BELLIDO, A. and NÖTHIGER, R. (1976). Maintenance of determination by cells of imaginal discs of Drosophila after dissociation and culture in vivo. Roux Arch. Dev. Biol. 180: 189-206.
GARCÍA-BELLIDO, A. and SANTAMARIA, P. (1972). Developmental analysis of the wing disc in the mutant engrailed of Drosophila melanogaster. Genetics 72: 87-101.
GARCÍA-BELLIDO, A. and SANTAMARIA, P. (1978). Developmental analysis of the achaete-scute system of Drosophila melanogaster. Genetics 88: 469-486.
GARCÍA-BELLIDO, A., CORTES, F. and MILAN, M. (1994). Cell interactions in the control of size in Drosophila wings. Proc. Nat. Acad. Sci. USA 91: 10222-10226.
GARRELL, J. and MODOLELL, J. (1990). The Drosophila extramacrochaetae locus, an antagonist of proneural genes that, like these genes, encodes a helix-loop-helix protein. Cell 61: 39-48.
GOMEZ-SKARMETA, J.L., DIEZ DEL CORRAL, R., DE LA CALLE-MUSTIENES, E., FERRES-MARCO, D. and MODOLELL, J. (1996). Araucan and caupolican, two members of the novel Iroquois complex, encode homeoproteins that control proneural and vein-forming genes. Cell 85: 95-105.
GONZALEZ-GAITAN, M., CAPDEVILA, M.P. and GARCÍA-BELLIDO, A. (1994). Cell proliferation patterns in the wing imaginal disc of Drosophila. Mech. Dev. 46: 183-200.
HELD, L.I. (1979). Pattern as a function of cell number and cell size on the second-leg basitarsus of Drosophila. Roux Arch. Dev. Biol. 187: 105-127.
LAWRENCE, P.A. and STRUHL, G. (1996). Morphogens, compartments, and pat-tern: Lessons from Drosophila ? Cell 85: 951-961.
MILAN, M., CAMPUZANO, S. and GARCÍA-BELLIDO, A. (1996a). Cell cycling and patterned cell proliferation in the wing primordium of Drosophila. Proc. Natl. Acad. Sci. USA. 93: 640-645.
MILAN, M., CAMPUZANO, S. and GARCÍA-BELLIDO, A. (1996b). Cell cycling and patterned cell proliferation in the Drosophila wing during metamorphosis. Proc. Natl. Acad. Sci. USA 93: 11687-11692.
MILAN, M., CAMPUZANO, S. and GARCÍA-BELLIDO, A. (1997). Developmental parameters of cell death in the wing disc of Drosophila. Proc. Natl. Acad. Sci. USA 94: 5691-5696.
MOHLER, J. and VANI, K. (1992). Molecular organization and embryonic expression of the hedgehog gene involved in cell-cell comunication in segmental patterning of Drosophila. Development 115: 957-971.
MONTAGNE, J., GROPPE, J., GUILLEMIN, K., KRASNOW, M.A., GHERING, W.J. and AFFOLTER, M. (1996). The Drosophila Serum Response Factor is required for the formation of intervein tissue of the wing and is allelic to blistered. Development 122: 2589-2597.
MORATA, G. and GARCÍA-BELLIDO, A. (1976). Developmental Analysis of some mutants of the bithorax system of Drosophila. Roux Arch. Dev. Biol. 180: 125-143.
MORATA, G. and RIPOLL, P. (1975). Minutes: Mutants of Drosophila autonomously affecting cell division rate. Dev. Biol. 42: 211-221.
MORGAN, T. H. (1895). Studies of the «partial» larvae of Sphaeretines. Archiv f. Entwickelungsmechanik der organismen. (Eds. Band and Heft). Wilgelm Engetmann. Leigzig. pp. 81-126.
RAFF, M.C. (1992). Social controls on cell survival and cell death. Nature 356: 397-400.
SANTAMARIA, P. (1983). Analysis of haploid mosaics in Drosophila. Dev. Biol. 96: 285-295.
SANTAMARIA, P. and GANS, M. (1980). Chimeras of Drosophila melanogaster obtained by injection of haploid nuclei. Nature 287: 143-144.
SIMCOX, A.A., GRUMBLING, G., SCHNEPP, B., BENNINGTON-MATHIAS, C., HERSPERGER, E. and SHEARN, A. (1996). Molecular, phenotypic, and expres-sion analysis of vein, a gene required for growth of the Drosophila wing disc. Dev. Biol. 177: 475-489.
SIMPSON, P. and MORATA, G. (1981). Differential mitotic rates and patterns of growth in the Drosophila wing. Dev. Biol. 85: 299-308.
STERN, C. (1954). Two or three bristles. Am. Sci. 42: 213-247.
TABATA, T., SCHWARTZ, C., GUSTAVSON, E., ALI, Z. and KORNBERG, T.B.
(1995). Creating a Drosophila wing de novo, the role of engrailed and the compartment hypotesis. Development 121: 3359-3369.
WOLPERT, L. (1969). Positional information and the spatial pattern of cellular differentiation. J. Theor. Biol. 25: 1-47.
WOLPERT, L. (1971). Positional information and pattern formation. Curr. Top. Dev. Biol. 6: 183.