On the Effectiveness of Static Analysis Tools for Fault-Detection
Jiang Zheng
1, Laurie Williams
1, Nachiappan Nagappan
1, Will Snipes
2, John Hudepohl
2,
Mladen Vouk
1, Kiem Ngo
21
Department of Computer Science, North Carolina State University, Raleigh, NC, USA
{jzheng4, lawilli3, nnagapp, vouk}@ncsu.edu
2
Nortel Networks, Software Dependability Design (SWDD), Research Triangle Park, NC, USA
{wbsnipes, hudepohl, kingo}@nortelnetworks.com
Abstract
Static analysis tools can be used to detect a subset of faults in a less labor-intensive manner than traditional, manual inspection. We analyzed faults identified for three large-scale industrial software systems developed at Nortel Networks. Using the Orthogonal Defect Classification (ODC) scheme, we classified and compared the types of faults found by static-analysis tools, by manual inspection, by system testing, and those that escaped to customers. We found that automated inspection is effective at identifying Assignment and Checking faults, allowing the later phases to focus on more complex, functional and algorithmic faults. We found that the cost of fault removal via the use of static analysis tools is lower than that of manual inspection.
1. Introduction
The use of software code inspections, design inspections, and requirements inspections, has been found to increase software quality and to lower software development costs [5, 11]. Prior studies indicate that inspections can detect as little as 20% [4] to as much as 93% [6] of the total number of faults in an artifact. Based upon a literature survey, Briand et al. [2] report that, on average, software inspections find 57% of the faults in code and design documents. Inspections have been traditionally done manually with key members of the development and quality assurance teams during software review meetings, henceforth referred to as manual inspection.
Recently, static analysis tools have been incorporated as a means of partially automating code inspection. In 2001, Nortel Networks began to use ASI tools and services in conjunction with manual inspection. Nortel has since inspected over 20 million
lines of code with their manual and automated inspection best practice. Nortel has defined a best procedure in manual and automated inspection that enhances Nortel’s ability to deliver carrier grade software for its network solution. Henceforth, we refer to the use of static analysis tools to partially automate software code inspections as "automatic software inspection" or ASI. FlexeLint1, Reasoning’s2 Illuma, Klocwork’s3 Inspect inForce and GateKeeper are some static analysis tools and services. Static analysis tools produce error messages similar to those of a compiler. However, they identify additional potential faults, such as coding standard non-compliance, uncaught runtime exceptions, security vulnerabilities, redundant code, inappropriate use of variables, division by zero, and memory leaks. The use of static analysis tools can, therefore, enable software engineers to fix faults before they surface more publicly in manual inspections or as test and/or field failures.
No single fault-detection technique is capable of addressing all fault-detection concerns [18]. ASI can not replace the manual inspection process but can be used as an added filter to remove certain types of faults. Manual inspections have been shown to identify a wider range of fault types than ASI, as will be discussed in Section 5.2. The removal of the faults found by the ASI can allow the labor-intensive manual reviews to be more efficient and to focus on more complex functional and algorithmic faults. Inspectors can benefit from knowing the classes of faults that are removed by ASI so they can focus their attention on other types of faults. In this paper, we examine the classes of faults that can be removed by ASI and the affordability of the use of static analysis tools.
1 http://www.gimpel.com/html/products.htm 2 http://www.reasoning.com/
We analyzed the data from three different large-scale commercial software products which underwent various combinations of manual and automated inspection processes. Our research objectives were to (1) examine, classify, and compare the classes of faults identified by fault removal techniques; and (2) assess the economic efficacy of automated inspection, including the cost impact and the ability to identify faults.
The paper is organized as follows. Section 2 discusses the background and related work. Section 3 outlines the implementation of ASI at Nortel. Section 4 illustrates the data analysis process. Section 5 discusses the analysis results. Finally, Section 6 presents the conclusions and future work.
2. Background and related work
In this section, we discuss the prior work in software inspections, static analysis tools, fault classification schemes, and prior investigation on ASI.
2.1. Software inspections
Static analysis techniques do not require program execution. Inspections are a static analysis technique that relies on visual examination of development products to detect errors, violations of development standards, and other problems [10]. Beginning with the landmark work of Fagan in 1976 [5], structured review mechanisms, such as inspections, have been repeatedly shown to be effective means of finding work product faults early in the software development process [13]. Industrial data has shown that inspections are among the most effective of all verification and validation (V&V) activities, measured by the percentage of faults typically removed from a document via the technique [15]. Inspections also help to increase the development team's familiarity with the code.
The majority of software inspections are performed manually by developers. Such manual inspections are labor-intensive and time consuming. Software review meetings, the most familiar form of manual inspections, require preparation and the simultaneous attendance of all participants (or inspectors). Sometimes the inspectors perform code review and fault detection individually, and the faults are merged asynchronously into one list. However, the effectiveness of inspections is still dependant upon satisfying many conditions, such as adequate preparation, readiness of the work product for review, high quality moderation, and cooperative interpersonal relationships [13]. The effectiveness of ASI is less dependent upon these human factors.
2.2. Static analysis tools
The goal of automatic static analysis is to draw the verifier's attention to anomalies in the program. Although these anomalies are not necessarily erroneous conditions, it is often the case that many of these anomalies are a result of programming errors or omissions. The stages involved in static analysis include control flow analysis, data use analysis, interface analysis, information flow analysis, and path analysis. Static program analysis tools scan and parse the source text of a program to detect possible faults and anomalies in the program. They complement the error detection facilities provided by the language compiler. Static analysis tools are particularly valuable for a programming language like C because C does not have strict type rules and the checking the C compiler can do is limited. Therefore, there is a range of programmer errors which can be automatically detected by static analysis tools. [12, 16] An important benefit of static analysis tools is that they do not necessitate execution of the subject program yet infer results applicable to all possible executions [12, 17].
ASI can remove a subset of faults prior to manual inspection or test. ASI has the potential to be economical. The main goals of using automated inspection are the following:
1. to identify syntax and interface errors;
2. to identify potential for reducing code volume via redundant or unused code;
3. to enforce architectural standards; 4. to enforce coding standards;
5. to eliminate potential sources of error and inefficiency; and
6. to eliminate actual errors.
An important issue with the use of ASI tools is the inevitability of significant amounts of false positives. False positives are faults that are found by the tool that are determined to be non-problematic based upon a deeper analysis of the context. There can be as many as 50 false positives for each true fault found by static analysis tools [14]. Often, static analysis tools can be customized and filters can be established so that certain classes of faults are not reported, reducing the false positive rate. For example, consider a macro defined for accessing an array member of C structure as follows:
#define offsetof(s, m)
(size_t)(&(((s *)0)->m))
-emacro(413,offsetof)
This configuration instructs the ASI tool not to report the warning No. 413 for this macro.
Often Nortel employs pre-screeners to identify false positives in the ASI output manually. First, the warnings are grouped based on the error message number and then divided and assigned to screeners based on fault types and likelihood of the warnings. Each screener individually reads code to analyze why the raw warnings are generated and logs preliminary true positives. Some obvious logic errors or typos (not found by the ASI tool but noticed by the screeners) are also reported. Afterwards, the preliminary true positives are reviewed by the inspection team for further false positive reduction. Finally, the true positives are entered into the final reports which are sent back to the customer.
2.3. Fault classification schemes
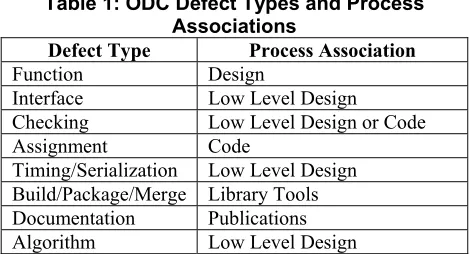
The goal of fault analysis is to identify the root cause of faults and to initiate actions so that the source of faults is eliminated [3]. Fault classification schemes are intended to have categories that are distinct, i.e. orthogonal, to remove the subjectivity of the classifier [9]. The goal of IBM's Orthogonal Defect Classification (ODC) [3] scheme is to categorize defects such that each defect type is associated with a specific stage of development. The ODC has eight defect types, each defect type is intended to point to the part of the development process that needs attention. Each of these defect types and their process associations are shown in Table 1 [3]:
Table 1: ODC Defect Types and Process Associations
Defect Type Process Association
Function Design Interface Low Level Design
Checking Low Level Design or Code Assignment Code
Timing/Serialization Low Level Design Build/Package/Merge Library Tools Documentation Publications Algorithm Low Level Design
2.4. Initial research in ASI
A preliminary investigation had been done on ASI at Nortel. Fault data for a large 800 KLOC product that underwent ASI for two releases was analyzed [11]. This analysis indicated the faults found in ASI could be classified by three of the eight ODC fault types: Assignment, Checking, and Interface. In addition, the
ASI faults, code churn, and deleted lines of code were used to form a multiple regression equation which was effective for predicting the actual defects of the product. Finally, discriminant analysis indicated that ASI faults, code churn and deleted lines of code could be used as an effective means of classifying fault-prone programs.
3. ASI at Nortel
The Software Dependability Design (SWDD) group of Nortel Networks has the mission of developing and disseminating key strategic technologies and best practices across the company for the improvement of the software dependability of each product. To achieve this mission, Nortel Networks has ten best practices for software dependability which they call the "Software Dependability Design Ten Point Program." The program is a collection of best practices, tools, methodology standards, and design guidelines developed within Nortel Networks. One of the best practices in the Ten Point Program is Manual and Automated Inspection (MAIN).
At Nortel Networks, the transition to using ASI is done in two phases: start up and in-process. In the start up phase, the SWDD group works closely with the transitioning team to establish a clean baseline of the product. For this, the most recently released product (considered the N-1 release) undergoes ASI. Because it is likely that this first use of ASI with this product will yield an excessive amount of false positive faults, the total list of warnings generated by ASI tools is sent to pre-screeners for screening. The SWDD has an extended core team of eight pre-screeners dedicated to this screening service.
(the N+1 release). For the N+1 release and beyond, only the changes are screened.
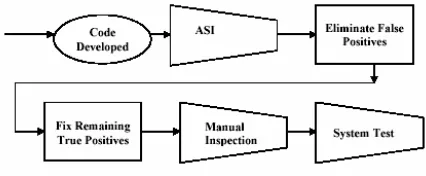
Once the team has undergone the start up phase, ASI is an additional fault removal filter in the development process, as shown in Figure 1. Since the code volume that undergoes ASI is more manageable once the clean baseline has been established, ASI is often run by the developers without the involvement of pre-screeners. Nortel has also developed centralized, in-house expertise in the use of ASI tools and in the screening of the faults. These experts have anecdotally been able to reduce the false positive rate to approximately 1%.
Figure 1: ASI in the development process
Depending upon the developer, the frequency of doing ASI varies. ASI can be run when a component is complete and is about to undergo manual inspection. Alternately, a developer can run the ASI tools more incrementally as code is being developed because the tools do not require a complete, running product. In either case, manual inspection is also carried out after the true positives are fixed. In this way, the manual inspectors do not have to look for the faults that have already been identified by ASI.
Manual inspections are performed after the remaining true positives identified by screeners are fixed. After the ASI and manual inspections, internal system test and external customer test are performed on the products. All the test failures and general field failures in regular use are reported as Change Request (CR) records, as will be discussed in section 5.3.
4. Fault Analysis
We collected and analyzed fault data of three large-scale network service products. Data analysis consisted of faults reported by over 200 inspectors and testers and by customers for over three million lines of code developed at Nortel Networks. The first two products, henceforth called Product A and Product B, both underwent ASI. However, manual inspections were not performed on Product A. For Product B, the manual inspection faults were communicated via email and not archived. Data for several releases were available for a third product which is referred to as
Product C. All of the releases for Product C have formal manual inspection records whereas only two releases underwent ASI, henceforth called Product C.1 and C.2. We analyzed C.1 and C.2 that underwent both ASI and manual inspection and one release that underwent manual inspection only, referred to as Product C.0. Product C.0 is chosen for analysis because it was prior to the first ASI process, and it has a significant amount of manual inspection records. The ASI faults were pre-screened for all the three products (A, B, and C. The faults that were analyzed were the true positives that remained after the screening. For each release, we manually scrutinized and classified a vast amount of ASI faults, manual inspection records, and CR failures. The summary of the data that was analyzed is shown in Table 2.
Table 2: Summary of the data analyzed
Product/Release ASI Manual CR
A Yes
B Yes Yes
0 Yes
1 Yes Yes
C
2 Yes
We structured our study using the Goal-Question-Metric (GQM) [1] paradigm. The goal of the study was to determine whether ASI can help an organization economically produce a high-quality product. To reach this goal, we examined the following questions and corresponding metrics:
Q1: Using the ODC, what types of faults are detected by ASI, manual inspection, system testing, and customer use?
M1: % of ASI faults in each ODC type
M2: % of manual inspection faults in each ODC type
M3: % of internal test failures in each ODC type
M4: % of external field failures in each ODC type
Q2: What ODC classes of faults are identified by manual inspection if ASI is performed prior to the inspection? What classes of faults are identified if ASI is not performed prior to manual inspection?
M2: % of manual inspection faults in each ODC type
Q3: Is static analysis an economical means of removing faults?
M5: The ratio of cost of manual inspection per fault to cost of automated inspection per fault
5. Results
In Section 5.1, we classify the automated inspection faults and present the results of the classification on the three products. Section 5.2 and 5.3 provide the results of examining and comparing the manual inspection records and CR data, respectively. In Section 5.4, we discuss the economic efficacy of automated inspection.
5.1. Fault classification
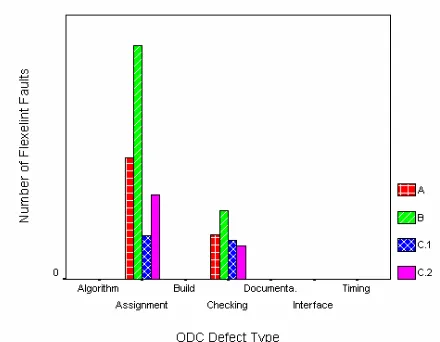
We counted and classified (according to the ODC) the ASI faults for the three products. The results of this analysis are shown in Figure 2. Each fault had a documented problem report that contains detailed information such as fault descriptions, location, preconditions, impact, severity, suggestion, and code fragment. The reports were manually read one by one and then faults were classified and counted to form a clear profile of faults. The results indicate that ASI is effective at identifying two of the eight ODC defect types: Assignment and Checking. As we discussed in Section 2.4, Checking defects would be injected in the low level design or coding phase while Assignment defects would be injected in the coding phase. As a result, static analysis tools appear to be effective at identifying code-level defects.
Figure 2: Mapping of ASI faults to ODC defect types
To know more detailed fault information, we merged the same or very similar ASI faults for all the three products. The summary of detailed ASI fault classification is shown in Appendix A. Severity information was added by the screeners. The faults were given severity ratings of Critical, Major, Minor, and Coding Standard Violation (however, there were no
Coding Standard Violations identified in the products we analyzed) based on their potential failure impact.
• Critical faults can likely cause an application core dump or service outage, system reboot, etc. • When a fault can possibly cause segmentation
fault, or performance degradation such as memory leaks, resource leaks, data corruption, it was ranked as a Major fault.
• Minor faults may result in erratic and unexpected behavior but may have little impact on the system.
• Correcting Coding Standard faults will increase the maintainability and readability of the software.
As we mentioned in Section 3, the screening of the ASI output is a manual process and the classification is subjective. Different products were screened and evaluated by different screeners. Therefore, the same or very similar fault might be evaluated as different severity. For example, the fault "Possible Use of Null Pointer" occurred many times in all the four products/releases. Most of the faults in this type were assessed as Critical faults in Product A and Product C.1. At the same time, screeners for Product B deemed 72.3% of faults in this type were Minor faults, and 92.8% of faults in this type were considered Major faults in Product C.2, as shown in Figure 3. Additionally, we noticed that the screeners recorded some obvious errors in the code that were not detected by the static analysis tools. For example, the faults with type "Logic Error and Typo" and "Wrong Output Message" were noted. These types of faults could not be caught by a tool and must have been identified by the screeners. However, only a few such faults were logged in the final report and they have little impact on the overall analysis.
Additionally, the analysis result of ASI faults is in accord with the Pareto Principle (a great majority of problems are produced by a few key causes). As shown in Appendix A, the faults found by ASI tools are concentrated on several fault types. The fault that occurred most is "Possible Use of Null Pointer." As we can see in Table 3, this fault type accounts for almost 46% of total faults and more than 60% of the critical faults. The five most prevalent fault types account for more than 77% of total faults. More than 85% of critical faults and 76% of major faults are concentrated on these five fault types. Similarly, about 90% of faults are focus on ten fault types, no matter what level of severity. These results indicate that programmers tend to make several types of mistakes in coding. To improve the code quality in future projects, we can use this information as feedback to programmers so that they pay more attention to these problems.
Table 3: Pareto effect in ASI faults % of all
faults
% of all critical
faults
% of all major
faults
% of all minor
faults
First 1 type 45.92 60.86 37.96 46.32 First 5 types 77.26 85.11 76.56 74.24 First 10 types 89.87 90.42 89.42 90.04
5.2. Manual inspection faults analysis
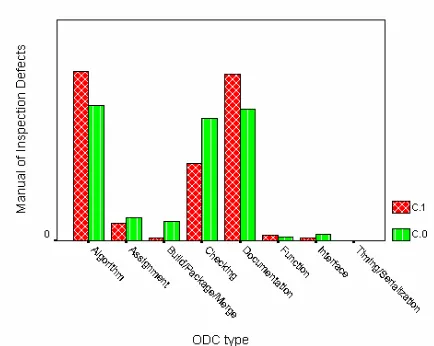
Not all manual inspection processes and results were logged formally. Some of them were communicated via emails and could not be analyzed. However, the minutes of manual inspection meetings for Product C were well recorded in text files via a recording tool. For analysis and comparison, we analyzed two of the releases, referred as Product C.1 and Product C.0. Product C.1 underwent both ASI and manual inspection. Product C.0 underwent manual inspection only. Similar to the analysis on ASI, every manual inspection file was manually read, and manual inspection faults were classified according to ODC and counted, as shown in Table 4 and Figure 4.
Table 4: Classification of manual inspection faults
ODC Type C.1 (%) C.0 (%)
Algorithm 38.27 30.60
Documentation 37.65 29.85
Checking 17.59 27.61
Assignment 4.01 5.22
Function 1.23 0.75
Interface 0.62 1.49
Build/Package/Merge 0.62 4.48
Timing/Serialization 0 0
Figure 4: Mapping of manual inspection faults to ODC defect types
The results indicate that manual inspection most often identifies Algorithm, Documentation, and Checking faults. Approximately 90% of all the faults belong to these three types. A few faults in Assignment, Function, Interface, and Build/Package/Merge types can also be found via manual inspection. Therefore, the removal of ASI faults prior to manual code inspection could allow the inspectors to focus more on the faults other than Assignment and Checking faults. Additionally, inspectors wrote a lot of comments on code readability and/or maintainability, such as indentation, redundant code segment, naming convention, coding standard, and programming style, in the manual inspection records. These readability/maintainability comments account for about 24-30% of the statements in manual inspection records. The comparison of manual inspection and ASI indicates that many more Checking faults are identified by manual inspection if ASI is not performed prior to the inspection. Only a few Assignment faults were identified in manual inspection records (not only in these two releases), indicating that it is hard for manual code inspection to find potential problems on the assignment and initialization of variables or pointers. However, ASI does well in identifying this class of faults, as discussed in Section 5.1.
5.3. Test/field failures analysis
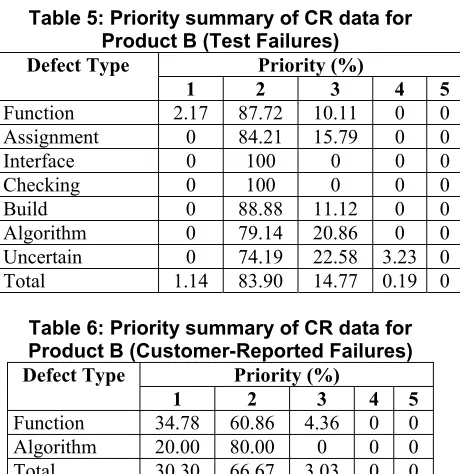
failures is shown in Table 6. A priority (i.e. severity) rating is given in the CRs. In general, the priority is an indication of the failure on the operation of the system. However, sometimes the priority may be elevated if a very important customer or many customers are affected. The scale is from one to five with one being the highest priority. Eighty-five percent of the test failures and 97% of the field failures have a very high priority.
Table 5: Priority summary of CR data for Product B (Test Failures)
Priority (%) Defect Type
1 2 3 4 5
Function 2.17 87.72 10.11 0 0
Assignment 0 84.21 15.79 0 0
Interface 0 100 0 0 0
Checking 0 100 0 0 0
Build 0 88.88 11.12 0 0
Algorithm 0 79.14 20.86 0 0
Uncertain 0 74.19 22.58 3.23 0
Total 1.14 83.90 14.77 0.19 0
Table 6: Priority summary of CR data for Product B (Customer-Reported Failures)
Priority (%) Defect Type
1 2 3 4 5
Function 34.78 60.86 4.36 0 0 Algorithm 20.00 80.00 0 0 0 Total 30.30 66.67 3.03 0 0
The comparison between test and customer CRs of Product B is shown in Table 7. For test-failure CRs, almost 88% of the failures belong to Function and Algorithm type. However, all customer-failure CRs were classified as Function and Algorithm.
Table 7: ODC Comparison between test and customer CRs
Defect Type Test (%) Customer (%)
Function 52.46 69.70
Algorithm 35.42 30.30
Assignment 3.60 0
Build 1.70 0
Checking 0.76 0
Interface 0.19 0
Timing 0 0
Documentation 0 0
Uncertain 5.87 0
5.4. Economic analysis
The affordability of ASI is an important component to deciding whether to use this fault detection technique. To examine the affordability of ASI we compared the cost of ASI to that of manual inspection which is known to be an affordable fault detection technique [5, 11].
To determine the average cost of detecting a fault via manual inspection, we examined manual inspection records for C1. These records contained specifics of preparation time and meeting times of each inspection participant. We added together all the preparation and meeting time for manual inspection and divided by the number of faults found by manual inspection. We computed the cost per fault considering an average annual base salary plus benefits cost of $150,000 per inspection participant. The average cost of detecting a fault via manual inspection is computed using Equation 1:
Manual Inspection:
We computed the cost of ASI based on the cost of the automatic inspection tool license, the pre-screening cost to eliminate false positives, and the number of remaining true positive fault. The computation is shown in Equation 2:
Automatic Inspection:
To protect proprietary information, we provide a ratio of the costs, as shown in Equation 3.
Cost Benefit:
• ASI fault detection can be done by screeners without domain expertise; and
• ASI finds Assignment and Checking faults that do not appear to be well detected via manual inspection or dynamic techniques.
6. Conclusions and Future Work
We analyzed the automated inspection faults, manual inspection faults, and CR data for three large products if available. The comparison between different fault removal filters is shown in Table 8. The mapping of ASI faults to ODC defect types indicated that ASI tools predominantly identify two ODC defect types: Checking and Assignment. Approximately 90% of all the faults identified by manual inspection belong to Algorithm, Documentation, and Checking faults. A large majority of test/field failures are in Function and Algorithm types. Additionally, if ASI is performed prior to manual inspection, much less Checking faults would be identified by the manual inspection. Additionally, our analysis indicated that ASI is an affordable fault-removal technique. ASI has a 28% lower fault detection cost when compared with that of manual inspection; manual inspections have been shown to be a cost effective means of detecting faults.
Table 8: Mapping of defects found by different filters to ODC defect types
Defect Type ASI
(%) Manual (%) Test (%) Customer(%)
Function 0 1.09 55.73 69.70
Assignment 72.27 4.37 3.82 0
Interface 0 0.87 0.20 0
Checking 27.73 20.52 0.80 0
Timing 0 0 0 0
Build 0 1.77 1.81 0
Documentation 0 35.37 0 0
Algorithm 0 36.03 37.63 30.30
Nortel had previously established the Enhanced Measurement for Early Risk Assessment of Latent Defects (EMERALD) decision support system [7, 8]. Emerald was shown to be effective for improving software reliability and for facilitating accurate correction of field problems. We will examine the potential of incorporating ASI fault information in Emerald.
Acknowledgments
We would like to thank the North Carolina State University (NCSU) Software Engineering reading group for their helpful suggestions on this paper. This
work was funded by a Nortel-funded NCSU Center for Advanced Computing and Communications (CACC) enhancement grant.
References
[1] V. R. Basili, G. Caldiera, H. Rombach, "The Goal Question Metric Paradigm," Encyclopedia of Software Engineering - 2 Volume Set, pp 528-532, Copyright by John Wiley & Sons, Inc.
[2] L. C. Briand, El Emam, K., Laitenberger, O., Fussbroich,T., "Using Simulation to Build Inspection Efficiency Benchmarks for Development Projects,"
International Conference on Software Engineering, pp.340-449, 1998.
[3] R. Chillarege, Bhandari, I.S., Chaar, J., Halliday, M.J., Moebus, D.S., Ray, B.K., Wong, M-Y., "Orthogonal Defect Classification - A Concept for In-Process Measurements," IEEE Transactions on Software Engineering, vol. 18, no. 11, pp. 943-956, 1992.
[4] H. E. Dow, Murphy, J.S., "Detailed Product Knowledge is not Required for a Successful Formal Software Inspection," Seventh Software Engineering Process Group Meeting, Boston, MA, 1994.
[5] M. E. Fagan, "Design and Code Inspections to Reduce Errors in Program Development," IBM Systems Journal, vol. 15, no. 3, pp. 182-211, 1976.
[6] M. E. Fagan, "Advances in Software Inspections," IEEE Transactions on Software Engineering, vol. 12, no. 7, pp. 744-751, 1986.
[7] J. Hudepohl, W. Jones, and B. Lague, "EMERALD: A Case Study in Enhancing Software Reliability," Eighth International Symposium on Software Reliability Engineering (Case Studies), Albuquerque, New Mexico, pp.85-91, 1997.
[8] J. Hudepohl, S. J. Aud, T. Khoshgoftaar, E. B. Allen, and J. Mayrand, "Emerald: Software Metrics and Models on the Desktop," IEEE Software, vol. 13, no. 5, pp. 56-59, September 1996.
[9] D. Kelly, Shepard, T., "A Case Study in the use of Defect Classification in Inspections," IBM Centre for Advanced Studies Conference, pp.26-39, 2001.
[10] J. J. Marciniak (editor): Encyclopedia of software engineering, John Wiley & Sons Inc. NewYork, 1994. [11] N. Nagappan, L. A. Williams, J. Hudepohl, W. B.
Snipes, M. A. Vouk, "Preliminary Results on Using Static Analysis Tools for Software Inspection,"
International Symposium on Software Reliability Engineering, 2004.
[12] L. Osterweil, Ed., "Integrating the Testing, Analysis, and Debugging of Programs," Proceedings of the Symposium on Software Validation, North Holland, Elsevier Science Publishers, 1984.
[13] A. A. Porter, Johnson, P.M., "Assessing Software Review Meetings : Results of a Comparative Analysis of two Experimental Studies," IEEE Transactions on Software Engineering, vol. 23, no. 3, pp. 129-145, 1997. [14] Reasoning Inc., "Automated Software Inspection: A
[15] I. Rus, Shull, F., Donzelli, P., "Decision Support for Using Software Inspections," 28th Annual NASA Goddard Software Engineering Workshop, pp.3 - 11, 2003.
[16] I. Sommerville, Software Engineering, 6th edition, Addison-Wesley, 2001.
[17] R. N. Taylor, Ed., "Analysis of Concurrent Software by Cooperative Application of Static and Dynamic
Techniques," Proceedings of the Symposium on Software Validation, North Holland, Elsevier Science Publishers, 1984.
[18] M. Young, and R. N. Taylor, "Rethinking the taxonomy of fault detection techniques," International Conference on Software Engineering, Pittsburgh, Penn., ACM, 1989.
Appendix A. Detailed classification of ASI faults ordered by total occurred times
(% of total ASI faults found)
4Fault Description Critical
(%) Major (%) Minor (%) Total (%) Classification ODC
Possible use of NULL Pointer 11.91 14.73 19.28 45.92 Assignment Possible Access Out-of-Bounds 0.49 3.46 6.18 10.13 Checking (Custodial) pointer has not been freed or returned 1.04 6.87 0.20 8.11 Assignment
Memory Leak 2.92 3.76 0.79 7.46 Assignment
Variable not initialized before using 0.30 0.89 4.45 5.64 Assignment Inappropriate deallocation 0.74 1.88 0.79 3.41 Assignment
Suspicious use of ; 0.10 0.35 2.03 2.47 Checking
Data Overrun 0.05 0.15 1.93 2.13 Checking
Type mismatch with switch expression 0.10 1.93 0.15 2.18 Checking Control flows into case/default 0.05 0.69 1.68 2.42 Checking Possibly passing a null pointer to function 0.35 0.00 1.04 1.38 Checking Ignore return value of function 0.10 0.84 0.40 1.33 Assignment Passing null pointer to function 1.09 0.00 0.00 1.09 Checking Unusual use of a Boolean 0.00 0.54 0.54 1.09 Checking Pointer member neither freed nor zero'ed by destructor 0.00 0.94 0.00 0.94 Assignment
Loop not entered 0.00 0.20 0.59 0.79 Checking
Unreachable code 0.00 0.30 0.49 0.79 Checking
Boolean argument to relational 0.00 0.30 0.05 0.35 Checking Unparenthesized parameter 0.00 0.00 0.35 0.35 Checking Boolean test of assignment 0.00 0.30 0.00 0.30 Checking Possibly negative subscription 0.00 0.25 0.05 0.30 Checking Constant value Boolean 0.00 0.00 0.25 0.25 Checking Boolean within 'String' always evaluates to [True/False] 0.00 0.10 0.10 0.20 Checking Referencing data from already freed pointer 0.20 0.00 0.00 0.20 Assignment
Logic Error and Typo 0.05 0.10 0.00 0.15 Checking
Possible division by 0 0.00 0.15 0.00 0.15 Checking Non-negative quantity is never less than zero 0.00 0.00 0.10 0.10 Checking Null Pointer Derference 0.05 0.05 0.00 0.10 Assignment Variable Depends on Order of Evaluation 0.00 0.00 0.10 0.10 Checking Dereferencing a constant string to a pointer 0.05 0.00 0.00 0.05 Assignment
Resources not freed 0.00 0.05 0.00 0.05 Assignment
Unrecognized format 0.00 0.00 0.05 0.05 Checking
Wrong Output Message 0.00 0.00 0.05 0.05 Checking
Total 19.57 38.80 41.62 100.00
4 Note: ASI tools assign a probability to certain warnings for certain defect types. For example, defect type "Access of Out-of-bounds" has three