Mutators in Space: The Dynamics of High-Mutability Clones
in a Two-Patch Model
E. R. Travis*
,1and J. M. J. Travis
†,2*Institute of Biotechnology, University of Cambridge, Cambridge CB2 1QT, United Kingdom and †Centre for Conservation Science, University of St. Andrews, St. Andrews KY16 9LZ, United Kingdom
Manuscript received July 11, 2003 Accepted for publication January 16, 2004
ABSTRACT
Clones of bacteria possessing high-mutability rates (or mutators) are being observed in an increasing number of species. In a constant environment most mutations are deleterious, and hence the spontaneous mutation rate is generally low. However, mutators may play an important role in the adaptation of organisms to changing environments. To date, theoretical work has focused on temporal variability in the environment, implicitly assuming that environmental conditions are constant through space. Here, we develop a two-patch model to investigate how spatiotemporal environmental variability and dispersal might influence mutator dynamics. Environmental conditions in each patch fluctuate between two states; the rate of fluctuation varies in each patch at differing phase angles. We find that at low and intermediate rates of fluctuation, an increase in dispersal results in a decrease in the density of mutators. However, at high rates of environmental change, dispersal causes an increase in mutator density. For all frequencies of environmental fluctuation these trends are enhanced as the phase angle approaches 180⬚. We argue that future work, both empirical and theoretical, is needed to improve our understanding of how spatiotemporal variability impacts on mutator densities and dynamics.
R
ECENT years have seen considerable attention paid temporally variable then higher mutation rates can beselected for (Leigh1970, 1973;Gillespie1981; Ishii
to the dynamics of mutators—populations with
high mutation rates (for a recent review seeSniegowski et al. 1989). These studies tended to seek the single
optimal mutation strategy under a particular set of envi-et al.2000). This work has been stimulated by the
in-creased frequency with which mutators are being found ronmental conditions, rather than considering the
tem-poral dynamics of competing clones with different
muta-within different bacterial species (LeClercet al.1996;
Matic et al. 1997; Oliver et al. 2000; Giraud et al. tion rates.
More recently, models have been developed to investi-2001). Evidence suggesting that mutators may increase
the likelihood of the evolution of drug resistance (Snie- gate the dynamics of mutator clones that increase the
mutation rate by a particular factor (Taddeiet al.1997;
gowskiet al. 2000) seems likely to further accelerate
attempts to understand both the causes and the conse- Tenaillonet al.1999, 2000;TravisandTravis2002).
In these models a wild-type clone with a low mutation quences of mutator clones. High frequencies of mutator
strains have been observed among pathogenic (disease- rate competes with a mutator clone that has a higher
mutation rate. Results demonstrate that even when a
causing) bacteria (LeClercet al.1996;Denamuret al.
2002;Richardson et al.2002), although it is unclear population experiences a single shift in its
environmen-tal conditions a mutator clone may dramatically increase whether the hypermutability contributes to the
pathoge-nicity of the bacterial strain (Matic2000;Denamuret its density within the population. The predictions of
these models are in agreement with results from labora-al.2002).
It has long been recognized that in constant environ- tory studies. Mao et al. (1997) and Sniegowski et al.
(1997) both demonstrated that mutator density in-ments most mutations are deleterious, and hence
muta-creases in laboratory populations ofEscherichia coli sub-tion occurs at a low rate that is constrained only by the
jected to a single shift in the environment. Mutator clones
costs of error avoidance and error repair (Kimura1967;
are at a selective advantage following an environmental
Drake1991). However, several theoretical studies have
change as they enable more rapid adaptation to the demonstrated that when environmental conditions are
novel conditions. In a recent article, Tanaka et al.
(2003) use both a simulation and a mathematical model
1Corresponding author:Biochemistry and Molecular Biology, IBLS,
to investigate the dynamics of a changing environment
University of Glasgow, Glasgow G12 8QQ, United Kingdom.
where a single adaptive change increases adaptation to
E-mail: [email protected]
a particular environment. They demonstrate that the
2Present address:Centre for Ecology & Hydrology Banchory, Hill of
Brathens, Banchory, Kincardineshire AB31 4BW, Scotland. success of mutator clones is dependent on the initial
MODEL
frequency of mutators in the environment and show
that mutators can climb to dominance in stages, even The model developed here aims to explore the
inter-from low initial levels. actions between dispersal and mutators during adaptation
The natural environment is often complex, character- to constantly fluctuating environments in a two-patch
sys-ized by many different patterns of spatial and temporal tem. This study is parameterized using mutation rates,
variability (Herrerasilveira1994;Milleret al.1995; selective advantages, and costs of deleterious mutations
PickettandCadenasso1995;Chazdon1996), and this
that are consistent with those observed in long-term may have important implications for mutators. As de Visser
experiments with E. coli (Ninio 1991; Kibota and
points out in his recent review (de Visser 2002), the
Lynch1996). In each patch, the environment can be indirect selective benefit of mutator clones is dependent
in one of two states (0 and 1) and it regularly fluctuates on opportunities for adaptation. Novel environmental
between these states. Here, it is assumed that there are conditions that can provide such opportunities can arise
11 possible genotypes (0–10) and that type 0 is perfectly either by the environment rapidly changing in time or
adapted to environment state 0 while type 10 is perfectly through a spatially heterogeneous environment. In a
adapted to environment state 1. Conversely, type 10 is recent article we began to address the question of
tem-poorly adapted to environment 0, and type 0 has low
poral complexity (TravisandTravis2002) by
investi-fitness in environment state 1. Genotype 5 has equal gating the dynamics of mutators within environments
fitness in both environments. Each genotype repro-where conditions fluctuated with different frequencies.
duces according to its fitness relative to the mean fitness A key result to emerge is that mutators are most
preva-of the total population in its patch. This competition lent at an intermediate frequency of fluctuation. When
between genotypes is simulated according to the equa-the environment oscillates more rapidly, mutators are
tion found to be unable to provide sufficient adaptability
to keep pace with the frequent changes in selection
ga,d,m t⫹1 ⫽
ga,d,m t ⫻ fa,d,mt
兺
10a⫽0
兺
10d⫽0兺
1m⫽0(ga,d,mt ⫻fa,d,mt ) ⫻ D, pressure, and instead a population of “environmentalgeneralists” dominates. This work, along with most
other theoretical work concerned with the evolution of wherega,d,m
t refers to the densities of the different
geno-mutation rate or mutator dynamics, implicitly assumes types andfa,d,m
t to their fitness. Indicesaanddindicate,
that the environment is spatially homogeneous, an
as-respectively, the number of well-adapted and the num-sumption unlikely to be true for the environment
en-ber of deleterious alleles possessed by a genotype, and countered by many species.
mindicates whether the genotype is wild type or
muta-The role that spatial variation plays in the evolution
tor.Dis the total population density. of hypermutability is, as yet, a relatively unexplored area,
Mutations occur at a rate determined by the state of with no models developed. An important recent article
the mutator allele. The initial density of the mutator allele showing the colonization of the lungs of cystic fibrosis
is set to 0. Mutations can lead to genotypes that are
patients with a hypermutable strain ofPseudomonas
aeru-better (or more poorly) adapted to the current environ-ginosa (Oliver et al. 2000) emphasizes the need for
mental condition. A mutation results in a shift of ⫾1 to
clearer understanding of the role of spatial
heterogene-the genotype: thus mutations occurring to genotype 3 ity in the development of mutator clones. In this article
increase the density of genotypes 2 and 4. Ten mutations it is argued that the highly compartmentalized,
anatomi-are required for a shift from a genotype that is perfectly cally deteriorating nature of the lungs, as well as the
adapted to one environment to a genotype that is ideally challenges presented by the immune system and
antibi-suited to the other environment. The rates of mutation otic drug therapy, provides conditions suitable for the
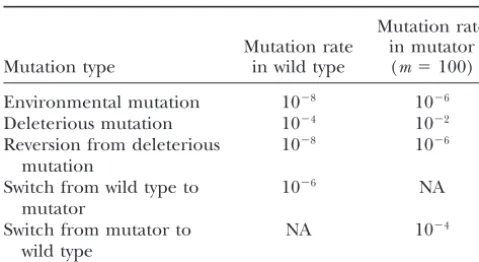
for wild-type clones are shown in Table 1. These rates are selection of the mutator clones. Thus, there is a need
multiplied by the mutator strength (m) in the mutator
to consider mutator dynamics in a spatially variable
envi-clones; the mutation rates for the baseline mutator ronment. In recent years, a considerable body of work
strength (m⫽ 100) are also shown in Table 1.
has been devoted to improving our understanding of the
The two patches fluctuate at the same frequencies consequences of spatial heterogeneity for both ecological
but out of phase with each other. The phase shift
(de-and genetical processes (PickettandCadenasso 1995;
grees by which patch 2 is behind patch 1) is set to
Lloyd and May1996; Bartonand Whitlock 1997;
between 0⬚and 360⬚. Dispersal occurs between the two
Barton2001; Whitlock2002). Perhaps the simplest
patches at a fixed rate, set between 0 and 0.2. Fitness theoretical spatial extension that allows for the
incorpo-of the population is calculated as the proportion incorpo-of the ration of spatial heterogeneity is a two-patch model
possible advantageous alleles that are present. Baseline (McPeek and Holt 1992; Holt and Hassell 1993).
parameters are fixed: each advantageous allele confers Here we develop such a model to investigate how
muta-a 0.05 benefit, emuta-ach deleterious muta-allele costs 0.05, muta-and tor dynamics are influenced by both spatial and
TABLE 1 with each other. Frequencies of fluctuation of 3000,
1000, and 500 gen⫺1have been chosen to represent low,
Mutation rates are shown for wild-type clones and for mutator
intermediate, and rapid rates of change, respectively. The
clones with the baseline mutator strength (m⫽100)
average mutator density in patch 1 is illustrated. In all cases the mutator density observed at zero rate of dispersal
Mutation rate
Mutation rate in mutator represents that achieved with simply temporal rather than
Mutation type in wild type (m⫽100) spatiotemporal variation. The Roman numerals I–VI
indi-cate the parameter space where dynamics are explored
Environmental mutation 10⫺8 10⫺6
further in theresultssection.
Deleterious mutation 10⫺4 10⫺2
Reversion from deleterious 10⫺8 10⫺6
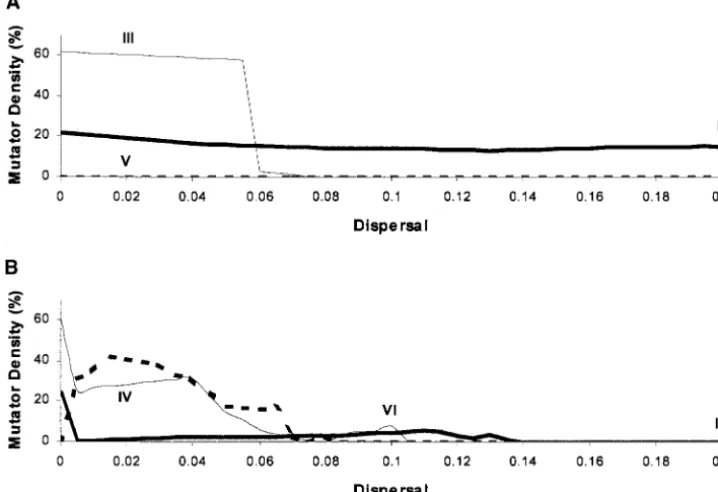
Figure 2A shows the effect of dispersal on the mutator
mutation density of patch 1, when patch 2 lags 72⬚behind patch 1.
Switch from wild type to 10⫺6 NA
The effect of dispersal on mutator density is dependent
mutator on the frequency at which the environment is
fluctuat-Switch from mutator to NA 10⫺4
ing. At low levels of fluctuation (e.g., 3000 gen⫺1)
dis-wild type
persal does not result in a dramatic change in mutator
NA, not applicable. density, with densities of between 15 and 25% observed.
At intermediate rates of fluctuation (e.g., 1000 gen⫺1)
as dispersal rises to 0.065 the mutator density remains high. As dispersal increases further the mutator density
RESULTS
drops to a near-zero value. At high levels of fluctuation
The effect of mutator clones on a temporally variable (e.g., 500 gen⫺1) the mutator density is at a very low
environment has been investigated in Travis and level at all dispersal rates.
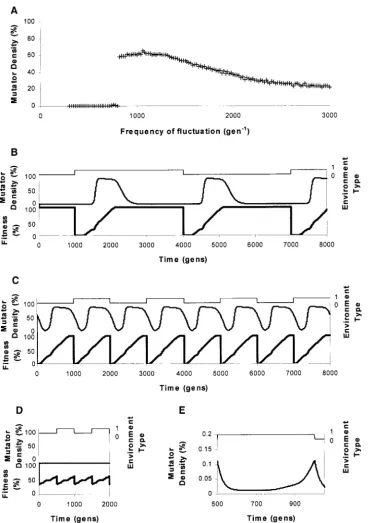
Travis(2002). Mutator density was shown to be depen- Figure 2B shows the effect of dispersal on the mutator
dent on the frequency of fluctuation of the environ- density of patch 1, when patch 2 lags 216⬚ behind
ment, as illustrated in Figure 1A. At rapid frequencies patch 1. Again the effect of dispersal on mutator density
of fluctuation only a small proportion of the population is observed to be dependent on the frequency at which
are mutator clones. At intermediate frequencies of fluc- the environment is fluctuating. At low levels of fluctuation
tuation the highest percentage of mutators is observed. (e.g., 3000 gen⫺1) at zero dispersal the mutator density is
Interesting dynamics, such as chaos and limit cycles, are at 23%. However, at nonzero dispersal the mutator density
observed within this parameter space (seeTravis and decreases to⬍5% at all rates of dispersal. At intermediate
Travis2002 for details). At lower frequencies of fluctu- rates of fluctuation (e.g., 1000 gen⫺1) the mutator
den-ation the mutator density is again lower. sity drops by over half as dispersal increases from zero
Figure 1B reveals that at low frequencies of fluctua- to 0.005. As dispersal rises to 0.035 the mutator density
tion (e.g., at 3000 gen⫺1) during each cycle of fluctuation rises slightly, after which it drops erratically to a
near-the mutator density initially rises until all of near-the popula- zero value at dispersal of 0.105. Time courses run in
tion is adapted to the current environment, at which this parameter space again reveal limit cycles and chaos
point mutator density drops again, resulting in a rela- (data not shown). At high levels of fluctuation (e.g., 500
tively low mutator density. Figure 1C illustrates how gen⫺1) the mutator density increases considerably from
during each cycle of fluctuation at an intermediate fre- a near-zero density at zero dispersal to a moderate
muta-quency of fluctuation (e.g., 1000 gen⫺1) the mutator tor density of 40% at 0.02 dispersal. As dispersal rates
density rises, with the environment switching before the further increase, the mutator density drops gradually
mutator density has fallen far, resulting in a high average to a near-zero value at dispersal rate of 0.08.
mutator density. Figure 1D shows that at rapid frequen- Effect of phase shift:The relationship between phase
cies of fluctuation (e.g., at 500 gen⫺1) the environment shift and mutator density was explored at a range of
dis-switches before mutator clones have had time to evolve, persal rates. Figure 3 graphs the results for rates of 0.02
resulting in low average mutator density. Figure 1E shows (Figure 3A), 0.1 (Figure 3B), and 0.2 (Figure 3C). The
the slight increase in mutator density that occurs each Roman numerals I–VI correspond to the same
parame-cycle, with a maximal mutator density of⬍0.15% reached. ters as in Figure 2 and are explored in more detail later.
This study shows that the role of mutators in evolution For both low and intermediate frequencies of
fluctua-can dramatically change when spatial variation of envi- tion, at all dispersal rates, the mutator density was
high-ronments is also considered. A two-patch spatial model est at phase shifts approaching 0⬚and 360⬚and lowest
has been chosen, with each patch experiencing the same at those phase shifts approaching 180⬚. As dispersal rates
rate of environmental fluctuation, although the patches increased, the width of the trough increased further. At
vary in phase. Dispersal occurs between the patches. high rates of fluctuation (e.g., 500 gen⫺1), however, the
Figure 2 shows the effect of varying the rate of dis- pattern observed is different. Two peaks of maximal
mutator density appear, centered around 180⬚. The size
Figure1.—Effect of varying the frequency of environmental fluc-tuation on mutator density. (A) Fluctuation frequencyvs. mutator density. B, C, and D show time courses with the environment type (top), percentage of mutator den-sity (middle), and percentage of fitness (bottom) against time (gen) represented. (B) A time course at 3000 gen⫺1. (C) A time course at
1000 gen⫺1. (D) A time course
at 500 gen⫺1. (E) A time course
showing environment type (top) and percentage of mutator density against time for a fluctuation fre-quency of 500 gen⫺1. Note that the
scale of mutator density is greatly enlarged compared with B, C, and D to illustrate that there is a very slight fluctuation of mutator den-sity at high frequencies of environ-mental change.
of these peaks is maximal at the lower dispersal rates spond to parameter values illustrated by the Roman
numerals I–VI, respectively, in Figures 2 and 3. and at the highest dispersal rate shown of 0.2 it is not
apparent. Figure 4, I and II, compares the time courses at low
frequency of fluctuation at phase shift 72⬚ (Figure 4I;
Time courses:To gain a better understanding of the
effect of dispersal and phase shift on mutator density, where both patches are of the same environment type
for the majority of the time) and phase shift 216⬚(Figure it is necessary to examine the variation of mutator
den-sity and fitness during each cycle of environmental fluc- 4II; where both patches are of differing environment
type for the majority of the time). For both time courses tuation. We have inspected a wide range of these time
courses, and six are shown here to illustrate the findings the dispersal is high at 0.2.
corre-Figure2.—Effect of varying dis-persal on the mutator density of patch 1, when patch 2 is out of phase. Shaded line, 3000 gen⫺1;
solid line, 1000 gen⫺1; thick dashed
line, 500 gen⫺1. I–VI, the positions
at which the time courses are per-formed. (A) Patch 2 is 72⬚behind the phase of patch 1. (B) Patch 2 is 216⬚behind the phase of patch 1.
are in the same environment type and results in an associ- 1, that the rise in mutator density occurs and produces
an acceleration in the increase in fitness. Patch 1 then ated rise in the rate of increase of fitness. However, in
Figure 4II the period when both patches are of the same switches environment type to type 0, and the mutator
density drops until a switch is made back to environment environment type is shorter and the mutator density
remains low. Note that the mutator densities for both type 1, when a sudden peak of mutator density occurs.
Due to the almost perpetual presence of mutator clones patches 1 and 2 are identical. This is consistent with the
symmetrical nature of Figure 3C around 180⬚. in patch 1 the fitness increases rapidly. Patch 2 remains
in environment type 1 after patch 1 has switched and Figure 4, III and IV, compares the time courses at
intermediate frequency of fluctuation at both a low rate experiences a continued high mutator density and
associ-of dispersal associ-of 0.02 (Figure 4III) and a moderate rate ated increase in fitness, until it too switches to environment
of dispersal of 0.1 (Figure 4IV). For each time course type 0. In Figure 4VI at moderate rates of dispersal the
the phase shift is 72⬚. mutator density remains at negligible levels throughout.
In Figure 4III at the lower rate of dispersal the muta-tor density rises when the two patches are of the same
environmental type. This results in an associated in- DISCUSSION
crease in the fitness of the patches to nearly 100%
fit-This study examined the role of spatial environmental ness. In Figure 4IV, however, where there is a moderate
variability and dispersal on mutator dynamics. The model rate of dispersal the mutator density increases only
frac-demonstrated that the density of mutator clones in a two-tionally when both patches are of the same
environmen-patch spatiotemporally variable environment is depen-tal type. The fitness levels fluctuate between 26 and
dent on three factors: frequency of fluctuation of the 74%, never reaching maximal fitness.
environment, rate of dispersal, and the period of time Figure 4, V and VI, compares the time courses at high
that both patches are in phase (i.e., the phase angle).
frequency of fluctuation at both a low rate of dispersal
These results emphasize the importance of considering of 0.02 (Figure 4V) and a moderate rate of dispersal of
the spatial population structure of mutators before mak-0.1 (Figure 4VI). For each time course the phase shift
ing judgments as to their likely role in, for example, is 216⬚.
the evolution of drug resistance. In Figure 4, V and VI, the patterns of both mutator
In a nonspatial model, the highest mutator densities density and fitness appear complex, due in part to the
are observed at intermediate frequencies, with lower two-part limit cycle occurring in both time courses;
how-densities of mutators seen at low rates of fluctuation and ever, trends are apparent. In Figure 4V, with a low rate
near-zero densities of mutator clones present at rapid of dispersal, it is again when the two patches are of the
Figure 3.—Effect of varying phase shifts on the mutator density of patch 1, when patch 2 is out of phase. Shaded line, 3000 gen⫺1;
solid line, 1000 gen⫺1; thick dashed
line, 500 gen⫺1. I–VI, the positions
at which the time courses are per-formed. (A) Dispersal, 0.02. (B) Dispersal, 0.1. (C) Dispersal, 0.2.
low frequencies of environmental change, the mutators density of mutators? If the patches are always in the same
environmental state as one another then unsurprisingly spread through the population following each
environ-mental fluctuation (hitchhiking on alleles that are well the results are identical to the nonspatial model
regard-less of the degree of dispersal between them. When the adapted to the current environment), allowing the
pop-ulation to adapt more rapidly to the new environment. patches are not always in the same environmental state,
one might intuitively expect dispersal between them to Once the population is well adapted, the mutator clones
are selected against, due to the higher rate at which they lessen the role of mutators. When one patch changes
state, it may receive immigrants from the other patch suffer from deleterious mutations. With intermediate rates
of fluctuation, the environment changes before the muta- that are already well adapted to the new conditions, and
hence mutators do not have a chance to establish. This tor density returns to a mutation: selection equilibrium,
resulting in the mutator density remaining high through- is exactly what we find when the environment fluctuates
slowly between the two states. Dispersal always reduces out time. Interesting mutator dynamics occur, with
sta-ble limit cycles and chaos observed at intermediate rates mutator density in a two-patch system if the patches
fluc-tuate slowly between two states and are out of phase of fluctuation. With even more rapid environmental
oscil-lation, mutator genotypes are unable to provide enough with one another. As the rate of dispersal increases then
in general we find a reduction in mutator density. genetic variability to keep track of the changing selective
pressures; consequently the mutators are present only at However, quite contrary to our initial expectations,
across a wide range of parameter space some dispersal low density within the population. A nonmutator genotype
that is reasonably adapted to both environments, an envi- actually increases mutator density. This occurs when the
environment fluctuates rapidly between the two states ronmental generalist, prevails at high rates of fluctuation.
Figure4.—Time courses of environment type (top), percentage of mutator den-sity (middle), and percent-age of fitness (bottom) against time (gen) are shown. Patch 1 is illustrated with a dashed line and patch 2 with a solid line. I. Frequency of fluctuation, 3000 gen⫺1; dispersal, 0.2;
phase shift, 72⬚. II. Fre-quency of fluctuation, 3000 gen⫺1; dispersal, 0.2; phase
shift, 216⬚. III. Frequency of fluctuation, 1000 gen⫺1;
dis-persal, 0.02; phase shift, 72⬚. IV. Frequency of fluctua-tion, 1000 gen⫺1; dispersal,
0.1; phase shift, 72⬚. V. Fre-quency of fluctuation, 500 gen⫺1; dispersal, 0.02; phase
shift, 216⬚. VI. Frequency of fluctuation, 500 gen⫺1;
dis-persal, 0.1; phase shift, 216⬚.
the patches are partially out of phase. Mutators occur switches state again. However, when space is
incorpo-rated then dispersal between the patches may have the only at very low density in a model without spatial
struc-ture at a high frequency of environmental variability. Un- effect of extending the period of time that mutators are
able to hitchhike on the backs of alleles that are well der these conditions mutators do not have long enough
in-Figure4.—Continued.
crease in one of the patches hitchhiking on alleles that other patch switches states, then the dispersing mutators
are able to continue increasing in density there, even are adapted to the prevailing state. Every generation some
of these mutators are dispersing to the other patch—let when conditions change in their original patch. Of
benefit in the same way through dispersal to the first pathogenicity of bacteria and also in the development of cancer. They may also accelerate the adaptation of patch. In general mutators are found at lower densities
bacteria to novel drug regimes, resulting in resistance. when the two patches fluctuate well out of phase with
Extending the spatial model of mutator dynamics pre-one another (Figure 3). When the patches are exactly
sented in this article has considerable potential. It may in phase the mutator dynamics are identical to those
be possible to coordinate drug delivery to infected indi-observed in a single isolated patch. When one patch lags
viduals in a manner that reduces the risk of increased just a little behind the other mutator density remains
pathogenesis or drug resistance. Similarly, the spatio-relatively high, but a critical phase shift exists at which
temporal pattern of pesticide regimes may be managed mutator density declines. The position of this critical phase
in such a way as to minimize the risk of mutators acceler-shift depends upon the degree of dispersal between the
ating the evolution of pesticide resistance. two patches. Mutator density declines when the patches
The work presented here has clearly demonstrated are further out of phase, as when a patch changes state
the need to consider the role played by spatial (as well the immigrants arriving from the other patch are
al-as temporal) environmental variability in the establish-ready better adapted to the new environmental
condi-ment and persistence of strains with high mutator den-tions, and there is less opportunity for mutators to
hitch-sity. This work has considered only regularly fluctuating hike to high densities.
environments and has been limited to a simple two-The complexity of the results, in particular at the high
patch model. There remains much to learn about muta-and intermediate frequencies of fluctuation where chaos
tors, and we hope that this article will encourage future and limit-cycles exist, justifies the choice of the
two-work—both empirical and theoretical—examining the patch system to examine the spatiotemporal dynamics.
role of spatial environmental variability as a potentially In a multipatch model the dynamics are liable to be
important determinant of both the prevalence and dy-even more complex and the interpretation of the results
namics of high-mutability clones. more challenging. Now that the two-patch model has
The authors thank the reviewers for their supportive and
construc-provided an insight into the dynamics of mutator clones
tive comments.
in a spatiotemporal variable environment, this could be expanded to investigate a multipatch environment. The temporal variance of the patches could also be altered
LITERATURE CITED
so that different patches are varying at different rates.
Our model is deterministic, and it deals in rates of Barton, N. H., 2001 The evolutionary consequences of gene flow
and local adaptation: future approaches, pp. 329–340 inDispersal,
mutation and dispersal. While this formulation can
pro-edited by E.Danchin. Oxford University Press, Oxford.
vide some useful predictions, a note of caution should
Barton, N. H., andM. C. Whitlock, 1997 The evolution of
metapo-be added. For many micrometapo-bes the nummetapo-ber of individuals pulations, pp. 188–210 inMetapopulations Dynamics: Ecology,
Genet-ics and Evolution, edited by M.Gilpin. Academic Press, San Diego.
in a population is often very large, and a deterministic
Chazdon, R. L., 1996 Spatial heterogeneity in tropical forest
struc-population can be expected to produce reasonable
pre-ture: canopy palms as landscape mosaics. Trends Ecol. Evol.11:
dictions of a population’s trajectory: demographic sto- 8–9.
de Visser, J., 2002 The fate of microbial mutators. Microbiology
chasticity is unlikely to be significant. However,
al-148:1247–1252.
though the population size may be very large, specific
Denamur, E., S. Bonacorsi, A. Giraud, P. Duriez, F. Hilaliet al.,
mutations can still be rare events, and this implies that 2002 High frequency of mutator strains among human
uro-pathogenic Escherichia coli isolates. J. Bacteriol.184:605–609.
genetic stochasticity might have an important role in
Drake, J. W., 1991 A constant rate of spontaneous mutation in
DNA-determining the dynamics of mutators within a
popula-based microbes. Proc. Natl. Acad. Sci. USA88:7160–7164.
tion. Recasting the model as an individual-based formu- Gillespie, J. H., 1981 Mutation modification in a random environ-ment. Evolution35:468–476.
lation dealing in probabilities of dispersal and mutation
Giraud, A., I. Matic, O. Tenaillon, A. Clara, M. Radmanet al.,
would be the preferred alternative. However, a fully indi- 2001 Costs and benefits of high mutation rates: adaptive evolu-vidual-based model of several million individuals living in tion of bacteria in the mouse gut. Science291:2606–2608.
Herrerasilveira, J. A., 1994 Spatial heterogeneity and seasonal
different patches would be stretching computer power
patterns in a tropical coastal lagoon. J. Coast. Res.10:738–746.
to the limit, although an approach that is a hybrid of Holt, R. D., andM. P. Hassell, 1993 Environmental heterogeneity
individual-based and frequency-based methods could and the stability of host parasitoid interactions. J. Anim. Ecol.
62:89–100.
present a useful way forward (Tenaillonet al. 1999).
Ishii, K., H. Matsuda, Y. IwasaandA. Sasaki, 1989 Evolutionarily
Here, we have presented the results of a simple strategic stable mutation-rate in a periodically changing environment.
Ge-model. This type of exercise is useful for providing some netics121:163–174.
Kibota, T. T., andM. Lynch, 1996 Estimate of the genomic
muta-general insights into a biological problem. There is a
tion rate deleterious to overall fitness in E-coli. Nature381:694–
very real need for this approach to be taken forward in 696.
a more applied way through the development of tactical Kimura, M., 1967 On the evolutionary adjustment of spontaneous
mutation rates. Genet. Res.9:23–34.
models designed to investigate the dynamics of
hyper-LeClerc, J. E., B. Li, W. L. PayneandT. A. Cebula, 1996 High
mutable strains in spatiotemporally complex environ- mutation frequencies amongEscherichia coliandSalmonella
patho-gens. Science274:1208–1211.
Leigh, E. G., 1970 Natural selection and mutability. Am. Nat.104: tator clones of Neisseria meningitidis in epidemic serogroup A disease. Proc. Natl. Acad. Sci. USA99:6103–6107.
301–305.
Leigh, E. G., 1973 The evolution of mutation rates. Genetics73: Sniegowski, P. D., P. J. GerrishandR. E. Lenski, 1997 Evolution of high mutation rates in experimental populations of E. coli. 1–18.
Lloyd, A. L., andR. M. May, 1996 Spatial heterogeneity in epidemic Nature387:703–705.
Sniegowski, P. D., P. J. Gerrish, T. JohnsonandA. Shaver, 2000 models. J. Theor. Biol.179:1–11.
Mao, E. F., L. Lane, J. LeeandJ. H. Miller, 1997 Proliferation of The evolution of mutation rates: separating causes from conse-quences. BioEssays22:1057–1066.
mutators in a cell population. J. Bacteriol.179:417–422.
Matic, I., 2000 Parallel evolution of pathogenic strains. Trends Mi- Taddei, F., M.Radman, J.MaynardSmith, B.Toupance, P. H. Gou-yonet al., 1997 Role of mutator alleles in adaptive evolution. crobiol.8:451.
Matic, I., M. Radman, F. Taddei, B. Picard, C. Doitet al., 1997 Nature387:700–702.
Tanaka, M. M., C. T. BergstromandB. R. Levin, 2003 The evolu-Highly variable mutation rates in commensal and pathogenic
Escherichia coli. Science277:1833–1834. tion of mutator genes in bacterial populations: the roles of envi-ronmental change and timing. Genetics164:843–854.
McPeek, M. A., andR. D. Holt, 1992 The evolution of dispersal
in spatially and temporally varying environments. Am. Nat.140: Tenaillon, O., B. Toupance, H. Le Nagard, F. Taddei andB. Godelle, 1999 Mutators, population size, adaptive landscape 1010–1027.
Miller, R. E., J. M. V. HoefandN. L. Fowler, 1995 Spatial hetero- and the adaptation of asexual populations of bacteria. Genetics geneity in eight central Texas grasslands. J. Ecol.83:919–928. 152:485–493.
Ninio, J., 1991 Transient mutators: a semiquantitative analysis of Tenaillon, O., H. Le Nagard, B. Godelle andF. Taddei, 2000 the influence of translation and transcription errors on mutation Mutators and sex in bacteria: conflict between adaptive strategies. rates. Genetics129:957–962. Proc. Natl. Acad. Sci. USA97:10465–10470.
Oliver, A., R. Canton, P. Campo, F. BaqueroandJ. Blazquez, 2000 Travis, J. M., andE. R. Travis, 2002 Mutator dynamics in fluctuating High frequency of hypermutable Pseudomonas aeruginosa in environments. Proc. R. Soc. Lond. Ser. B Biol. Sci.269:591–597. cystic fibrosis lung infection. Science288:1251–1253. Whitlock, M. C., 2002 Selection, load and inbreeding depression
Pickett, S. T. A., andM. L. Cadenasso, 1995 Landscape ecology— in a large metapopulation. Genetics160:1191–1202. spatial heterogeneity in ecological-systems. Science269:331–334.