Mapping Baroreceptor Function to Genome:
A Mathematical Modeling Approach
C. M. Kendziorski,*
,1A. W. Cowley, Jr.,
†A. S. Greene,
†H. C. Salgado,
‡H. J. Jacob
†and P. J. Tonellato
†,§*Department of Biostatistics and Medical Informatics, University of Wisconsin, Madison, Wisconsin 53706,†Department of Physiology
and§Informatics Research Center, Medical College of Wisconsin, Milwaukee, Wisconsin 53233 and‡Department of Physiology,
University of Sao Paulo, Sao Paulo 14049-900, Brazil
Manuscript received April 9, 2001 Accepted for publication January 11, 2002
ABSTRACT
To gain information about the genetic basis of a complex disease such as hypertension, blood pressure averages are often obtained and used as phenotypes in genetic mapping studies. In contrast, direct measurements of physiological regulatory mechanisms are not often obtained, due in large part to the time and expense required. As a result, little information about the genetic basis of physiological controlling mechanisms is available. Such information is important for disease diagnosis and treatment. In this article, we use a mathematical model of blood pressure to derive phenotypes related to the baroreceptor reflex, a short-term controller of blood pressure. The phenotypes are then used in a quantitative trait loci (QTL) mapping study to identify a potential genetic basis of this controller.
H
UMAN diseases can be studied through the ge- that is not summarized by the disease-defining measure-netic dissection of quantitative traits in experi- ments alone. Detailed knowledge of the genetic basis mental models such as mouse and rat. Such studies of a complex disease requires not only the identification have been carried out for diseases such as hypertension of disease-causing genes, but also knowledge about the (Jacobet al.1991;DengandRapp1992, 1995;Schork way in which these and other related genes act andet al.1995), diabetes (Toddet al.1991;Jacobet al.1992; interact to affect physiological mechanisms that in turn
Gauguier et al. 1996), colon cancer (Dietrich et al. influence all aspects of the end point data dynamics. 1993), and breast cancer (Shepelet al.1998;Lanet al. Such information is critical to the development of opti-2001). Studies of this type result in the association of mal methods of disease prevention, diagnosis, and con-a genome region with disecon-ase-defining mecon-asurements trol.
such as mean blood pressure, mean blood glucose level, One possible approach to gain insight into the genetic or tumor number. Such associations have proven useful. basis of intermediate mechanisms that affect disease For example, many quantitative trait loci (QTL) map- dynamics is to more closely combine physiological data ping studies have resulted in the identification of candi- with genetic studies. For example, data directly related date genes that can give insights into these diseases or to one or more physiological controlling mechanisms serve as therapeutic targets. could be used as phenotypes in a genetic linkage analy-Although useful, the information provided by QTL sis; then, any QTL identified would be directly related mapping methods is limited by the data collected and to the measured mechanism. The disadvantage to this the phenotypes defined. For example, data related to approach is that collecting such data can be time con-disease (end point data—e.g., blood pressure record- suming, expensive, and, in many cases, requires the ings) are often collected and disease-defining measure- development or implementation of protocols beyond ments (phenotypes—e.g., blood pressure recordings the scope of most traditional genetics labs. In this work, averaged over time) obtained and used in genetic map- we propose a method that provides information about ping studies. As a result, any QTL region identified may the genetic basis of physiological controlling mecha-contain genes affecting disease status, but no informa- nisms using only end point data. The method utilizes tion about intermediate physiological controlling mech- a mathematical model to relate end point data with anisms is obtained. In addition, there is no information physiological mechanisms. By fitting the model to end regarding the many physiological mechanisms that in- point data, phenotypes that quantify the defined physio-fluence distinct characteristics of the end point data
logical mechanisms are derived. The derived pheno-types are then used in a genetic linkage analysis study to connect genome location with physiological
mecha-1Corresponding author:Department of Biostatistics and Medical
In-nism.
formatics, University of Wisconsin, 1300 University Ave., 6785 MSC,
Madison, WI 53706. E-mail: [email protected] The method is used in a study of mean arterial
carotid sinus pressure deviation to level CSPdpis denoted
obtained. These quantifications are then used as
quanti-tative traits in a genetic linkage analysis to identify re- byg(CSPdp). Mathematically one can express this
rela-tionship as a relative change in response to sensed pres-gions of the rat genome that are correlated with
barore-ceptor activity. Since the parameters of the model sure deviation, (derived quantitative traits) capture detailed
physiologi-cal information associated with the baroreceptor re- g(CSPdp)⫽ X ss⫺Xcp
CSPdp⫺ CSPcp. (1)
sponse, regions of the genome identified by mapping
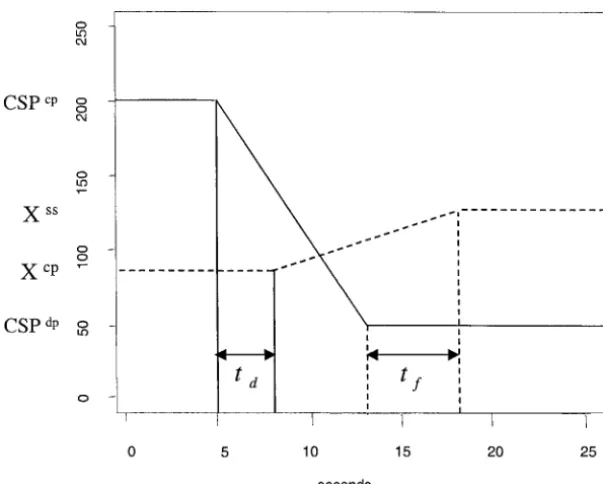
are considered to be involved in baroreceptor control. In the example demonstrated in Figure 1, g(CSPdp)⫽
The article is organized as follows. First, the barorecep- (130⫺90)/(50⫺200)⫽ ⫺0.27. Repeating such experi-tor reflex is defined and open-loop experiments, de- ments for different values of CSPdpgives a gain curve
signed to measure the strength of the baroreceptor re- such as that shown in Figure 2. One can deduce from flex response, are discussed. Second, a mathematical Figure 2 that the gain of a particular mechanism de-model of arterial pressure, which defines the direct rela- pends upon the distance between the carotid sinus pres-tionship between arterial pressure and the baroreceptor sure elevation (CSPdp) and the baseline pressure, (CSP),
response, is introduced and validated. The model is at which the mechanism has maximum gain. It is well then used to obtain a quantification of the baroreceptor known in physiological applications of control theory reflex response from normotensive, hypertensive, and that the gain curve associated with the baroreceptor intercross rat populations. Finally, the quantifications reflex can be approximated mathematically by the equa-for the intercross populations are used as quantitative tion below (Riggs1970):
traits in a genetic linkage analysis.
g(CSPdp)⫽Ce⫺(CSPdp⫺CSP)2. (2)
BARORECEPTORS Equation 2 implies that the response to CSPdpis
summa-rized by three parameters:C, which gives the strength The baroreceptors are nerve terminals in the carotid
of the maximum gain;, which is related to the range sinus and aortic arch that stabilize moment to moment
of sensed pressure to which the baroreceptors respond; blood pressure variability, but are not involved in
deter-and CSP, the equilibrium pressure around which the mination of the long-term level of arterial pressure
baroreceptors maintain arterial pressure. The shape of (Cowley 1992). The baroreceptors monitor arterial
the curve specified by Equation 2 (shown in Figure pressure levels by sensing deviations from some baseline
2) shows that the farther the sensed pressure is from pressure and initiating a response that dampens such
maximal gain, the smaller the relative effect of the baro-deviations. The response begins with impulses sent by
receptor response. the baroreceptors to the central nervous system, which
in turn initiates a sequence of events resulting in both neural and humoral responses that ultimately result in
MEAN ARTERIAL PRESSURE MODEL
a change in arterial pressure toward normal baseline
levels. The baroreceptor reflex response can be thought Data: Mean arterial pressure recordings were ob-tained from baroreceptor denervated and intact Wistar, of as a nonlinear controller whose efficacy can be
calcu-lated by conducting a series of experiments where the normal BN/MCW, hypertensive SS/MCW, and F2(BN/
MCW ⫻ SS/MCW) intercross rats. Recordings from pressure sensed by the baroreceptors and the arterial
pressure following baroreceptor response are main- Wistar rats differing only in their baroreceptor response were obtained as described in Fazan et al. (1997). In tained independently (open-loop experiments). To do
this, the carotid sinus (which contains the barorecep- particular, recordings were taken at a rate of 1 Hz from 16 rats: 8 baroreceptor denervated and 8 baroreceptor tors) is isolated and the carotid sinus pressure, or
barore-ceptor sensing pressure, is maintained at some level intact. Mean arterial pressure recordings were also ob-tained from an F2 population following a protocol
de-independent from the pressure of the entire system.
The conditioning pressure at which the carotid sinus is scribed in Cowleyet al. (2000). In short, male F2
off-spring were obtained from a cross between BN/MCW maintained before deviation is denoted by CSPcpand is
maintained in equilibrium with a level of pressure in and SS/MCW rats. Four-hour measurements of mean arterial pressure were collected at 100 Hz and averaged the system, denotedXcp. From this baseline, the carotid
Figure 1.—Stylized open-loop experiment. Solid line gives pressure in the carotid sinus, which is deviated from 200 mmHg to 50 mmHg. The corresponding mean arterial pressure (dashed line) rises from 90 mmHg to 130 mmHg.
and one afternoon (active phase) for 58 BN, 44 SS, and compartment nonlinear difference equation: The linear term describes the pressure in the absence of barorecep-113 F2 rats. Each of the F2 rats was genotyped at 231
simple sequence length polymorphism (SSLP) genetic tor control, while the other models the nonlinear effect of the baroreceptor response as measured by the gain. markers with an average spacing of 10 cM. Selective
genotyping was done, resulting in 92% of the rats with Mathematically, this model is expressed as some genotype information and 56% of the rats with
Xt⫽X⫹
兺
s
i⫽1
␣i(Xt⫺i⫺X)⫹g
冢
1 ta兺
tf
k⫽td Xt⫺k
冣冢
1 ta
兺
tf
k⫽td
Xt⫺k⫺Xbp
冣
⫹εt,at least 75% of the markers genotyped.
Development:A mathematical model was developed
(3) to concisely capture the direct effect of the baroreceptor
where εt ⵑ N(0, 2). In the absence of baroreceptor
reflex response on arterial pressure recordings. Unlike
control, the third term in Equation 3 is zero [zero gain other models of baroreceptor control that require
mea-givesg(·)⬅0], and the expected value ofXtisX. Thus,
surements from several experiments before quantitative
Xrepresents the average pressure value in the absence information can be obtained, in this model, a measure
of baroreceptor control. The delay of the baroreceptor of an animal’s baroreceptor activity is obtained using
response refers to the time lag between the change in only continuous recordings of arterial pressure. The
sensing pressure and the resulting change in arterial mean arterial pressure at any discrete timetis denoted
pressure due to responses initiated by the barorecep-byXt.Mean arterial pressure can be expressed as a
two-tors. The delay is denoted bytdand can be approximated
from an open-loop experiment such as that shown in Figure 1. Specifically,tdrepresents the time between the
two solid lines of Figure 1 (here,td⫽3). The length of
time that one particular sensed pressure value continues to influence a response of the baroreceptor reflex on the pressure is denoted byta. In Figure 1, the length of
time between the two dashed lines representstf⫽ta⫹ td ⫺ 1 (here, tf ⫽ 5, which gives ta ⫽ 3). The gain
function,g(·), is given by Equation 2 with CSP replaced by Xbp; Xbp represents the baseline pressure around
which the baroreceptor operates.
Parameter estimation and validation: Estimates of ta
and td were obtained from open-loop experiments in
Figure2.—Results of a gain calculating experiment (Ste- the rat (McKeown and Shoukas 1998). They are in phenson and Donald 1980) and approximation given by
agreement with estimates obtained in other studies
Equation 2. Note that it is standard to plot the gain curve on
(Allisonet al.1969;Jacobet al.1995). The order,s⫽3,
a scale from 0.0 to⫺1.0. Parameters were obtained using the
Figure 3.—Mean arterial pressure record-ings with baroreceptor denervated (BRD) and intact (BRI) are given at top left and bottom left, respectively. Model (Equation 3) output is given on the right.
uncontrolled pressure was obtained from standard time respectively. As an illustration of the model’s ability to reproduce the data, the time plots of one baroreceptor series analysis techniques (BoxandJenkins1970)
ap-plied to mean arterial pressure recordings from barore- denervated and one baroreceptor intact rat are shown in Figure 3 next to model simulations. The mean and ceptor denervated rats and through simulations of
vari-ous order models. In particular, for each data set, standard deviation of the baroreceptor denervated ex-perimental data are ⫽124.07 and ⫽ 17.39, while estimated autocorrelation and partial autocorrelation
functions (ACFs and PACFs) were generated and com- the corresponding mean and standard deviation of the simulated data are ⫽ 122.16 and ⫽ 16.88. In the pared with theoretical ACFs and PACFs from AR
pro-cesses of various orders. It can be shown that the ACF baroreceptor intact experimental data, the mean and standard deviation are ⫽121.99 and ⫽5.95, com-of an AR process com-of order s tails off slowly whereas
the PACF drops to zero beyond order s. The Akaike pared with ⫽121.38 and ⫽5.90 in the simulated data. These simulations indicate that the model is capa-information criterion (AIC) was also used to compare
models of varying orders (Akaike1974). The AIC pro- ble of reproducing the dynamics of blood pressure in both baroreceptor denervated as well as baroreceptor vides a balance between goodness of fit of a model to
data and the number of model parameters. The nonlin- intact animals.
For the parental strains, the means and standard devi-ear regression algorithm nls in S-plus (MathSoft1997)
was used to obtain estimates for all remaining unknown ations averaged over each of the recordings, along with standard errors, are (117.73⫾2.29) and (8.65⫾0.45) parameters ({␣i}si⫽1,X,C,Xbp, and).
The model given by Equation 3 was fit to mean arterial for the BN and (180.40⫾5.46) and (10.13⫾0.54) for the SS strains, respectively. The time plots of pressure pressure recordings from baroreceptor denervated and
intact rats, the parental populations, and the derived F2 recordings from two parentals, their correlation
func-tions, and their spectra (log-log scale) are shown in population. Using the estimated parameters,
simula-tions of the model were generated for each recording Figure 4 next to model simulations. As Figure 4 indi-cates, the physiologically based model captures distinct and compared with the original. Comparisons were
done in the time, correlation, and frequency domains features between the normal and hypertensive popula-tions. The first two moments for the BN and SS re-by considering time plots, antocorrelation functions,
and spectra (Box and Jenkins 1970). Residuals were cordings are (,)BN⫽ (101.70, 5.21) and (,)SS⫽
(198.03, 11.16); for the corresponding simulations, (, checked for time dependence and normality.
The means and standard deviations averaged over )BNsim⫽(101.53, 5.32) and (,)SSsim⫽(198.16, 11.49).
Qualitative characteristics in the time plots, as well as each of the eight recordings from the denervated and
intact rat populations, along with standard errors, are the mean and standard deviation, are preserved in the model simulations. There is significant estimated auto-(123.72⫾5.73) and (18.52⫾1.58) for the denervated
Figure4.—Mean arterial pressure recordings from a respective BN and SS rat. Time plots (top), autocorrelation functions (middle), and spectra (log-log scale, bottom) are shown.
and power concentration near the origin in the spectra is lower. These results are clearly shown in experimental studies that measure the baroreceptor reflex response of the arterial pressure recordings. These properties are
also evident in the corresponding model simulations. directly (StephensonandDonald1980;Angell-James
and George 1980; Brunner and Kligman 1992). In For the F2population, the averaged means and standard
deviations, along with standard errors, are (133.79⫾ addition, the estimated averages of arterial pressure without baroreceptor control [XBN ⫽ 124.22 (3.32),
1.26) and (10.10⫾ 0.23). Characteristics of the F2
re-cordings resembled those present in the parental popu- XSS⫽179.93 (6.78)] are slightly greater than the
corre-sponding averages with control [Xbp
BN ⫽ 114.48 (4.52),
lations and model reproducibility for any given
re-cording was similar to that shown in Figure 4. Xbp
SS⫽175.43 (6.29)]. This is consistent with a number
of studies that have demonstrated that mean arterial pressure increases only slightly following baroreceptor
QUANTIFICATION AND MAPPING OF denervation (for a review, seeCowley1992).
BARORECEPTOR RESPONSE
Since recordings are taken on 3 different days, each of the four quantifications for each F2was averaged over
By fitting the model to each arterial pressure
re-the 3 days to give four average phenotypes:X,C,Xbp,
cording, a characterization of mean arterial pressure
and (average not denoted). The distributions of X
(X)and a quantification of baroreceptor response (C,
andXbp were well approximated by Gaussian distribu-Xbp,) is obtained. Averages of the estimates ofC,Xbp,
tions and did not require transformation. The pheno-and calculated over the parental populations (BN,
typeC was scaled (multiplication by negative one and
N ⫽ 58; SS, N ⫽ 44) areCBN ⫽ ⫺0.53 (0.27), XbpBN ⫽
addition of a constant) so that all values were positive. 114.48 (4.52),BN⫽1.54 (0.70), andCSS⫽ ⫺0.29 (0.18),
The resulting distribution and the distribution ofwere
Xbp
SS⫽175.43 (6.29),SS⫽1.32 (0.43); standard errors
Poisson like, and thus square roots were taken to stabi-are shown in pstabi-arentheses. Thus, compstabi-ared with the
lize the variance and approximate Gaussian-distributed hypertensive SS population, the average maximum gain
phenotypes (McCullaghandNelder1989).Ctransand
is stronger in the BN population and the average value
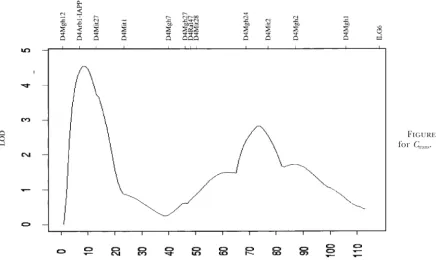
Figure 5.—LOD profile forCtrans.
analysis was conducted (Mapmaker/EXP 3.0b,Lander point pressures and diminished responses, animals with deficient baroreceptors show an increase in blood
pres-et al.1987;Lincolnet al.1993a; and Mapmaker/QTL 1.1,Lincoln et al.1993b) on X,Xbp,C
trans, andtransto sure variability (see Figure 2 andCowley et al.1973).
This region of the genome linked to baroreceptor re-determine if the physiologically based traits are
geneti-cally informative. To ensure that the transformations sponse seems to be related to blood pressure variation. With zero, one, and two copies of the SS allele atD4Arb1, themselves did not result in spurious LODs,
nonpara-metric scans (KruglyakandLander1995) were also the average standard deviations of the blood pressure recordings are 8.76, 9.92, and 10.89, respectively. The done on the untransformed phenotypesCand.
Analy-sis ofCtranslinked it to chromosome 4 (D4Arb1region) differences between groups are not statistically
signifi-cant, indicating that the baroreceptor response affects, with a LOD of 4.6 (Figure 5); the nonparametric scan of
Cwas very similar and identified the same peak region. but is not completely characterized by, blood pressure variation. Finally, this region has not been previously Permutation tests as described in Churchill and
Doerge (1994) were used to verify that this LOD is linked with any blood pressure-related phenotypes. This is not surprising considering the fact that most studies in fact statistically significant. Specifically, phenotypes
were randomly reassigned to the marker genotype vec- have focused on average arterial pressure, and the baro-receptor response does not set the long-term level of tors by permutation and LOD profiles were
recom-puted. This was repeated 1000 times. The 95th (99th) mean pressure, but rather affects short-term dynamics (Cowleyet al.1973).
percentile of the permutation distribution of maximum
LOD scores was 3.8 (4.3). Since the baroreceptor does not determine the long-term level of average arterial pressure, the average arte-Figure 6 shows gain curves averaged over animals
grouped by genotype at markerD4Arb1.The set point rial pressure is expected to be similar in animals with and without baroreceptor control. In terms of the model pressure in the homozygous SS group is higher than
the BN group and the average maximum of the gain parameters, Xbp (the set point or average pressure
around which the baroreceptor reflex controls pres-curve is lower. This indicates that the baroreceptor
re-flex operates around a higher pressure in the homozy- sure) and X (the average pressure in the absence of baroreceptor control) should be similar. This is the case gous SS rats, with a diminished response. As discussed
above, this qualitative behavior is consistent with experi- numerically, and both phenotypes map to the same genome region. Specifically,Xbpwas linked to
chromo-mental studies of the baroreceptor reflex in
normoten-sive and hypertennormoten-sive animals and further validates the some 10, in a region associated with average arterial pressure and the angiotensinogen converting enzyme model. The gain curves for the heterozygous animals
were similar to the SS group, indicating that the effect (Jacobet al.1991;DengandRapp1992, 1995;Kovacs
Figure6.—Gain curves aver-aged over subsets of rats with genotypes BN/BN and SS/SS at marker D4Arb1.
Xwas also linked to this region with a suggestive LOD sistent. For these reasons, it seems that the model is capable of quantifying baroreceptor dynamics. How-of 2.74. This is further indication that the model
param-eters are accurately quantifying the components they ever, it should be noted that open-loop experiments on each animal were not conducted to directly quantify the were defined to quantify.
baroreceptor reflex. As a result, the exact connection between the derived traits and the baroreceptor reflex
DISCUSSION
was not definitively confirmed.
The two traits defined to measure mean arterial pres-This study has shown how a mathematical model of
arterial pressure can be used to obtain genetically infor- sure (Xand Xbp) map to chromosome 10 in a region
(ACE) known to be associated with blood pressure. The mative quantitative traits related to the baroreceptor
reflex, a physiological mechanism that affects arterial derived phenotype C mapped to chromosome 4 be-tween markers D4Mgh12 and D4Mit1. Recall that C
pressure. A mathematical model is certainly not
re-quired to obtain such information. For example, one quantifies the magnitude of the baroreceptor reflex response. No pressure-related phenotypes have been could perform a series of experiments to directly
calcu-late the gain of the baroreceptor reflex response and mapped to this region previously. This is not surprising considering the fact that the baroreceptor response use the gain of each animal as a phenotype in a similar
study. However, such experiments are time consuming does not set the long-term level of pressure, but rather affects short-term dynamics. This region of chromosome and expensive. In addition, when phenotyping an
ani-mal, one often wants to collect as many phenotypes as 4 is homologous to mouse chromosome 6 and human chromosome 12 (12p12–2p14), which contain two genes possible, and conducting an extensive series of
experi-ments to obtain a single phenotype can reduce the num- of interest: IAPP and CCHL1A1 (also symbolized as CACNL1A1 and CACNA1C). The IAPP gene is known to ber of additional phenotypes that can be collected.
Fur-thermore, in other populations such as human, directly encode islet amyloid polypeptide (IAPP), a polypeptide secreted by the pancreas. It is deposited as pancreatic obtaining such information is not feasible. In such cases,
where it is difficult or impossible to measure particular islet amyloid in 90% of patients with noninsulin-depen-dent diabetes mellitus (NIDDM;Clarket al.1996) and phenotypes, a mathematical model can be used.
The model of mean arterial pressure presented here has also been associated with insulin dependent diabe-tes (IDDM;Karlsson et al.1996). Interestingly, there was developed to measure the effect of the baroreceptor
reflex response on the pressure. Simulations indicated are numerous studies demonstrating a decline in baro-receptor reflex activity in subjects with IDDM (Weston
that the model was capable of capturing the dynamics of
arterial pressure under varying physiological conditions. et al. 1996a,b, 1998; Jensen-Urstad et al. 1999) or NIDDM (Pamidimukkala and Jandhyala 1996). In addition, model simulations and the model-based
con-Gurtu, S., S. Shukla, D. MukerjeeandS. Khattri,2000 Effect of
first evidence of candidate genes that may be contribut- calcium channel blockers on baroreceptor reflex in anaesthetized
cats. Pharmacol. Res.42(1): 101–105.
ing to the baroreceptor reflex. More generally, this study
Jacob, H. J., K. Lindpaintner, S. E. Lincoln, K. Kusumi, R. K. Bunker
has shown how a mathematical model describing end
et al., 1991 Genetic mapping of a gene causing hypertension in
point data (such as arterial pressure recordings) can be the stroke-prone spontaneously hypertensive rat. Cell67:213–224.
Jacob, H. J., A. Pettersson, D. Wilson, Y. Mao, A. Lernmarket al.,
used to quantify physiological reflexes that affect or
1992 Genetic dissection of autoimmune type I diabetes in the
determine the end point when directly obtaining such
BB rat. Nat. Genet.2:56–60.
information is not feasible. By using the quantifications Jacob, H. J., A. Ramanathan, S. G. Pan, M. J. Brody andG. A.
Myers,1995 Spectral analysis of arterial pressure lability in rats
as derived phenotypes, one can obtain information about
with sinoaortic deafferentation. Am. J. Physiol.269:1481–1488.
the genetic basis of physiological controlling mechanisms
Jensen-Urstad, K., P. ReichardandM. Jensen-Urstad,1999
De-affecting end points of interest. Such an approach can creased heart rate variability in patients with type 1 diabetes
mellitus is related to arterial wall stiffness. J. Intern. Med.245(1):
help to increase our understanding of intermediate
phe-57–61.
notypes and the basic biology underlying disease
patho-Karlsson, E., M. StridsbergandS. Sandler,1996 Islet amyloid
genesis. polypeptide secretion from pancreatic islets isolated from
non-obese diabetic (NOD) mice. Regul. Pept.63(1): 39–45. We are grateful for the contributions from the laboratories of A. W.
Kovacs, P., B. VoightandI. Klo¨ ting,1997 Novel quantitative trait Cowley, Jr., and H. J. Jacob at the Medical College of Wisconsin. In
loci for blood pressure and related traits on rat chromosome 1, particular, Mary Kaldunski (Cowley) coordinated all blood pressure 10, and 18. Biochem. Biophys. Res. Commun.235:343–348. time series collection and Monika Stoll ( Jacob) was instrumental in Kruglyak, L.,andE. S. Lander,1995 A nonparametric approach building the linkage map. for mapping quantitative trait loci. Genetics139:1421–1428.
Lan, H., C. M. Kendziorski, J. D. Haag, L. A. Shepel, M. A. Newton
et al., 2001 Genetic loci controlling breast cancer susceptibility in the Wistar-Kyoto rat. Genetics157:331–339.
LITERATURE CITED Lander, E., P. Green, J. Abrahamson, A. Barlow, M. J. Dalyet al.,
1987 MAPMAKER: an interactive computer package for
con-Akaike, H.,1974 A new look at statistical model identification. IEEE
structing primary genetic linkage maps of experimental and natu-Trans. Automat. ControlAU-19:716–722.
ral populations. Genomics1:174–181.
Allison, J. L., K. Sagawa andM. Kumada,1969 An open-loop
Lincoln, S., M. DalyandE. Lander,1993a Constructing genetic analysis of the aortic arch barostatic reflex. Am. J. Physiol.217(6):
linkage maps with MAPMAKER/EXP 3.0b, Ed. 3. Whitehead 1576–1584.
Institute Technical Report. Whitehead Institute for Biomedical
Angell-James, J. E.,andM. J. George,1980 Carotid sinus
barore-Research/MIT Center for Genome Research, Cambridge, MA. ceptor reflex control of the circulation in medial sclerotic and
Lincoln, S., M. DalyandE. Lander,1993b Mapping genes control-renal hypertensive rabbits and its modification by the aortic
baro-ling quantitative traits using MAPMAKER/QTL 1.1b, Ed. 2. receptors. Circ. Res.47(6): 890–901.
Whitehead Institute Technical Report. Whitehead Institute for
Box, G. P.,andG. Jenkins,1970 Time Series Analysis: Forecasting and
Biomedical Research/MIT Center for Genome Research, Cam-Control.Holden-Day, San Francisco.
bridge, MA.
Brunner, M. J., andM. Kligman,1992 Rapid resetting of
baro-MathSoft,1997 S-PLUS Guide to Statistical and Mathematical Analysis. reflexes in hypertensive dogs. Am. J. Physiol.262:H1508–H1514.
McCullagh, P.,andJ. A. Nelder,1989 Generalized Linear Models.
Churchill, G. A.,andR. W. Doerge,1994 Empirical threshold
Chapman & Hall, New York. values for quantitative trait mapping. Genetics138:963–971.
McKeown, K. P., andA. A. Shoukas, 1998 Chronic isolation of
Clark, A., S. B. Charge, M. K. BadmanandE. J. deKoning,1996
carotid sinus baroreceptor region in conscious normotensive and Islet amyloid in type-2 (NIDDM) diabetes. APMIS104(1): 12–18.
hypertensive rats. Am. J. Physiol.275:H322–H329.
Cowley, A. W., Jr.,1992 Long-term control of arterial blood
pres-Pamidimukkala, J.,andB. S. Jandhyala,1996 Evaluation of hemo-sure. Physiol. Rev.72(1): 231–300.
dynamics, vascular reactivity and baroreceptor compensation in
Cowley, A. W., Jr., J. F. Laird, Jr.andA. C. Guyton,1973 Role
the insulin resistant Zucker obese rats. Clin. Exp. Hypertens. of the baroreceptor reflex in daily control of arterial blood
pres-18(8): 1089–1094. sure and other variables in dogs. Circ. Res.32:564–576.
Powers, P. A., R. G. Gregg, P. A. Lalley, M. LiaoandK. Hogan, Cowley, A. W., Jr., M. Stoll, A. S. Greene, M. L. Kaldunski, R. J.
1991 Assignment of the human gene for the alpha-1 subunit
Romanet al., 2000 Genetically defined risk of salt sensitivity in
of the cardiac DHP-sensitive Ca(2⫹) channel (CCHL1A1) to an intercross of Brown Norway and Dahl S rats. Physiol. Genomics
chromosome 12p12-pter. Genomics10:835–839. 2:107–115.
Riggs, D. S.,1970 Control Theory and Physiological Feedback Mechanisms.
Deng, Y., and J. P. Rapp,1992 Cosegregation of blood pressure
Waverly Press, Baltimore. with angiotensin converting enzyme and atrial natriuretic peptide
Schork, N. J., J. E. Krieger, M. R. Trolliet, K. G. Franchini, G.
receptor genes using Dahl salt-sensitive rats. Nat. Genet.1:267–
Koikeet al., 1995 A biometrical genome search in rats reveals 272.
the multigenic basis of blood pressure variation. Genome Res.
Deng, Y.,andJ. P. Rapp,1995 Locus for the inducible, but not a
5:164–172. constitutive, nitric oxide synthase cosegregates with blood
pres-Shepel, L. A., H. Lan, J. D. Haag, G. M. Brasic, M. E. Gheenet al., sure in Dahl Salt sensitive rat. J. Clin. Invest.95:2170–2177.
1998 Genetic identification of multiple loci that control breast
Dietrich, W. F., E. S. Lander, J. S. Smith, A. R. Moser, K. A. Gould
cancer susceptibility in the rat. Genetics149:289–299. et al., 1993 Genetic identification of Mom-1, a major modifier
Stephenson, R. B.,andD. E. Donald,1980 Reflexes from isolated locus affecting Min-induced intestinal neoplasia in the mouse.
carotid sinuses of intact and vagotomized conscious dogs. Am. Cell75:631–639.
J. Physiol.238:H815–H822.
Fazan, R., Jr., J. A. Castania, G. Ballejo, M. C. SalgadoandH. C.
1991 Genetic analysis of autoimmune type I diabetes mellitus Jameset al., 1996b Assessment of baroreceptor-cardiac reflex in mice. Nature351:542–547. sensitivity using time domain analysis in patients with IDDM and
Uechi, M., K. Asai, N. SatoandS. Vatner,1998 Voltage-dependent the relation to left ventricular mass index. Diabetologia39(11): calcium channel promoter restores baroreflex sensitivity in con- 1385–1391.
scious dogs with heart failure. Circulation98(13): 1342–1347. Weston, P. J., M. A. James, R. B. Panerai, P. G. McNally, J. F. Potter Weston, P. J., M. A. James, R. B. Panerai, P. G. McNally, J. F. Potter et al., 1998 Evidence of defective cardiovascular regulation in et al., 1996a Abnormal baroreceptor-cardiac reflex sensitivity insulin-dependent diabetic patients without clinical autonomic is not detected by conventional tests of autonomic function in dysfunction. Diabetes Res. Clin. Pract.42(3): 141–148. patients with IDDM. Clin. Sci.91(1): 59–64.