TEM/HRTEM, SAD, and SEM. Large grain sizes reduce GB area, allowing for more
precipitation in the matrix and reduced susceptibility to GB cracking. Precipitates were
shown to play a critical role in the toughening and strengthening of the alloy, with different
deformation modes observed for and ’. Dispersed particles were associated with ductile
failure, and inclusions were associated with ductile and shear failure.
Computational modeling using a dislocation density based crystalline plasticity finite
element framework was focused on the dispersed particles because of the direct relationship
to failure as observed by experimental characterization. An aluminum aggregate was
modeled in quasi-static plane strain tension and compression to investigate the effects of
dispersed particles and plastic deformation on numerical instabilities. Both local plastic
deformation and the presence of these dispersed particles can trigger hourglass instabilities,
caused by the difference in the deformability of neighboring elements and the energy modes
associated with hourglassing. Therefore, hourglass controls are necessary to accurately
A new formulation based on an eigenstrain representation of Orowan looping was
also developed, and it was coupled with the dislocation density based crystalline plasticity
finite element framework to model the unrelaxed plastic strain and interfacial behavior
associated with the dispersed particles in high strength aluminum alloys. This representation
accounts for the increased stresses associated with Orowan looping at interfacial regions
associated with extra half-planes of atoms, and for plastic relaxation using the
incompatibilities in lattice rotations between the particles and the alloy matrix. Predictions
indicate that the orientations and morphologies of the particles with respect to the most active
slip plane are critical factors in the relaxation of the eigenstrains associated with the loops.
These interfacial effects of the dispersed particles on the dynamic deformation of high
strength aluminum alloys were also investigated as a function of particle size, spacing, and
volume fraction, and grain boundary (GB) misorientations. Particle spacing had a significant
effect on the shear slip distribution, with localization occurring between the particles for
smaller particle spacing. The eigenstress fields associated with the larger particles led to
longer-range interaction of pressure fields, which can promote void coalescence for nucleated
voids at the particle-matrix interfaces. GB misorientation had a significant effect on the
behavior associated with the particles, with plastic shear slip localizing at the particle-matrix
interfaces for low angle GB misorientations, and at GBs and GB junctions for high angle
misorientations.
The interrelated effects of dispersed particle interfaces and GB misorientations on the
dynamic deformation of high strength aluminum alloys were investigated by modeling an
aluminum tri-crystal with different distributions of dispersed particles and GB
between grains.
© Copyright 2011 by William Morgan Lee
Doctor of Philosophy
Mechanical Engineering
Raleigh, North Carolina
2011
APPROVED BY:
_______________________________ ______________________________
Professor Mohammed A. Zikry Professor Kara Peters
Committee Chair
_______________________________ _____________________________
ii
DEDICATION
iii
receiving the 2006 Bo Rein award for a vital contribution in an unsung role, an award first
won by head coach Chuck Amato. He received a Bachelor of Science Degree in Mechanical
Engineering from NC State in the spring of 2006.
William stayed at NC State for graduate studies, earning a Master of Science degree
in Mechanical engineering under advisor Professor Mohammed A. Zikry in the spring of
2008. He was awarded a Department of Defense National Defense Science and Engineering
Fellowship in 2008. He also earned a Master of Materials Science and Engineering degree in
the spring of 2010. The research relating to this dissertation has generated the following
research papers and proceedings:
Elkhodary, K.I., Lee, W.M., Cheeseman, B., Brenner, D.W., and Zikry, M.A., “High Strain-Rate Behavior of High Strength Aluminum Alloys,” Mater. Res. Soc. Symp. Proc. Vol. 1137. 1137-EE05-31
Elkhodary, K.I., Lee, W.M., Cheeseman, B., Sun, L., Brenner, D.W., and Zikry, M.A., “The Effects of Precipitates and Mn-bearing Particles on the High Strain-Rate Compression of High Strength Aluminum,” Mater. Res. Soc. Symp. Proc. Vol. 1225. 1225-HH04-08
iv
Lee, W.M., and M.A. Zikry, “Microstructural Characterization of a High Strength Aluminum Alloy Subjected to High-Strain-Rate Impact,” Metallurgical and Materials Transactions A. Vol. 42, No. 5, May 2011
Salem, H.A.G., Lee, W.M., Bodelot, L., Ravichandran, G., and Zikry, M.A., “Quasi-Static and High Strain-Rate Experimental Microstructural Investigation of a High Strength Aluminum Alloy,” Submitted.
Lee, W.M., and M.A. Zikry, “Microstructurally Induced Hourglass Modes,” Submitted. Lee, W.M., and M.A. Zikry, “Modeling the Interfacial Plastic Strain Incompatibilities
Associated with Dispersed Particles in High Strength Aluminum Alloys,” Submitted. Lee, W.M., and M.A. Zikry, “High Strain-Rate Modeling of the Interfacial Effects of
Dispersed Particles in High Strength Aluminum Alloys,” Submitted.
Lee, W.M., and M.A. Zikry, “Dispersed Particle and Triple Junction Interactions in Aluminum Alloys,” Submitted.
v
Professor Kara Peters and Professor Alina Chertock, and my PhD committee members, Professor Kara Peters, Professor Jeffrey Eischen, and Professor Donald Brenner, along with my co-workers under Professor Zikry, James Pearson, Jibin Shi, Tarek Hatem, Omid Rezvanian, Khalil Elkhodary, Pratheek Shanthraj, Siqi Xu, Prasenjit Khanikar, Drew LaBarbera, Letisha McLaughlin, Zach Hester, Shoayb Ziaei, and Qifeng Wu. Also, none of this would have been possible without the support and guidance of Dr. Bryan Cheeseman at the Army Research Laboratory, Dr. Alex Cho at ALCAN/ATI, Dr. Bruce Lamattina at the Army Research Office, and Dr. James Wargo at JIEDDO.
vi
constituent elements; and Dr. Tom Rawdanowicz for his teaching, support, and guidance with the TEM.
I am extremely thankful to everyone that made this educational experience possible. This includes all of my teachers in Fuquay-Varina from elementary to high school who prepared me so well for a college education, and all of my professors at NC State. I would like to thank all of my coaches for believing in me, which opened MANY doors for me and allowed me the opportunities that have led me to where I am today. I would like to thank the organizations and people that funded my graduate education, including JIEDDO and the U.S. Army Research Office Grant No. ARO W911 NF-06–1–0472, the DoD NDSEG Fellowship, the Warren-Wolfpack Club Postgraduate Fellowship, the ACC Postgraduate Fellowship, and those that funded my undergraduate education, the NCSU football scholarship, the TYCO scholarship, the National Football Foundation and College Hall of Fame Triangle Chapter High School Scholar Athlete award, and, last but not least, my parents.
vii
2.2 Experimental Methods ... 11
2.2.1 Projectile Impact of a 1.5” (38 mm) plate... 11
2.2.2 Split Hopkinson Impact of Shear Compression Specimens ... 13
2.3 Results and Discussion-Projectile Impact... 13
2.3.1 Damage Modes ... 13
2.3.2 Microstructural Characteristics... 14
2.3.2.1 Grain Morphology ... 14
2.3.2.2 Dispersed Particles and Inclusions... 15
2.3.2.3 Precipitates... 17
2.4 Results and Discussion-Split Hopkinson... 19
2.5 Conclusions... 20
References—Chapter 2 ... 22
Tables and Figures—Chapter 2 ... 24
Chapter 3: Dislocation Density Based Crystalline Plasticity Constitutive Formulation ... 41
3.1 Multiple Slip Crystal Plasticity Kinematics... 41
3.2 Dislocation Density Evolution... 44
References—Chapter 3 ... 48
Tables and Figures—Chapter 3 ... 49
Chapter 4: Numerical Methods... 50
4.1 Determination of the Total Velocity Gradient ... 50
4.2 Determination of the Plastic Velocity Gradient... 52
4.3 Solution of Systems of ODE’s... 53
References—Chapter 4 ... 55
Chapter 5: Microstructurally Induced Hourglass Modes... 56
5.1 Introduction... 56
5.2 Approach—Measure of Hourglass Modes... 58
5.3 Results... 58
5.3.1 Microstructural Representation... 58
5.3.2 Effect of Matrix Deformation ... 59
5.3.3 Effects of Dispersed Particles ... 60
viii
5.4 Conclusions... 64
References—Chapter 5 ... 65
Tables and Figures—Chapter 5 ... 66
Chapter 6: Orowan Looping and Plastic Relaxation in Crystalline Plasticity Finite Element Analysis... 75
6.1 Introduction... 75
6.2 Approach... 78
6.2.1 Orowan Looping ... 78
6.2.2 Verification of Eigenstrain Representation... 78
6.2.3 Representation of Plastic Relaxation ... 80
References—Chapter 6 ... 84
Tables and Figures—Chapter 6 ... 87
Chapter 7: Quasi-static Modeling of the Interfacial Plastic Strain Incompatibilities Associated with Dispersed Particles in High Strength Aluminum Alloys ... 92
7.1 Introduction... 92
7.2 Results... 92
7.2.1 Microstructural Representation... 92
7.2.2 Single Particle: Model 1... 94
7.2.3 Orientation Effects: Model 2 ... 95
7.2.4 20 Grain Aggregate: Model 3 ... 97
7.3 Conclusions... 98
References—Chapter 7 ... 100
Tables and Figures—Chapter 7 ... 101
Chapter 8: High Strain-Rate Modeling of the Interfacial Effects of Dispersed Particles in High Strength Aluminum Alloys... 114
8.1 Introduction... 114
8.2 Results... 114
8.2.1 Microstructural Representation... 114
8.2.2 Single Grain ... 116
8.2.2.1 Particle Spacing Effects ... 116
8.2.2.2 Particle Size Effects ... 117
8.2.2.3 Volume Fraction Effects ... 118
8.2.3 Polycrystalline Aggregate and Dispersed Particle Distributions ... 119
8.3 Conclusions... 122
References—Chapter 8 ... 124
Tables and Figures—Chapter 8 ... 125
Chapter 9: Dispersed Particle and Triple Junction Interactions in Aluminum Alloys ... 137
9.1. Introduction... 137
9.2. Results... 139
9.2.1 Microstructural Representation... 139
9.2.2 Grain Boundary (GB) Misorientation... 140
9.2.3 Dispersed Particle-GB Interaction ... 141
x
LIST OF TABLES
Table 2.1: Composition of Al 2139 (Cho and Bes 2006) ... 24
Table 2.2: Effect of strain-rate on properties of Al 2139 (Elkhodary, Sun et al. 2009) ... 24
Table 3.1: Summary of interactions and coefficient values in an FCC crystal... 49
Table 3.2: Summary of g-coefficients for dislocation density evolution equations ... 49
Table 5.1: Material properties of aluminum matrix and manganese-bearing dispersed particles ... 66
Table 6.1: Parameters used for homogeneous inclusion investigation ... 87
Table 6.2: Parameters used for inhomogeneous inclusion investigation... 87
Table 7.1: Material properties of aluminum matrix and manganese-bearing dispersed particles ... 101
Table 8.1: Grain misorientation averages for polycrystalline aggregates (degrees)... 125
Table 8.2: Material properties of aluminum matrix and manganese-bearing dispersed particles ... 125
Table 9.1: Euler angles used in the tri-crystal simulations (deg)... 148
Table 9.2: GB misorientation angles (deg) ... 148
xi
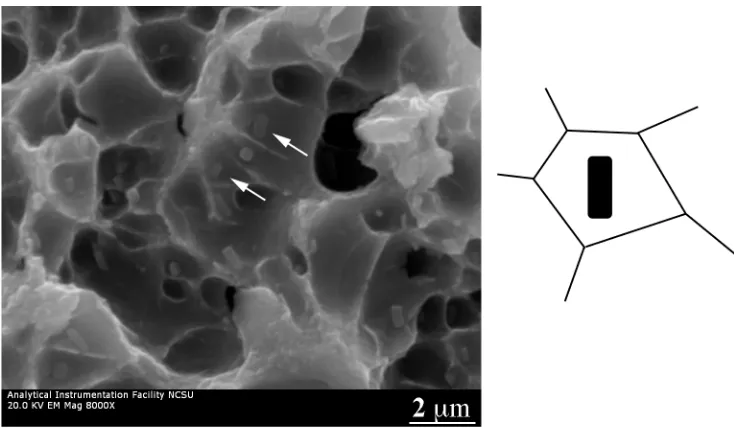
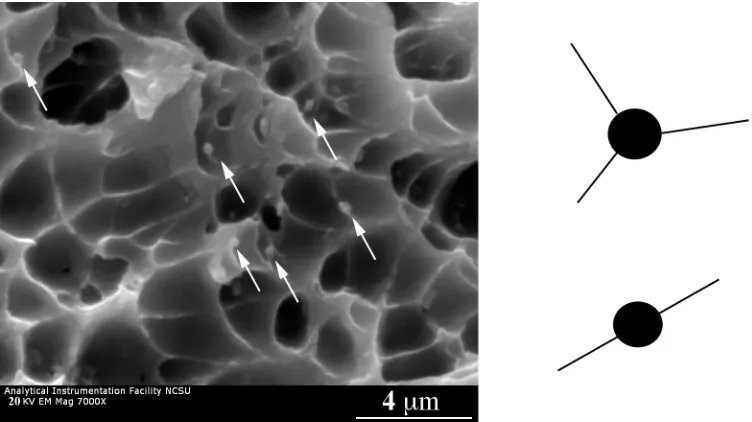
Figure 2.6: SEM image and schematic of dispersed particles in the center of dimples on a ductile fracture surface with the long axis of the particles in the plane of deformation, indicating void nucleation due to particles of this orientation... 30 Figure 2.7: SEM image and schematic of dispersed particles on the ridges of a ductile
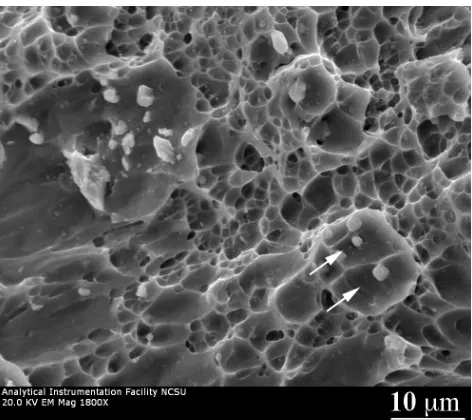
fracture surface with the long axis of the particles inclined to the plane of deformation, indicating resistance to void coalescence and final failure... 31 Figure 2.8: Comparison of the effects of inclusions and dispersed particles on a ductile
fracture, showing larger void sizes associated with the inclusions (marked with arrows) ... 32 Figure 2.9: SAD pattern (B=[011]), of an undeformed specimen, showing some breakup in
the [200] direction associated with the precipitation of ’ and spots at 1/3 and 2/3 [220] associated with ... 33 Figure 2.10: DF TEM image of and ’ precipitates; B=[011], g=[200], showing a “wavy”
deformation mode for ’ and a “multiple cutting” mechanism for associated with the high strain-rate deformation... 34 Figure 2.11: HRTEM image of a deformed ’ precipitate, B=[011]; FFT inset indicating
precipitate can rotate away from matrix habit plane... 35 Figure 2.12: HRTEM image of a deformed precipitate, B=[011]; FFT inset indicating
uncut regions maintain planar relationship with matrix ... 36 Figure 2.13: HRTEM image of a deformed precipitate, B=[011], showing extensive
multiple cutting ... 37 Figure 2.14: a) Typical shear dominated fracture surface; b) Region of mostly void sheet
dimpled rupture in the vicinity of shear dominated fracture for split Hopkinson testing38 Figure 2.15: a) Al-Cu-Fe-Mn inclusion cracking and associated local shear fracture surface;
xii
Figure 2.16: a) Al20Cu2Mn3 dispersed particles with the long axis in the plane of deformation located in the center of the dimples; b) Al20Cu2Mn3 dispersed particles with the long axis normal to the plane of deformation, observed on the ridges for split Hopkinson testing... 40 Figure 5.1: Hourglassing deformation associated with a 10% hourglass strain in the
x-direction ... 67 Figure 5.2: Contour plots of a) hourglass strain norm and b) effective plastic slip at 10%
nominal plane strain compression, matrix only ... 68 Figure 5.3: Contour plots of a) hourglass strain norm and b) effective plastic slip at 10%
nominal plane strain tension, matrix only... 69 Figure 5.4: Contour plots of a) hourglass strain norm and b) effective plastic slip at 10%
nominal plane strain compression, dispersed particles included ... 70 Figure 5.5: Contour plots of a) hourglass strain norm and b) effective plastic slip at 10%
nominal plane strain tension, dispersed particles included... 71 Figure 5.6: Contour plots of hourglass strain norm and effective plastic slip, factor (i). a)
Localized shear slip in matrix element triggering hourglass modes in surrounding regions; b) localized shear in matrix elements at triple junction triggering hourglass modes in neighboring elements; c) deformable matrix elements triggering hourglass modes in a dispersed particle ... 72 Figure 5.7: Contour plots of hourglass strain norm and effective plastic slip, factor (ii):
hourglassing in matrix caused by constraint associated with single element thick dispersed particles at a) 10% nominal tension and at b) 10% nominal compression; arrows indicate dispersed particles ... 73 Figure 5.8: Effect of particle meshing on propagation of the hourglass instability; arrows
indicate dispersed particles ... 74 Figure 6.1: Schematic and model of Eshelby verification problem... 88 Figure 6.2: Comparison of the particle stress using the eigenstrain-based finite element
method and the Eshelby solution for the homogeneous inclusion problem; maximum error=0.52% ... 89 Figure 6.3: Comparison of the particle stress using the eigenstrain-based finite element
method and the Eshelby solution for the inhomogeneous inclusion problem; maximum error=1.13% ... 90 Figure 6.4: Schematic of looping and relaxation in pure shear with respect to the current
xiii
particles aligned normal to most active slip plane (1-11) ... 105 Figure 7.5: Comparison of the amount of eigenstrain relaxed in Figure 4 plotted as a function of the aspect ratio with respect to the most active slip plane... 106 Figure 7.6: Contour plots of the von Mises stress in the matrix (normalized by the matrix
static yield stress) at 10% nominal compression; a) particles aligned with the long axis parallel to most active slip plane (1-11) and b) particles aligned normal to most active slip plane (1-11) ... 107 Figure 7.7: Contour plots of the effective plastic shear slip in the matrix at 10% nominal
compression; a) particles aligned with long axis parallel to most active slip plane (1-11) and b) particles aligned normal to most active slip plane (1-11)... 108 Figure 7.8: Contour plots of the mobile dislocation density (m-2) on the (a) most active
(1-11)[-101] and (b) secondary (-1-11)[-110] slip system at 10% nominal compression. 109 Figure 7.9: Evolution of the amount of relaxation for particles a) aligned parallel to the most
active slip plane and b) aligned normal to the most active slip plane... 110 Figure 7.10: von Mises (normalized by the matrix static yield stress) and pressure
(normalized by the matrix Young’s modulus) contours for the matrix of 20-grain
aggregate subjected to 10% nominal compressive strain ... 111 Figure 7.11: Contour plots of the number of active slip systems for the simulations with and
without the eigenstrain formulation ... 112 Figure 7.12: Contour plots of a) percent of eigenstrain relaxed and b) lattice rotations for the
20-grain aggregate ... 113 Figure 8.1: Summary of the investigated models: a) 20 m by 20 m single grain with
random dispersions of particles and b) 20 m by 20 m polycrystalline aggregate with 20, 35, and 48 grains and with one dispersed particle per grain... 126 Figure 8.2:Effective plastic slip contours in the matrix at 10% nominal compressive strain
xiv
800 nm by 425 nm average dispersed particle size and b) 600 nm by 300 average
dispersed particle size. Arrows indicate banded slip ... 127 Figure 8.3:Pressure contours in the matrix (normalized by the matrix Young’s modulus) at
10% nominal compressive strain for 1.0% volume fraction of particles in a single crystal: a) 800 nm by 425 nm average dispersed particle size and b) 600 nm by 300 nm average dispersed particle size. Contour levels set to emphasize decrease in
compressive pressures and transition to tensile pressures at the particle-matrix interfaces ... 128 Figure 8.4:von Mises stress (normalized by the matrix static yield stress) and pressure
(normalized by the matrix Young’s modulus) contours in the matrix at a 10% nominal compressive strain for particles aligned parallel to the most active slip plane: a) 1.0% volume fraction, 800 nm by 425 nm average dispersed particle size and b) 0.5% volume fraction, 600 nm by 300 nm average dispersed particle size ... 129 Figure 8.5:Matrix effective plastic shear slip comparison at 10% nominal compressive strain
for 600 nm by 300 nm average size particles normal to most active slip plane for 0.5%, 1.0% (arrow indicates banded slip), and 1.5% volume fraction (arrow indicates slip localization between particles)... 130 Figure 8.6:Percent of eigenstrain relaxed ... 131 (
(
D12,max_* sheardt D12,max_* shear_relaxeddt)
D12,max_* sheardt) at 10% nominal compressive strainfor 600 nm by 300 nm average size particles parallel to the most active slip plane for 0.5%, 1.0% and 1.5% volume fractions... 131 Figure 8.7: Comparison of effective plastic shear slip in the matrix at 10% nominal
compressive strain for a 20-grain aggregate with high angle GB misorientations with and without the eigenstrain formulation included at a) quasi-static (0.004 s-1) and b) 50,000 s-1 strain-rates ... 132 Figure 8.8: Matrix temperature (normalized by 293 K) at 10% nominal compressive strain for the 20-grain aggregate with the eigenstrain formulation at a strain-rate of 50,000 s-1. 133 Figure 8.9: a) Effective plastic shear slip in the matrix and b) percent of eigenstrain relaxed at
10% nominal compressive strain for the 20-, 35-, and 48-grain aggregates with low angle GB misorientations... 134 Figure 8.10: Effective plastic shear slip in the matrix and b) percent of eigenstrain relaxed at
10% nominal compressive strain for the 20-, 35-, and 48-grain aggregates with high angle GB misorientations... 135 Figure 8.11: Vertical normal stress component contours (normalized by matrix static yield
stress) detailing the effect of dispersed particles on stress accumulations associated with spall failure... 136 Figure 9.1: Schematic of the models; Initial alignment of the most active slip system in each
xv ( D12,max_* sheardt
D12,max_* shear_relaxeddt(
)
D12,max_* sheardt ) for 1.5% volume fraction of 600 nm by 300 nm average size particles and low angle GB misorientations at 10% nominal compressive strain... 153 Figure 9.6: Effective plastic shear slip contours for 600 nm by 300 nm average particle sizedispersions with high angle GB misorientations at 10% nominal compressive strain; a) 0.5% volume fraction, b) 1.0% volume fraction, and c) 1.5% volume fraction ... 154 Figure 9.7: Number of active slip systems at 10% nominal compressive strain for 600 nm by
300 nm average particle size dispersions with high angle GB misorientations; a) 0.5% volume fraction, b) 1.0% volume fraction, and c) 1.5% volume fraction ... 155 Figure 9.8: Effective plastic shear slip and lattice rotation contours for low angle GB
misorientations at 10% compressive strain; a) 425 nm by 212.5 nm average particle size, b) 600 nm by 300 nm average particle size, and c) 850 nm by 425 nm average particle size ... 156 Figure 9.9: Contours of effective plastic shear slip and percent of particle eigenstrain relaxed
for the same particle dispersion and orientation with high angle GB misorientations at 10% nominal compressive strain; a) 425 nm by 212.5 nm average particle size, b) 600 nm by 300 nm average particle size, and c) 850 nm by 425 nm average particle size. 157 Figure 9.10: von Mises stress (normalized by matrix static yield stress) and pressure
(normalized by matrix Young’s modulus) contours for the same particle dispersion and orientation with high angle GB misorientations at 10% compressive strain; a) 425 nm by 212.5 nm average particle size, b) 600 nm by 300 nm average particle size, and c) 850 nm by 425 nm average particle size. Pressure contour levels set to emphasize decrease in compressive pressures and transition to tensile pressures at the particle-matrix
xvi
1
alloys can be used to develop alloys with high strength, toughness, and ductility, due to the formation of microstructural features, such as nanoscale precipitates and larger dispersoids, which act as barriers to dislocation motion, hence limiting plastic slip in the material. The heat treatment and processing of the alloys can be adjusted to acquire the desired properties by altering the microstructure (Polmear 2004).
The precipitate ’ (Al2Cu) forms as plates on the {100} planes of Al-Cu based alloys with a tendency to precipitate on dislocation lines(Polmear and Chester 1989) and low angle GBs (Vaughan 1968). Recently, emphasis has been placed on quaternary Al-Cu-Mg-Ag alloys since the realization that the addition of Ag enhances precipitation of (Al2Cu), which nucleates homogeneously on the {111}habit planes within the alloy matrix (Cho,
Lisagor et al. 2007) and significantly strengthens the alloy (Chester and Polmear 1980). Plate-like precipitates on these planes have a greater impact on strengthening than precipitates on other planes in aluminum alloys (Nie, Muddle et al. 1996).
2
looping (Feng, Lin et al. 1984), and have been strongly associated with failure, which is controlled by a competition between dispersed particles homogenizing deformation, which delays void coalescence, and decreased particle spacing of larger inclusions, which enhances void coalescence (Walsh, Jata et al. 1989). Also, it has been shown that the presence of dispersed particles increases ductility by reducing the tendency for intergranular failure by initiating more homogeneous transgranular failure in the grain matrix (Starke and Sanders 1980).
The effects of dispersed particles on the performance of alloys have been extensively researched in attempts to develop macroscopic models for the behavior of these alloys. Brown and Stobbs (1971a) developed a model based on the Eshelby problem (Eshelby 1957), relating the unrelaxed plastic strain associated with Orowan looping to an eigenstrain (Mura 1987), or in the terminology of Eshelby, transformation strain (Eshelby 1957). Relaxation of this unrelaxed plastic strain was a topic of debate for smaller particle sizes (Brown and Stobbs 1971b, 1976; Atkinson, Brown et al. 1974; Hirsch and Humphreys 1970; Humphreys and Hirsch 1976; Humphreys and Stewart 1972), but for larger dispersed particles, such as Al20Cu2Mn3, this relaxation has been observed to occur by lattice rotations (Humphreys 1979). Modeling of the dislocation/particle interaction problem has been attempted using molecular dynamics (MD) simulations (Bacon and Osetsky 2005; Hatano 2006) and
3
(Elkhodary, Lee et al. 2011). Also, the effects of multiple particles can be investigated.
However, the conventional techniques of this finite element method are unable to capture the
interaction between the plastically deforming matrix and the elastic particle, due to the
displacement compatibility requirements of the finite element method.
1.2 General Research Objectives and Approach
The goals of this research are to identify the microstructural features critical to the
deformation behavior of the high strength Al-Cu-Mg-Ag-(Mn) alloy, and to develop a
microstructurally based finite element methodology to properly account for the
particle-matrix interaction which occurs in these alloys, allowing for a predictive simulation which
can predict the microstructural behavior of these alloys under extreme loading conditions.
The effect of the microstructure on the ballistic performance of the alloy was
investigated by means of optical microscopy (OM), scanning electron microscopy (SEM),
transmission electron microscopy (TEM), and energy dispersive spectroscopy (EDS).
Samples were taken from a 1.5” plate of ingot metallurgy (I/M) Al 2139 subjected to a 20
mm 4340 steel fragmentation simulating projectile impact ranging from 813 to 1043 m/s.
4
split Hopkinson pressure bar impact testing at a strain-rate of approximately 2350 s-1. The microstructural features of the alloy were identified, and the deformation and failure modes associated with each constituent were characterized.
Dislocation density based crystal plasticity finite element modeling was used to investigate the effects of the dispersed particles on the deformation behavior of the alloy. First, the effects of these particles and deformation on numerical instabilities in the finite element analysis were investigated, ensuring material instabilities could be delineated from numerical instabilities in subsequent results. A specialized finite element modeling scheme using an eigenstrain formulation to represent the unrelaxed plastic strain associated with Orowan looping was developed to investigate the effects of particle morphology, along with orientation, on the performance of the alloy from the quasi-static to the high strain-rate regimes. Emphasis was placed on the effects of the particles on the localization of the plastic shear slip and the influence of the particles on the stress state at the particle-matrix interface. The unrelaxed plastic strain associated with Orowan looping was represented as an
eigenstrain in the particle as a function of the plastic strain in the surrounding matrix grain, calculated using dislocation density based crystal plasticity, which was relaxed by means of incompatible lattice rotations between the dispersed particle and the neighboring matrix grain.
The effects of particle dispersion and morphology were investigated by high strain-rate compressive simulations employing the eigenstrain based specialized dislocation density based crystalline plasticity and finite element framework. The coupled effects of the
strain-5
formulation, which is used in conjunction with the finite element numerical methods covered in Chapter 4. Chapter 5 presents the results of an investigation into the effects of
deformation and microstructure on the hourglassing numerical instability associated with one-point Gauss integration in finite element analysis. Chapter 6 outlines the eigenstrain-based finite element formulation that accounts for unrelaxed plastic strains associated with Orowan loops and dispersed particles in high strength aluminum alloys. Chapter 7 covers an investigation into the effects of particle dispersion and orientation on the behavior of
aluminum alloys subjected to quasi-static loading conditions. Chapter 8 expands on the investigation in Chapter 7 to model the effects of the particles under high strain-rate loading conditions. Chapter 9 presents an investigation into the interrelated effects of GB
misorientation and dispersed particles on the possible failure modes in high strength
6
References—Chapter 1
Atkinson, J. D., L. M. Brown, et al. (1974). “The Work-hardening of Copper-Silica IV. The Bauschinger Effect and Plastic Relaxation.” Philosophical Magazine 30(6): 1247-1280.
Bacon, D. J. and Y. N. Osetsky (2005). “Modeling Dislocation-Obstacle Interactions in Metals Exposed to an Irradiation Environment.” Materials Science and Engineering A 400: 353-361.
Brown, L. M. and W. M. Stobbs (1971a). “The Work-hardening of Copper-Silica I. A Model Based on Internal Stresses, With No Plastic Relaxation.” Philosophical Magazine, 23(185): 1185-1199.
Brown, L. M. and W. M. Stobbs (1971b). “The Work-Hardening of Copper-Silica II. The Role of Plastic Relaxation.” Philosophical Magazine 23(185): 1201-1233.
Brown, L. M. and W. M. Stobbs (1976). “The Work-Hardening of Copper-Silica V.
Equilibrium Plastic Relaxation by Secondary Dislocations.” Philosophical Magazine 34(3): 351-372.
Chester, R. J. and I. J. Polmear (1980). "TEM Investigation of Precipitates in Al-Cu-Mg-Ag and Al-Cu-Mg Alloys.” Micron 11(3-4): 311-312.
Cho, A., W. B. Lisagor, et al. (2007). “Development and Processing Improvement of
Aerospace Aluminum Alloys—Development of Al-Cu-Mg-Ag Alloy (2139).” NASA Contractor Report CR-2007-215094.
Elkhodary, K. I., Lee, W. M., et al. (2011). “Deformation Mechanisms of an Precipitate in a High Strength Aluminum Alloy Subjected to High Strain Rates,” Journal of
Materials Research 26(4): 487-497.
Eshelby, J. D. (1957). “The Determination of the Elastic Field of an Ellipsoidal Inclusion, and Related Problems.” Proceedings of the Royal Society of London A 241(1226): 376-396.
Feng, W. X., F. S. Lin, et al. (1984). “The Effect of Minor Alloying Elements on the Mechanical Properties of Al-Cu-Li Alloys.” Metallurgical Transactions A 15(6): 1209-1220.
7
Metals.” Acta Metallurgica 27(12): 1801-1814.
Mura, T. (1987). Micromechanics of Defects in Solids (2nd ed.). The Netherlands, Martinus Nijhoff.
Nie, J. F., B. C. Muddle, et al. (1996). "The Effect of Precipitate Shape and Orientation on Dispersion Strengthening in High Strength Aluminium Alloys." Materials Science Forum 217: 1257-1262.
Polmear, I. J. (2004). "Aluminum Alloys-A Century of Age Hardening." Materials Forum 28: 1-14.
Polmear, I. J. and R. J. Chester (1989). "Abnormal Age Hardening in an Al-Cu-Mg Alloy Containing Silver and Lithium." Scripta Metallurgica 23(7): 1213-1218.
Queyreau, S. and B. Devincre (2009). “Bauschinger effect in precipitation-strengthened materials: A dislocation dynamics investigation.” Philosophical Magazine Letters 89(7): 419-430.
Starke, E. A. (1997). “NASA-UVa Light Aerospace Alloy and Structure Technology Program Supplement: Aluminum-Based Materials for High Speed Aircraft.” NASA Contractor Report CR-97-206248.
Starke, E. A., and T. H. Sanders (1980). “The Effect of Microstructure on the Properties of High Strength Aluminum Alloys.” AFOSR Annual Scientific Report. ADA083768. Takahashi, A. (2008). “Parametric Dislocation Dynamics and Boundary Element Modeling
8
Vaughan, D. (1968). "Grain Boundary Precipitation in an Al-Cu Alloy." Acta Metallurgica 16(4): 563-577.
9
alloys, such as Al 2139 (Cho and Bes 2006), which can be applied for a myriad of civilian and military applications. This alloy has significant strength and ductility under high strain-rate loading conditions(Elkhodary, Sun et al. 2009) along with improved ballistic behavior in comparison with 7*** and 5*** series aluminum alloys previously used in military
applications (Cheeseman, Gooch et al. 2008). Cho and Bes(2006) reported that
strengthening constituents, precipitates and ’ and Mn-containing dispersed particles, were present in the Al 2139 alloy. The composition and the quasi-static and dynamic properties of the alloy are given in Tables 2.1-2.2.
The precipitation of (Al2Cu) as plates on the {111} planes occurs in Al-Cu-Mg based alloys with high Cu:Mg ratios, and it can be enhanced by the presence of Ag (Polmear and Chester 1989; Gable, Shiflet et al. 2004; Wang, Starink et al. 2005; Chester and Polmear 1996). Plate-like precipitates on these planes have a greater impact on strengthening than precipitates on other planes in aluminum alloys (Nie, Muddle et al. 1996). A dislocation multiple cutting mechanism has also been proposed as one strengthening mechanism for the
10
tendency for nucleation at dislocation lines or grain boundaries (GBs) (Chester and Polmear 1980; Garg, Chang et al. 1990).
The precipitate ’ (Al2Cu) forms as plates on the {100} planes of Al-Cu based alloys with a tendency to precipitate on dislocation lines(Polmear and Chester 1989) and low angle GBs (Vaughan 1968). The strengthening mechanisms associated with ’ are dislocation pile-ups, dislocations adhering to the precipitate, and dislocations being impeded by the precipitates (Koda, Takahashi et al. 1963). Embury(1985) reported that “buckling” of ’ precipitates can occur at high strain levels under quasi-static, multi-directional loading conditions. Beffort et al.(1995) reported that while precipitates can result in increased strength, ’ can result in increased fracture toughness for aluminum alloys.
The presence of Mn in the Al 2139 alloy can also promote the formation of orthorhombic dispersed particles with the composition of Al20Cu2Mn3 that form as rods elongated in the [010] particle directions (Wang and Starink 2005). These particles have been reported to provide fiber-like reinforcement(Sharma, Amateau et al. 2005) and
homogenization of slip through dislocation looping and grain size control (Walsh, Jata et al. 1989). Walsh, et al.(1989) noted that the effects of Mn addition, for quasi-static loading conditions, are governed by a competition between dispersed particles homogenizing deformation, which delays void coalescence, and decreased particle spacing of larger inclusions, which enhances void coalescence. The addition of Mn also reduces the detrimental effect on ductility of Al7Cu2Fe inclusions (Tseng, Lee et al. 2002).
11
span the micro to macro scales. All of these microstructural characteristics can collectively
affect failure evolution. Hence, the major objective of this chapter is to characterize the
effects of this complex microstructure on the dynamic impact behavior of Al 2139.
2.2 Experimental Methods
2.2.1 Projectile Impact of a 1.5” (38 mm) plate
A 38 mm plate was subjected to a ballistic test with impact velocities ranging from
813 to 1043 m/s. The plate was impacted by 20 mm fragmentation simulating projectiles in
accordance with the USADTC TOP 2-2-710 V50 test procedures at the Army Research
Laboratory (Cheeseman, Gooch et al. 2008). The shots were fired with zero degrees striking
obliquity. Figure 2.1 shows the backside of the plate after the test. Specimens were taken
from both deformed and undeformed areas of the plate for comparison.
The broad spectrum of physical scales relevant to the microstructure of Al 2139
necessitated the need for multiple characterization approaches. Optical microscopy (OM),
orientation imaging microscopy (OIM), energy dispersive spectroscopy (EDS), transmission
electron microscopy (TEM), and selected area diffraction (SAD) were performed on
12
characterization of fracture surfaces of the deformed samples. The focus of this study was to
characterize grain size and morphology, dispersed particles and inclusions, and precipitates
for deformed and undeformed states.
OM was used to investigate inclusions, grain sizes, and damage on the micro-scale.
Samples were mechanically polished to either 1 μm alumina or 0.05 μm colloidal silica.
Samples for grain size and damage characterization were etched using a 10 g NaOH to 100
mL H2O mixture and viewed with a polarized light filter. Nikon Eclipse and Zeiss Axiovert
microscopes along with Act-1 and Axiovision software were used for imaging. OIM was
used to investigate grain orientations. Samples were polished to 0.5 μm alumina and
characterized using an EDAX Hikari Electron Backscatter Diffraction (EBSD) detector on a
Phillips XL30 FEG microscope. TEM imaging was used to view the microstructure of the
alloy down to the nano-scale, including inclusions, dispersed particles, precipitates. A JEOL
JEM-2000FX Electron Microscope and a Hitachi HF2000 TEM were used for imaging at
200 kV. An Oxford INCA EDS system accompanied the Hitachi TEM. A JEOL 2010F
equipped with a GATAN Image Filter was used for phase-contrast HRTEM imaging at 200
kV. SEM was used to investigate fracture surfaces of the deformed areas down to the
nano-scale. A Hitachi S-3200 SEM equipped with an Oxford Isis EDS system was used for
characterization of the fracture surfaces.
Sample preparation methods were chosen as to preserve the microstructure and not
induce any damage. Hence, waterjet cutting was used to section the material from the bulk
plate. Further sectioning was accomplished using a low-speed diamond saw. TEM samples
13
an Oxford Isis EDS system was used for characterization of the fracture surfaces. Inclusions
were distinguished from the dispersed particles by means of the characteristic Fe peak not
present in the EDS spectrum of the dispersed particles.
2.3 Results and Discussion-Projectile Impact
2.3.1 Damage Modes
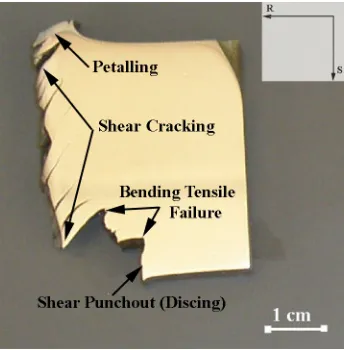
Damage modes similar to Woodward’s observation of discing(Woodward 1984)
were observed in both impacted areas of the plate that were penetrated and those that were
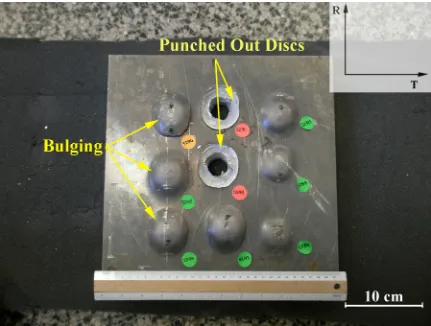
not penetrated. A summary of the different damage modes is given in Figure 2.2 for a
penetrated region. Petalling due to the initial impact was observed for all shots. Shear
cracking on surfaces initially parallel to the impacted face was noted throughout the
cross-section due to intense shear between the grains as the projectile passed through (Figure 2.3),
as indicated by a crack running into shear bands. As the projectile continued to penetrate,
bulging occurred in the backside of the plate due to a reduction in thickness of the material
ahead of the projectile, which initiated shear cracking in planes normal to the impact. The
14
activated at the end of a shear crack. Shear punchout of the disc then occurred due to heavy
shear parallel to the impact direction after the onset of bending tensile failure.
The extent of macroscopic damage, such as backside bulging and macroscopic
cracking, was a function of the shot velocity; the two shots that completely penetrated the
target corresponded with the two highest impact velocities. Cracking was observed on the
backside of the plate parallel to the rolling direction, indicating more ductility and less
damage in the R-S plane. This increased ductility can be attributed to the elongation of
grains due to rolling. Therefore, damage in the R-S plane appeared to be the dominant factor
for complete penetration of the material. It has been shown that two-directional rolling can
increase the isotropy in the rolling and transverse directions for similar Al alloys (Cho,
Lisagor et al. 2007).
2.3.2 Microstructural Characteristics
2.3.2.1 Grain Morphology
Grain shapes and sizes were characterized using Image J freeware analysis of
microscopic images. The software fit an ellipse to each grain using the images of the GBs.
Confidence intervals of the measurements presented are 95%. Grain morphology was highly
dependent of both the orientation with respect to rolling and location in the through thickness
of the plate. The dimensions of the grains at the edge of the plate were on average 59 ± 4 x
155 ± 14 x 230 ± 25 μm (S x T x R directionality) and 65 ± 6 x 196 ± 22 x 400 ± 55 μm at
the middle of the plate. OIM analysis revealed that most of the GBs had high angle
15
with high angle GBs limit the preferential precipitation of ’ (Vaughan 1968).
2.3.2.2 Dispersed Particles and Inclusions
EDS analysis indicated the presence of dispersoids containing Al, Cu, and Mn, along
with the presence of inclusions containing Al, Cu, Fe, and Mn. Inclusions rich in Cu and Fe
were also observed to a smaller extent. Standardless quantitative EDS analysis indicated that
the Al-Cu-Mn dispersoids were near the composition of the Al20Cu2Mn3 dispersoid. These
particles averaged about 600 nm in length with an approximately 2:1 length to diameter ratio.
The Al-Cu-Fe-Mn inclusions had a large concentration of Al and Cu (~70 and ~20 at. %)
with smaller amounts of Fe and Mn (~6-7 and ~2-3 at. %). This could indicate that Mn
substitutes for Fe in the Al7Cu2Fe inclusions that are detrimental to the ductility of the
aluminum alloys. It has been reported that the presence of Mn reduces the detrimental
effects of Fe on aluminum alloys (Tseng, Lee et al. 2002). These particles were mainly larger
than 1 μm, with individual particles as large as 25 μm and clusters approaching 100 μm.
TEM observations show that approximately 30% of the sub-micron particles were
16
The inclusions varied in shape and size as a function of the distance from the edge of
the plate. Smaller equiaxed inclusions were observed near the edges of the plate, while
larger inclusions, elongated in the rolling direction, were observed near the center of the
plate. Some tendency was observed for these particles to grow along GBs. Analysis of OM
images indicates a volume fraction of approximately 1.3% for the Al-Cu-Fe-Mn inclusions.
Debonding occurred due to rolling to a small extent (~5% of particles) at the ends of
elongation.
OM and SEM were used to compare the effects of the inclusions and dispersed
particles on the high strain-rate failure of the alloy. The inclusions rotated with the matrix
upon impact. Cracking was noted in the particles normal to the particle elongation direction,
but did not extend into the matrix, indicating the ductility of the alloy and some energy
absorption capability of the inclusions. Inclusion debonding, however, was observed in the
elongated direction of smaller particles. Furthermore, the high Cu content of the inclusions
reduces the amount of Cu available for precipitation of dispersed particles, , and ’.
The effects of dispersed particles and inclusions on the different failure modes of
alloy Al 2139 on the micro-scale are shown in Figures 2.4-2.8. Figure 2.4 shows a shear
crack caused by inclusion debonding that initiated at the particle-matrix interface. Figure 2.5
shows a cracked Al-Cu-Fe-Mn inclusion leading to shear failure in an area dominated by
ductile failure. Figures 2.6 and 2.7 show the effect of the dispersed particles. Particles with
the long axis in the plane of deformation are observed to be sources of void nucleation, due
to the observation of the particles in the center of the dimples. Particles with the long axis
17
inclusions promote shear deformation, reducing the homogenizing effect of the dispersed
particles. Secondly, dispersed particles in high strain-rate failure not only act as sites for
void nucleation, but also resist coalescence of voids as clearly observed in Figure 2.7. The
resistance to coalescence, furthermore, can lead to increased ductility for high strain-rate
loading conditions.
2.3.2.3 Precipitates
TEM analysis of undeformed samples confirmed the presence of and ’ in the Al
2139 alloy. Figure 2.9 is an SAD pattern taken on the [011] beam axis, showing some
breakup in the [200] direction associated with the precipitation of ’, and spots at 1/3 and 2/3
[220] associated with . Also, ’ precipitates can be identified in the images by the fringing
that occurs due to the mismatch in the (1-1 1) and (1-1 2)’ diffraction spots. Analysis of
on-axis TEM images reveals that the precipitates average approximately 45 nm in
diameter with a thickness of 2 nm, whereas the ’ precipitates are 35 nm in diameter with a
thickness of 4 nm. The volume fraction of the precipitates was estimated to be 1.04% for
18
The deformation of the precipitates under high strain-rate impact loading is indicative
of the dislocation activity associated with the impact. TEM images of precipitates were
taken from a highly deformed region of the plate near the impact surface. Figure 2.10 shows
both and ’ precipitates in a DF image taken off of B=[011] with g=[200]. Figure 2.11 is a
HRTEM image of a deformed ’ precipitate. Figures 2.12 and 2.13 show HRTEM images of
deformed precipitates.
High strain-rate loading conditions can affect precipitate behavior. ’ precipitates,
which form on the {100} planes, exhibit a wavy deformation mode (Figure 2.10). Also, as
shown in Figure 11, the precipitates do not retain the plate-like shape and planar relationship
with the matrix upon impact. The FFT inset clearly shows that the streak is rotated away
from the [200] direction.
In contrast with the ’ deformation, the {111} precipitates deform in a manner in
which they retain their planar shape, relationship, and coherency with the matrix through
what is termed a dislocation multiple cutting mechanism (Li and Wawner 1998), due to the
multiple indications of precipitate shearing (Figure 2.12). The shear cuts that are observed in
Figure 2.13 are much larger than those observed by Li and Wawner (1998) for quasi-static
testing. This multiple cutting mechanism can inhibit and diffuse localized shear, and the
planar relationship and coherency with the matrix after impact is indicative of the beneficial
effects that precipitates have on the strength of the alloy. The dislocations cut through the
precipitates, which indicates that the precipitates collectively promote ductility with minimal
19
precipitate can both deform in this wavy mode and lose its planar relationship with the
matrix, it can rotate with the deformation. Increased precipitation of in proportion to ’,
therefore, may lead to highly favorable ballistic performance of the alloy.
2.4 Results and Discussion-Split Hopkinson
Both shear dominant failure and dimpled void sheet failure are evident (Figure 2.14).
Figure 2.14b also contains a region of shear failure within the dimpled void sheet region.
The shear dominant failure is associated with the micro-scale Al-Cu-Fe-Mn inclusions.
Figure 2.15a also indicates the inclusions are associated with the shear dominant failure. A
cracked inclusion (see arrows) is present on the locally sheared fracture surface. The
inclusions were also observed in the void sheet dimpled failure region (Figure 2.15b). The
size of the dimples associated with the inclusions is approximately 10 μm, much larger than
that of the surrounding void sheet.
The Al20Cu2Mn3 dispersed particles were also observed to influence the failure of the
alloy. Figure 2.16 shows the effect of the dispersed particles on the failure of the alloy. The
dispersed particles were observed both in the center of the dimples and on the ridges. These
20
behavior. Particles with the long axis in the plane of deformation are observed in the center
of the dimples. This suggests that these particles are sources of void nucleation. Particles
with the long axis inclined to the plane of deformation are observed on the ridges. This is
evidence that void initiation and final void coalesence can be delayed. These orientation
effects on behavior are similar to those observed for ballistic impact testing. The effects of
particle dispersion on the void size at the time of failure can also be seen in this figure. The
spacing between the particles determines the size of the voids, which is on the order of 3 μm,
which is much smaller than that associated with the Al-Cu-Fe-Mn inclusions.
2.5 Conclusions
The microstructure of Al 2139 plays a critical role in the high strain-rate performance
and behavior of the alloy. Large, elongated grains reduce the GB area, which can lead to
high ductility and toughness, especially in the rolling direction, and also increased resistance
to shear and spall failure caused by GB cracking. Large grains with high angle GBs also
allow for more precipitation of and ’ within the grain interiors. Non-shearable dispersed
particles associated with tensile failure increase the strength and ductility of the alloy by
controlling void nucleation and inhibiting void coalescence. Larger inclusions can absorb
energy, but may result in shear localization.
The different modes of deformation for the precipitates, and ’ underscore how the
interrelated effects of these precipitates affect behavior. The precipitate maintains its
planar relationship with the matrix through an extensive dislocation multiple cutting
21
characteristics at physical scales spanning the nano to the micro. These mechanisms are
directly linked to the inhibition of observed shear and tensile failure modes, resulting in
22
References—Chapter 2
Beffort, O., C. Solenthaler, et al. (1995). "Improvement of Strength and Fracture Toughness of a Spray-Deposited Al-Cu-Mg-Ag-Mn-Ti-Zr Alloy by Optimized Heat-Treatments and Thermomechanical Treatments.” Materials Science and Engineering A-Structural Materials Properties Microstructure and Processing 191(1-2): 113-120.
Cheeseman, B., W. Gooch, et al. (2008) “Ballistic Evaluation of Aluminum 2139-T8.” 24th International Ballistics Symposium. New Orleans, LA.
Chester, R. J. and I. J. Polmear (1980). "TEM Investigation of Precipitates in Al-Cu-Mg-Ag and Al-Cu-Mg Alloys.” Micron 11(3-4): 311-312.
Cho, A. and B. Bes (2006). “Damage Tolerance Capability of an Al-Cu-Mg-Ag Alloy (2139).” Materials Science Forum 519-521(1-2): 603-608.
Cho, A., W. B. Lisagor, et al. (2007). “Development and Processing Improvement of
Aerospace Aluminum Alloys—Development of Al-Cu-Mg-Ag Alloy (2139).” NASA Contractor Report CR-2007-215094.
Elkhodary, K., L. Sun, et al. (2009). “Integrated Experimental, Atomistic, and
Microstructurally Based Finite Element Investigation of the Dynamic Compressive Behavior of 2139 Aluminum.” Journal of Applied Mechanics 76(5): 051306.
Embury, J. D. (1985). “Plastic Flow in Dispersion Hardened Materials.” Metallurgical Transactions A 16(12): 2191-2200.
Gable, B. M., G. J. Shiflet, et al. (2004). "The Effect of Si Additions on Omega Precipitation in Al-Cu-Mg-(Ag) alloys." Scripta Materialia 50(1): 149-153.
Garg, A., Y. C. Chang, et al. (1990). "Precipitation of the -Phase in an Al-4.0Cu-0.5Mg Alloy." Scripta Metallurgica et Materialia 24(4): 677-680.
Koda, S., S. Takahashi, et al. (1963). "Direct Observation of Interaction of Dislocations with ' Precipitates in an Aluminium-3.8 Wt.-Percent Copper Alloy." Journal of the Institute of Metals 91(7): 229-234.
23
Formed High Strength Al-Zn-Mg-Cu Alloys." Acta Materialia 53(10): 2919-2924.
Tseng, C. J., S. L. Lee, et al. (2002). “Effects of Manganese on Microstructure and Mechanical Properties of A206 Alloys Containing Iron.” Journal of Materials Research 17(9): 2243-2250.
Vaughan, D. (1968). "Grain Boundary Precipitation in an Al-Cu Alloy." Acta Metallurgica 16(4): 563-577.
Walsh, J. A., J. V. Jata, et al. (1989). “The Influence of Mn Dispersoid Content and Stress State on Ductile Fracture of 2134 Type Al Alloys.” Acta Metallurgica 37(11): 2861-2871.
Wang, S. C. and M. J. Starink (2005). "Precipitates and Intermetallic Phases in Precipitation Hardening Al-Cu-Mg-(Li) Based Alloys." International Materials Reviews 50(4): 193-215.
24
Tables and Figures—Chapter 2
Table 2.1: Composition of Al 2139 (Cho and Bes 2006)
Si Fe Cu Mn Mg Ag
Percentage 0.10 0.15 4.5-5.5 0.20-0.60 0.20-0.80 0.15-0.60
Table 2.2: Effect of strain-rate on properties of Al 2139 (Elkhodary, Sun et al. 2009)
Strain-rate 0.001 s-1 8100 s-1
Flow Stress (MPa), true=0.06 650 850
25
26
27
28
29
30
31
32
33
34
Figure 2.10: DFTEM image of and ’ precipitates; B=[011], g=[200], showing a
“wavy” deformation mode for ’ and a “multiple cutting” mechanism for associated
35
Figure 2.11: HRTEM image of a deformed ’ precipitate, B=[011]; FFT inset indicating
36
37
38 a) b)
39
40
Figure 2.16: a)Al20Cu2Mn3 dispersed particles with the long axis in the plane of
deformation located in the center of the dimples; b) Al20Cu2Mn3 dispersed particles
41 affect the overall failure modes?
Dislocation density based crystalline plasticity finite element modeling can be
employed to capture the effects of a dispersion of microstructural features on the evolution of
the deformation behavior of the alloy (see, for instance, Elkhodary, Lee et al. 2011). The
constitutive formulation for the dislocation density based crystalline plasticity finite element
method will be presented in this chapter. The kinematics of multiple slip and the relationship
between the material deformation and mechanical response associated with dislocation
density accumulation and thermal softening will be outlined.
3.1 Multiple Slip Crystal Plasticity Kinematics
The constitutive formulation for rate-dependent multiple-slip crystalline plasticity,
coupled to evolutionary equations for the dislocation densities, will be outlined below (Zikry
and Kao 1996; Ashmawi and Zikry 2000; Asaro and Rice 1977).
The velocity gradient tensor, Lij, is calculated from the deformation gradient as
42
It is assumed that the velocity gradient can be additively decomposed into elastic and plastic
parts, Leijand L ij
p. These will be further decomposed into the symmetric deformation rate
tensors, Dije and Dijp, and antisymmetric spin tensors, Wije and Wijp, as
Dij =Dije
+Dijp, W
ij =Wij e
+Wijp. (3.2)
The plastic parts are related to the crystallographic slip rates as
Dij p
=Pij
( )˙ ( ), W
ij p
=ij
( )˙ ( ), (3.3)
where is summed over all slip-systems, and Pij
( ) and ij( ) are the symmetric and
antisymmetric parts of the Schmid tensor, defined in terms of the slip planes and directions as
Pij( ) =1
2 si
( )n
j
( ) +s
j
( )n
i
( )
(
)
and ij( ) =1
2 si
( )n
j
( )s
j
( )n
i
( )
(
)
. (3.4)As a measure of plastic strain, the effective plastic shear slip is calculated from the plastic
deformation rate tensor as
eff =
2
3 Dij
pD ij pdt
. (3.5)The stress is updated using the Jaumann stress rate corotational with the lattice, ij ,e,
as
ij
,e
=CijklDkle, (3.6)
where Cijkl is the fourth-order isotropic elastic modulus tensor defined by
Cijkl =μ
(
ikjl +jkil)
+ijkl (3.7)The Jaumann stress rate is related to the material stress rate, ˙ ij, in the reference coordinate
43 ref
, and m is the strain-rate sensitivity parameter,
m=ln
( )
ln˙ ( ) . (3.10)
The reference shear stress includes forest hardening associated with the immobile
dislocation density, which accounts for the interaction between slip systems through the
coefficient, aj, and thermal softening through the negative thermal softening exponent, ,
and reference temperature Tr (293 K) (Franciosi, Berveiller et al. 1980).
ref
= s
+μb ajim
j
j=1,nss
T Tr (3.11)For high strain-rate investigations under the assumption of adiabatic heating, the temperature
is updated using
T ˙ =
cpij ' D
ij
p, (3.12)
where is the fraction of plastic work converted to heat, is the mass density, cp is the
specific heat of the material, and ij
44
3.2 Dislocation Density Evolution
It will be assumed that the total dislocation density can be decomposed additively into
mobile and immobile components (Zikry and Kao 1996).
( ) =im( ) +m( ) (3.13)
During an increment of slip, mobile dislocations may be generated, immobile dislocations
may be annihilated, or junctions may be formed or destroyed coupling the mobile and
immobile dislocation densities, leading to the coupled differential equations governing
dislocation density evolution,
˙ m
( )= ˙ generation ( ) ˙ interaction a
( ) (3.14)
˙ im( )
= ˙ interaction( )a +
˙ annihilation( ) . (3.15)
The dislocation density evolution follows the formulation of Shanthraj and Zikry
(Accepted). Dislocation density generation is related to the distance, yback, traversed by a
dislocation emitted from a source with density, source, both related to the spacing of
immobile forest obstacles, i.e., Frank Read mechanism. The average velocity of mobile
dislocations, v( ) , is used to determine the generation rate as
˙ generation =source
( ) v( )
yback. (3.16)
The Orowan equation, ˙ ( )
=m
( )b( )v( ) , allows the generation rate to be recast as
˙
generation=
im( )
b( )
im ( ) m ( )
45 and m
( )
im
( )v( ) , where the relative velocity between the slip systems, v(), is defined using
the Orowan equation as
v() = ˙ ( )
m
( )b( ) +
˙ ( ) m
( )b( ) . (3.18)
The length of the formed junction is assumed to be proportional to the spacing of immobile
dislocations as
lc = 1
im
( )
, (3.19)
and only a fraction of these junctions, f0, are stable. The rates of immobilization of
dislocation densities on slip system due to mobile and immobile dislocations on slip
system are therefore f0m
( )
m
( )l
c
( )and f 0m
( )
im ( )l
c
( ), respectively. The rate of
immobilization of mobile dislocation densities on slip system is therefore
˙ interaction( ) = f
0 m
( )l
c
˙ ( )
b( ) +m
( )l
c
˙ ( )
b( ) + f0
im
( )l
c
˙ ( )
b( )
(3.20)The addition of immobile dislocation densities due to interactions also takes into
46
used to determine energetically favorable interactions for immobile junction formation. A
dislocation density interaction tensor for junction formation on slip system due to
interaction of slip systems and is defined as
n
= 1 if μb
( )2
<μb( )2+μb( ) 2andb( ) =b( ) +b( ) 0 otherwise
. (3.21)
The rates of junction formation on slip system are then defined as
nf
0m
( ) m
( )l c
( ) and n
f
lc m
( )im( )( ) +m( ) im( )( )
(
)
(3.22)for mobile/mobile and mobile/immobile interactions. The total addition of immobile
dislocation densities due to interactions then becomes
˙
interaction+
( ) = f
0 m
( )l c
˙ ( ) b( ) +m
( )l c
˙ ( ) b( )
+
,
f0 im
( )l c
˙ ( ) b( ) +im
( )l c
˙ ( ) b( )
,
. (3.23)The interaction tensor for FCC crystals is determined using the 6 energetically favorable
interactions: self interaction, co-linear interaction, co-planar interaction, Lomer locks, glissile
junctions, Hirth locks (Kubin, Devincre et al. 2008). Table 3.1 summarizes these
interactions.
Dislocation density annihilation due to recovery is modeled using an Arrhenius
relationship (Vegge, Rasmussen et al. 2000) as
˙ annihilation
( ) =( )e
H kT
, (3.24)
where the frequency of which immobile dislocations are intersected by mobile dislocations
on other slip systems is related to the attempt frequency, ( ) , as
( ) = f0 im
( )l
c
˙( )
b( )
47 ˙ annihilation
( ) = f
0 im
( )l c
˙ ( )
b( )
e kT. (3.27)
The generation, interaction, and annihilation rates are then substituted into equations
3.14 and 3.15 to obtain a coupled nonlinear set of evolutionary equations for the dislocation
densities. The evolutionary equations can be expressed as
dm
dt =˙ gsour b2 im m gmnter m gimmob
b im (3.28)
dim
dt = ˙ g
mnter+
m + gimmob+
b im
grecov
im
(3.29)
to delineate the dislocation activities such as generation, interaction, immobilization, and
annihilation (Zikry and Kao 1996). The coefficients, not known a priori, are summarized in
Table 3.2. The dislocation activity is coupled to the stress response through the Taylor
48
References—Chapter 3
Asaro, R. J. and J. R. Rice (1977). “Strain Localization in Ductile Single-Crystals.” Journal of the Mechanics and Physics of Solids 25(5): 309-338.
Ashmawi, W. M. and M. A. Zikry (2000). “Effects of Grain Boundaries and Dislocation Density Evolution on Large Strain Deformation Modes in FCC Crystalline Materials.” Journal of Computer-Aided Materials Design 7(1): 55-62.
Elkhodary, K. I., Lee, W. M., et al. (2011). “Deformation Mechanisms of an Precipitate in a High Strength Aluminum Alloy Subjected to High Strain-rates,” Journal of
Materials Research 26(4): 487-497.
Franciosi, P., M. Berveiller, et al. (1980). “Latent Hardening in Copper and Aluminum Single Crystals.” Acta Metallurgica 28(3): 273-283.
Kubin, L., B. Devincre, et al. (2008). “Modeling Dislocation Storage Rates and Mean Free Paths in Face-Centered Cubic Crystals.” Acta Materialia 56(20): 6040-6049.
Shanthraj, P. and M. A. Zikry “Dislocation Density Evolution and Interactions in Crystalline Materials.” Acta Materialia Accepted.
Vegge, T., T. Rasmussen, et al. (2000). “Determination of the Rate of Cross Slip of Screw Dislocations.” Physical Review Letters 85(18): 3866-3869.
Zikry, M. A. and M. Kao (1996). “Inelastic Microstructural Failure Mechanisms in


![Figure 2.9: SAD [220] associated with pattern (B=[011]), of an undeformed specimen, showing some breakup in the [200] direction associated with the precipitation of �’ and spots at 1/3 and 2/3 �](https://thumb-us.123doks.com/thumbv2/123dok_us/1581118.1194677/53.612.198.436.71.309/figure-associated-pattern-undeformed-specimen-direction-associated-precipitation.webp)
![Figure 2.10: DF TEM image of � and �’ precipitates; B=[011], g=[200], showing a “wavy” deformation mode for �’ and a “multiple cutting” mechanism for � associated with the high strain-rate deformation](https://thumb-us.123doks.com/thumbv2/123dok_us/1581118.1194677/54.612.198.436.72.310/figure-precipitates-showing-deformation-multiple-mechanism-associated-deformation.webp)
![Figure 2.11: HRTEM image of a deformed �’ precipitate, B=[011]; FFT inset indicating precipitate can rotate away from matrix habit plane](https://thumb-us.123doks.com/thumbv2/123dok_us/1581118.1194677/55.612.198.436.69.311/figure-hrtem-deformed-precipitate-indicating-precipitate-rotate-matrix.webp)
