DOI: 10.1534/genetics.108.097030
Polymorphic Genes of Major Effect: Consequences for Variation, Selection
and Evolution in
Arabidopsis thaliana
John R. Stinchcombe,*
,†,1Cynthia Weinig,
‡Katy D. Heath,* Marcus T. Brock
‡and Johanna Schmitt
§*Department of Ecology and Evolutionary Biology and†Centre for the Analysis of Genome Evolution and Function, University of Toronto, Toronto, Ontario M5S 3B2, Canada,‡Department of Botany, University of Wyoming, Laramie, Wyoming 82071
and§Department of Ecology and Evolutionary Biology, Brown University, Providence, Rhode Island 02912 Manuscript received October 7, 2008
Accepted for publication April 24, 2009
ABSTRACT
The importance of genes of major effect for evolutionary trajectories within and among natural populations has long been the subject of intense debate. For example, if allelic variation at a major-effect locus fundamentally alters the structure of quantitative trait variation, then fixation of a single locus can have rapid and profound effects on the rate or direction of subsequent evolutionary change. Using an Arabidopsis thaliana RIL mapping population, we compareG-matrix structure between lines possessing different alleles at ERECTA, a locus known to affect ecologically relevant variation in plant architecture. We find that the allele present at ERECTA significantly altersG-matrix structure—in particular the genetic correlations between branch number and flowering time traits—and may also modulate the strength of natural selection on these traits. Despite these differences, however, when we extend our analysis to determine how evolution might differ depending on the ERECTA allele, we find that predicted responses to selection are similar. To compare responses to selection between allele classes, we developed a resampling strategy that incorporates uncertainty in estimates of selection that can also be used for statistical comparisons ofGmatrices.
T
HE structure of the genetic variation that underlies phenotypic traits has important consequences for understanding the evolution of quantitative traits (Fisher 1930; Lande 1979; Bulmer 1980; Kimura1983; Orr 1998; Agrawal et al. 2001). Despite the
infinitesimal model’s allure and theoretical tractability (see Orr and Coyne 1992; Orr 1998, 2005a,b for
reviews of its influence), evidence has accumulated from several sources (artificial selection experiments, exper-imental evolution, and QTL mapping) to suggest that genes of major effect often contribute to quantitative traits. Thus, the frequency and role of genes of major effect in evolutionary quantitative genetics have been a subject of intense debate and investigation for close to 80 years (Fisher 1930; Kimura 1983; Orr 1998,
2005a,b). Beyond the conceptual implications, the prevalence of major-effect loci also affects our ability to determine the genetic basis of adaptations and species differences (e.g., Bradshawet al. 1995, 1998).
Although the existence of genes of major effect is no longer in doubt, we still lack basic empirical data on how segregating variation at such genes affects key compo-nents of evolutionary process (but see Carrie` re and
Roff1995). In other words, How does polymorphism at
genes of major effect alter patterns of genetic variation and covariation, natural selection, and the likely re-sponse to selection? The lack of data stems, in part, from the methods used to detect genes of major effect: experimental evolution (e.g., Bull et al. 1997; Zeyl
2005) and QTL analysis (see Ericksonet al. 2004 for a
review) often detect such genes retrospectively after they have become fixed in experimental populations or the species pairs used to generate the mapping pop-ulation. The consequences of polymorphism at these genes on patterns of variation, covariation, selection, and the response to selection—which can be transient (Agrawalet al. 2001)—are thus often unobserved.
A partial exception to the absence of data on the effects of major genes comes from artificial selection experiments, in which a substantial evolutionary re-sponse to selection in the phenotype after a plateau is often interpreted as evidence for the fixation of a major-effect locus (Frankham et al. 1968; Yoo 1980a,b;
Frankham 1980; Shrimpton and Robertson
1988a,b; Caballero et al. 1991; Keightley 1998; see
Mackay 1990 and Hill and Caballero 1992 for
reviews). However, many of these experiments report only data on the selected phenotype (e.g., bristle number) or, alternatively, the selected phenotype and some measure of fitness (e.g., Frankhamet al.1968, Yoo
1980b; Caballeroet al.1991; Mackayet al. 1994; Fry
1Corresponding author:University of Toronto, 25 Willcocks St., Toronto,
ON M5S 3B2, Canada. E-mail: [email protected]
et al. 1995; Nuzhdinet al. 1995; ZurLageet al. 1997),
making it difficult to infer how a mutation will affect variation, covariation, selection, and evolutionary re-sponses for a suite of traits that might affect fitness themselves. One approach is to document how variation at individual genes of major effect affects the genetic variance–covariance matrix (‘‘Gmatrix’’; Lande1979),
which represents the additive genetic variance and covariance between traits.
Although direct evidence for variation at major-effect genes altering patterns of genetic variation, covariation, and selection is rare, there is abundant evidence for the genetic mechanisms that could produce these dynam-ics. A gene of major effect could have these consequen-ces due to any of at least three genetic mechanisms: (1) pleiotropy, where a gene of major effect influences several traits, including potentially fitness, simulta-neously, (2) physical linkage or linkage disequilibrium (LD), in which a gene of major effect is either physically linked or in LD with other genes that influence other traits under selection, and (3) epistasis, in which the allele present at a major-effect gene alters the pheno-typic effect of other loci and potentially phenotypes under selection. Evidence for these three evolutionary genetic mechanisms leading to changes in suites of traits comes from a variety of sources, including mutation ac-cumulation experiments (Clarket al. 1995; Fernandez
and Lopez-Fanjul 1996), mutation induction
experi-ments (Keightleyand Ohnishi1998), artificial
selec-tion experiments (Longet al. 1995), and transposable
element insertions (Rollmannet al. 2006). For
pleiot-ropy in particular, major-effect genes that have con-sequences on several phenotypic traits are well known from the domestication and livestock breeding litera-ture [e.g., myostatin mutations in Belgian blue cattle and whippets (Arthur 1995; Grobet et al. 1997; Mosher
et al. 2007), halothane genes in pigs (Christian
and Rothschild1991; Fujiiet al. 1991), and Booroola
and Inverdale genes in sheep (Amer et al. 1999;
Visscher et al. 2000)]. While these data suggest that
variation at major-effect genes could—and probably does—influence variation, covariation, and selection on quantitative traits, data on the magnitude of these consequences remain lacking.
Recombinant inbred line (RIL) populations are a promising tool for investigating the influence of major-effect loci. During advancement of the lines from F2’s to RILs, alternate alleles at major-effect genes (and most of the rest of the genome) will be made homozygous, simplifying comparisons among genotypic classes. Be-cause of the high homozygosity, individuals within RILs are nearly genetically identical, facilitating phenotyping of many genotypes under a range of environments. In addition, because of recombination, alternative alleles are randomized across genetic backgrounds—facilitat-ing robust comparisons between sets of lines differbackgrounds—facilitat-ing at a major-effect locus.
Here we investigate how polymorphism at an artifi-cially induced mutation, the erecta locus in Arabidopsis thaliana, affects the magnitude of these important evolutionary genetic parameters under ecologically re-alistic field conditions. We use the Landsberg erecta
(Ler)3Columbia (Col) RIL population ofA. thalianato examine how variation at a gene of major effect in-fluences genetic variation, covariation, and selection on quantitative traits in a field setting. The Ler3Col RIL population is particularly suitable, because it segregates for an artificially induced mutation at theerecta locus, which has been shown to influence a wide variety of plant traits. The Ler 3 Col population thus allows a powerful test of the effects of segregating variation at a gene—chosen a priori—with numerous pleiotropic ef-fects. TheERECTAgene is a leucine-rich receptor-like kinase (LRR-RLK) (Toriiet al. 1996) and has been
shown to affect plant growth rates (El-Lithyet al. 2004),
stomatal patterning and transpiration efficiency (Masle
et al. 2005; Shpak et al. 2005), bacterial pathogen
resistance (Godiard et al. 2003), inflorescence and
floral organ size and shape (Douglaset al. 2002; Shpak
et al. 2003, 2004), and leaf polarity (Xuet al. 2003; Qi
et al. 2004).
Specifically, we sought to answer the following ques-tions: (1) Is variation at erecta significantly associated with changes to theGmatrix? (2) Is variation aterecta
associated with changes in natural selection on genet-ically variable traits? And (3) is variation at erecta
associated with significantly different projected evolu-tionary responses to selection?
MATERIALS AND METHODS
Plant material and experimental design:A. thaliana (com-mon name: mouse-ear cress) is a largely selfing annual plant, native to Eurasia and recently introduced to North America ( Jorgensenand Mauricio2004). Plants initially grow as a vegetative rosette until they bolt and produce a flowering in-florescence from the apical meristem. Branches are produced both on the inflorescence and from the rosette. We charac-terized the size, architecture, and phenology of plants from a simple set of measurements: diameter of the rosette, the number of inflorescence branches, the number of basal ro-sette branches (hereafter, basal branches), and bolting date. We estimated reproductive fitness from fruit number, which is highly correlated with seed number (Westerman and Lawrence1970; Mauricioand Rausher1997).
fitness (Weiniget al. 2003a). An appreciable number of plants per RIL suffered rabbit herbivory, which in turn affected a host of phenotypic traits (Weiniget al. 2003a,b). We analyze only data from the replicates of each RIL that escaped herbivory. Sample sizes ranged fromN¼8 to 28 individuals per RIL, with a median¼18 or 19 individuals, depending on the trait.
Data analysis:To examine the effect of variation aterectaon genetic variances and covariances between the four traits (rosette diameter, bolting time, inflorescence branches, and rosette branches), we first split the data set according to which erecta allele the lines contained, as determined from the Nottingham Arabidopsis Stock Centre (http://arabidopsis. info/). RILs lacking erecta genotype information were ex-cluded from subsequent analyses. (Recall that the Lerparent in the cross was the source of the mutanterectaallele.)
We compared genetic variance–covariance matrices for lines with alternateerectaalleles using the program CPCrand (Phillips and Arnold 1999). CPCrand tests a series of hypotheses about matrix similarity by examining whether the matrices share principal components, are proportional to each other, or are in fact equal to each other (i.e., whetherG matrices are identical between groups of lines with different erecta alleles). Each of these hypotheses in the ‘‘jump-up’’ approach (Phillips and Arnold 1999) is tested against a null model of unrelated matrix structure by comparing the results of a likelihood-ratio test to those obtained with a large number of randomizations. CPCrand has become a common method of comparing genetic variance–covariance matrices (see Caruso et al. 2005; Stinchcombe and Schmitt 2006; Brockand Weinig2007; Doroszuket al. 2008). Because we elected to multiply theGmatrix by biologically informative vectors (i.e., selection gradients, see below), we did not use the random skewers method (Cheverud 1996) for G-matrix comparison.
Analysis of raw phenotypic data with CPCrand required a high degree of matrix bending (because of negative eigenval-ues), which has yet to be verified when used with randomiza-tion tests for hypothesis testing (CPCrand documentarandomiza-tion). To alleviate this problem, we estimated best linear unbiased predictors (BLUPs) for each trait for all of the RILs in the experiment using restricted maximum likelihood (Proc Mixed, SAS). We then used these BLUPs in the ‘‘phenotypic analysis’’ option of CPCrand to estimateGmatrices as if they were phenotypic variance–covariance matrices, using 5000 randomizations. Utilizing BLUPs eliminated the need for matrix bending, as the estimated matrices were positive definite. AllG-matrix comparisons for theerectalocus showed similar patterns of statistical significance when using either the raw phenotypic data or theGmatrices estimated from BLUPs. The exact null distribution of test statistics to use for testing whether lines with alternate alleles aterecta(or any locus) have similarGmatrices remains unclear. For instance, because we analyzed an RIL population, lines with the sameerectalocus will differ at other loci throughout the genome, and, con-versely, lines with alternateerecta alleles will be the same at other loci throughout the genome; how this might affect hypothesis testing forG-matrix similarity is unknown. There-fore, to address to the likelihood of obtaining significant differences inG-matrix structure simply by splitting the data according to any single marker locus, we performed similar analyses to those described above for 52 other reference loci, which were chosen to be evenly spaced throughout the genome and not underlying QTL for the traits in question in this experiment. From these analyses, we estimated a null distribution of test statistics forG-matrix similarity. Because our goal was to estimate a null distribution, we use only the test statistics for the level of the CPC hierarchy that correspond to hypothesis tests forerecta.
We also implemented a likelihood-based approach to test the null hypothesis that a singleGmatrix,vs.twoGmatrices corresponding to theerectaallele classes, adequately described our data. To do this, we estimated a multivariateGmatrix in SAS using Proc Mixed (SAS v. 9.1.3), using the factor-analytic modeling approach described by Hine and Blows (2006). This approach, which estimates the effective number of principal components of theGmatrix, reduces the number of parameters necessary to describe the pattern of variance– covariance (see Huntet al. 2007; Mcguiganand Blows2007; Doroszuket al. 2008; Mcguiganet al. 2008). Within a factor analytic modeling framework, we evaluated whether a model allowing for separateGmatrices for the twoerectaallele classes, vs.a singleGmatrix, provided a better fit to the data using likelihood-ratio tests and the ‘‘group ¼ ’’ option of the ‘‘random’’ statement in Proc Mixed (following Doroszuk et al. 2008).
To determine whethererectainfluences natural selection, we estimated selection gradients (Rausher1992; Stinchcombe et al. 2002). We regressed BLUPs for relative fitness on the BLUPs for the four traits; the partial regression coefficients from these models estimate directional selection gradients. Selection gradients estimated with breeding values are equal to traditional phenotypic selection gradients (Lande and Arnold 1983) in the absence of environmentally induced covariances between traits and fitness (Rausher1992). In an initial model, we included erectaallelic class as a categorical variable and erecta 3 trait interaction terms. Because of a marginally significant interaction betweenerectaand inflores-cence branch number for relative fitness in this initial model, we subsequently estimated selection gradients for eacherecta allele class separately. In practice, the overlapping 95% confidence limits of these estimates will not bias quantitative predictions, as the methods we use incorporate uncertainty in the parameter estimates (see below).
To examine whether variation aterectawas associated with different responses to selection, we solved the equationDz¼
Gbfor eacherectaallele class, whereGis the genetic variance– covariance matrix (estimated as the variances and covariances of the BLUPs),bis a vector of directional selection gradients, and Dz is a vector describing the change in the mean phenotype. Conceivably, a similar approach could be used to examine whether the loss of genetic variation due to selection [given by DG ¼ G(g bbT)G, where g is the matrix of nonlinear selection gradients (Landeand Arnold1983)] or the orientation ofGandg(Blowset al.2004) is affected by variation aterecta( J. R. Stinchcombe, unpublished data).
Placing confidence limits onDzis rarely done (e.g., Conner and Via1992; Ettersonand Shaw2001; Caruso2004; but see Smith and Rausher 2008), and existing published analytical methods (Mccullochet al. 1996) have yet to be implemented. To estimate uncertainty inDz, we developed a parametric bootstrapping approach. We considered each point estimate of bi as the mean of a normal distribution,
with standard deviation equal to the standard error of the regression coefficient. We then drew 999 values from each of these normal distributions independently; samples were drawn from each distribution independently, as the multiple regression used to obtain bi (and their standard errors)
estimates direct selection on the traits while statistically controlling for selection on the other traits in the regression model. For traits for which erecta was not associated with significant differences in bi, these random draws sample
confidence limits for eachDzi. Because this approach does not capture uncertainty in the estimation ofG, it underestimates of the confidence limits onDz.
RESULTS
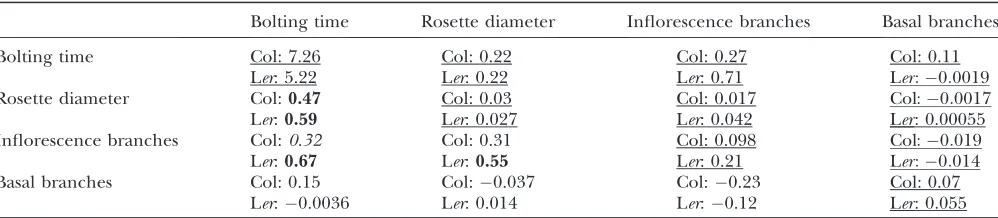
Patterns of G-matrix similarity: Analysis with CPCrand suggests that G matrices differ significantly depending on whicherectaallele is present. Specifically, the hypothesis of 1 common principal component is rejected (likelihood ratio¼11.7386,P¼0.0174 on the basis of 5000 randomizations). The G matrices and genetic correlation matrices for the Col and Ler erecta
alleles are presented in Table 1, with bivariate plots in Figure 1. Qualitatively, the differences between these matrices are likely driven by correlations/covariances involving inflorescence branches. For example, in lines with the Ler erectaallele, inflorescence branch number is highly correlated with bolting time and rosette diame-ter, while showing a weak negative correlation with basal branch number. In lines with the Colerecta allele, the correlations between inflorescence branch number and bolting time and rosette diameter are reduced (by approximately one-half), while the correlation between inflorescence branch number and basal branch number is approximately twice as negative (Figure 1).
Despite the significant differences in G matrices detected by CPCrand, principal components analysis (PCA) revealed that the angle (u) between PC1 of the twoGmatrices was 5.9°, indicating close alignment of the first eigenvectors. In other words, the main di-rection of genetic variation in multivariate trait space is similar for the two allele classes. Nevertheless, the PCA also suggests that significant differences in theG ma-trices are driven by differences in genetic variances and covariances associated with inflorescence branches and basal branches between the twoerectaallele groups. For both Col and Ler erectaalleles, PC1 explains.96% of the genetic variation (Table 2). For inflorescence branches, the loading on PC1 is approximately threefold higher for lines with the Ler erectaallele than for lines with the
Colerectaallele. For basal branches, although this trait does not load heavily on PC1 for either allele class, the loading for lines with the Colerectaallele is higher than for lines with the Lerallele.
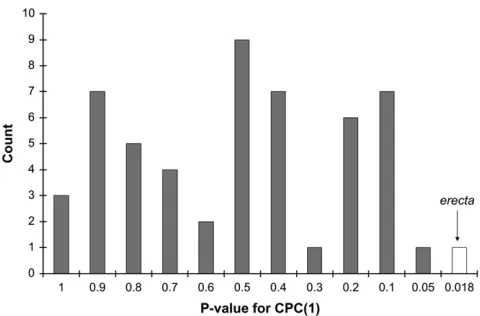
Genomewide distribution of CPCrand results: To evaluate how likely it would be to get significant CPCrand results simply by splitting the data into two allelic classes at any locus, we performed CPCrand analyses for 52 markers chosen throughout the genome. For each of these markers, we saved theP-value of the hypothesis test of 1 common principal component [CPC(1)]; all of these hypothesis tests were based on 5000 randomizations, using a genetic variance– covariance matrix estimated from BLUPs. The overall distribution ofP-values suggests that rejection of 1 com-mon principal component is rare (Figure 2)—i.e., for 98% of the markers used, lines with alternate alleles shared at least 1 principal component. TheP-value for rejecting CPC(1) for the erecta locus was the most extremeP-value we obtained, and for only 1 other marker locus (mi238) was the hypothesis of CPC(1) rejected at the a ¼ 0.05 level. These results suggest that the significant differences inG-matrix structure detected by CPCrand forerectaare rare on a genomewide basis.
Factor-analytic modeling of the G matrix: Factor-analytic modeling suggested thatGwas of full rank (i.e., all four eigenvalues were significantly different from zero). These results held whether we fit factor analytic models (FA0) using unstandardized data that included a main effect of the trait to control for the trait mean or using data where the traits were standardized to a mean of 0 and a variance of 1 (cf.Huntet al. 2007). In both
cases, decreasing from FA0(4) to FA0(3) (i.e., from four to three PCs) led to significantly worse model fit ac-cording to likelihood-ratio tests (unstandardized data, x2¼5.8, d.f.¼1,P¼0.016; standardized data,x2¼6.9, d.f.¼1,P¼0.0086). Moreover, for both unstandardized and standardized data, estimation of separateGmatrices for differenterecta allele classes significantly improved model fit (unstandardized, x2 ¼ 26.7, d.f. ¼ 10, P ¼ 0.0039; standardized, x2¼23.5, d.f.¼10, P ¼0.009), TABLE 1
Genetic variance–covariance and correlation matrices for RILs containing either Col or Ler erectaalleles
Bolting time Rosette diameter Inflorescence branches Basal branches
Bolting time Col: 7.26 Col: 0.22 Col: 0.27 Col: 0.11
Ler: 5.22 Ler: 0.22 Ler: 0.71 Ler:0:0019
Rosette diameter Col:0.47 Col: 0.03 Col: 0.017 Col:0:0017
Ler:0.59 Ler: 0.027 Ler: 0.042 Ler: 0.00055
Inflorescence branches Col:0.32 Col: 0.31 Col: 0.098 Col:0:019
Ler:0.67 Ler:0.55 Ler: 0.21 Ler:0:014
Basal branches Col: 0.15 Col:0.037 Col:0.23 Col: 0.07
Ler:0.0036 Ler: 0.014 Ler:0.12 Ler: 0.055
suggesting thatGmatrices differed betweenerectaallele classes.
Because G matrices are frequently not of full rank (Hineand Blows2006; Huntet al. 2007; Mcguigan
and Blows2007; Doroszuket al. 2008; Mcguiganet al.
2008), and PC1 of theGmatrices explained such a large fraction of genetic variation (vs. PCs 3 and 4; Table 2), we also repeated the likelihood-ratio tests for scenarios
where theGmatrices were constrained to have only 1, 2, or 3 PCs. These analyses test the hypothesis of whether separateGmatrices are supported even when all of the genetic variation and covariation is described by a reduced number of axes. In all cases, we found that estimating separate Gmatrices for lines with different
erectaalleles provided significantly better fits to the data (x2.26.6,P,0.0011 for all comparisons).
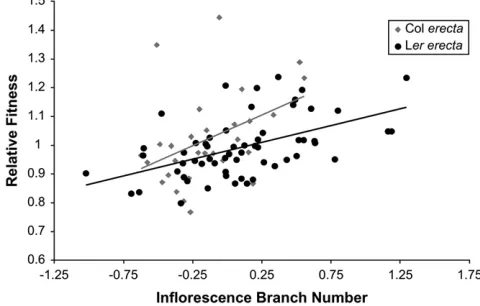
Patterns of natural selection: Analysis of covariance for relative fitness suggested marginally significant evidence that natural selection on inflorescence branches differed depending on the erecta locus and that variation aterectawas associated with differences in relative fitness (Table 3; Figure 3). Accordingly, we estimated selection gradients for the four traits sepa-rately for eacherectaallele class (Table 4).
For lines that contained the Col erecta allele, we detected significant directional selection to increase rosette diameter, the number of inflorescence branches, and the number of basal branches (Table 4)—bigger plants with more branches had higher relative fitness. In lines that contained the Ler erecta allele, we found a similar pattern: directional selection significantly favored larger rosette diameters and more inflorescence and basal branches. The selection gradient estimates suggest larger gradients for lines with the Col allele, although the ANCOVA indicates that these differences approached significance only for inflorescence branches.
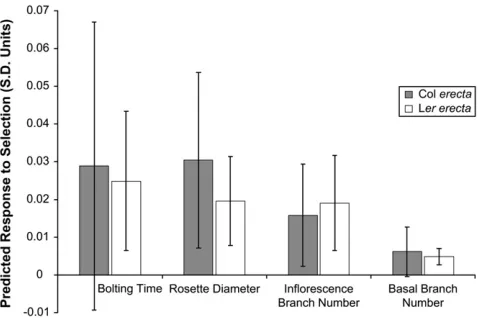
Predicted responses to selection:Despite significant genetic variation in the four traits, and significant nat-ural selection on three of them, the predicted responses to natural selection remain small—both in original trait units (data not shown) and when judged relative to the phenotypic standard deviation of the traits (Figure 4). Comparison of Tables 1 and 4 reveals a likely mecha-nism: for the three traits under the strongest natural selection (rosette diameter, inflorescence branches, and basal branches), there is appreciably less genetic varia-tion, in either allelic class. Conversely, the trait under the weakest natural selection (bolting time) showed the greatest genetic variance.
Despite differences betweenerectaallele classes in the point estimates for genetic variances, for covariances, and possibly for selection gradients, similar predicted responses to selection are obtained for these two classes (Figure 4). The apparent differences between erecta
allele classes in the patterns of genetic variance/co-variance for inflorescence branches (Table 1), when combined with the differences in the estimated selec-tion gradients (Table 4), show a ‘‘canceling-out’’ pat-tern. In lines with Ler erecta(compared to those with Col), direct selection on inflorescence branch number
is weaker, yet this trait has larger variance and stronger pairwise covariances and correlations with two other traits (rosette diameter and bolting time). Vice versa, inflorescence branch number is under stronger selec-tion in lines with Colerecta, yet variance as well as the covariances and correlations between inflorescence branches and rosette diameter, and inflorescence branches and bolting time, are of smaller magnitude. Placing confidence intervals on the predicted responses to selection by incorporating variation in the estimation ofbreveals that the small differences obtained in the point estimates ofDzare within the range of estimation uncertainty.
DISCUSSION
Our results indicate that alternate alleles at theerecta
locus are associated with both significant changes inG -matrix structure and marginally significant differences in natural selection. Nevertheless, our results predict relatively minor differences in the expected response to natural selection. There appear to be multiple mecha-nisms behind this discrepancy. First, overall selection in this experiment was weak for the three traits that ex-TABLE 2
PCA of the estimated G matrices for Col and Ler erectaalleles
Colerecta Ler erecta
PC1 PC2 PC3 PC4 PC1 PC2 PC3 PC4
Bolting time 0.9987 0.0264 0.0341 0.0271 0.9895 0.1391 0.0293 0.026
Rosette diameter 0.03059 0.11945 0.01396 0.99227 0.04271 0.10187 0.07858 0.99077
Inflorescence branches 0.03784 0.8223 0.55742 0.108 0.13806 0.96435 0.19105 0.1203
Basal branches 0.01517 0.5557 0.82941 0.05477 0.0007 0.2007 0.97799 0.0569
Percentage of variance explained 97.59 1.40 0.71 0.30 96.59 2.16 0.96 0.29
hibited substantial genetic variances and covariances. Second, the same trait that exhibited stronger selection but lower genetic variance and covariances in oneerecta
allele class exhibited weaker selection but higher variance in the other allele class. Finally, detecting significant differences in the predicted response to selection is likely to be quite challenging, given estimation uncertainty. Below, we discuss these results in light of past work on the role of major genes in evolution and the challenges of statistically comparing predicted responses to natural selection.
Evolution and genes of major effect:The last 15 years have led to an increasing acceptance that genes of major effect contribute to adaptive evolution. Orr (1998,
2005a,b) has noted that growing acceptance of this result was due, in part, to widespread QTL mapping results showing chromosomal regions of major effect and experimental evolution studies that showed muta-tions with large fitness effects, along with the lack of convincing data in favor of many alleles of small effect (Orr and Coyne 1992). The acceptance of genes of
major effect was probably also aided by the intriguingly similar distributions of empirically detected QTL effects and Orr’s (1998) theoretically derived distributions.
These QTL and experimental evolution results were consistent with earlier results from Drosophila quanti-tative genetics and plant genetics (e.g., Frankhamet al.
1968; Frankham 1980; Yoo 1980a,b; Gottlieb 1984,
1985). Likewise, Robertson(1967) predicted that the
distribution of effect sizes for genes affecting a trait would be leptokurtic, with many genes having small to no effects and a few having large effects.
Despite the acceptance of the role of major genes in evolution, we still have remarkably little knowledge of how polymorphism at these genes will affect the microevolution of quantitative traits. In the study most directly comparable to ours, Carrie` reand Roff(1995)
examined how the evolution of insecticide resistance affected the heritabilities and genetic correlations
between life history traits and insecticide resistance in natural populations of the oblique-banded leaf roller [Choristoneura rosaceana (Lepiodoptera: Tortidae)]. They found that the spread of resistance allele(s) increased the additive genetic variance in larval weight and diapause propensity and decreased the genetic correlation between these traits, consistent with their theoretical predictions (Carrie` re and Roff 1995).
Using an experimental genetic approach, Bradshaw
and Schemske(2003) reciprocally introgressedYELLOW
UPPER (YUP) floral color alleles derived fromMimulus lewisii and M. cardinalis into the alternate species and measured changes in pollinator attraction and visitation. Variation at this locus was sufficient to change the pollinator visitation, suggesting that reproductive iso-lation due to pollinator preferences could be due to a single allele. Although Bradshawand Schemske(2003)
did not report how variation at the YUPlocus affected the correlations between, or selection on, floral traits, it is not difficult to envision pollinator-mediated selection on floral color and floral design.
Our results suggest that polymorphism at genes of major effect can have statistically significant effects on
G-matrix structure. The most striking results we ob-tained were the nearly twofold differences in the genetic correlations involving inflorescence branch number and either bolting time or rosette diameter. Therefore, our results suggest that allelic variation at major-effect loci can influence the direction of trait variation avail-able to natural selection. We might have predicted that alternate erecta alleles would affect plant architecture traits, given past findings of QTL centered onerecta[e.g., apical inflorescence and basal branch height QTL (Weinig et al. 2003b) and flowering time under
short days (Weinig et al. 2002)], as well as the
con-firmed effects of the gene itself on organ size and shape (Douglas et al. 2002; Shpak et al. 2003, 2004;
Kliebenstein2007).
Figure3.—Graphical portrayal of natural selection on in-florescence branch number, depending on the erectalocus. The difference in the slopes of the lines is marginally signif-icant.
TABLE 3
Analysis of covariance for relative fitness, testing the effects
oferecta, phenotypic traits, and theerecta3trait interactions
Source d.f. F P
erecta 1 2.70 0.104
Bolting time 1 0.41 0.53
Rosette diameter 1 16.72 0.0001 Inflorescence branches 1 18.02 ,0.0001 Basal branches 1 28.50 ,0.0001 erecta3bolting time 1 0.51 0.48 erecta3rosette diameter 1 2.46 0.12 erecta3inflorescence branches 1 2.84 0.096 erecta3basal branches 1 0.45 0.50
Error 78
While our results for G-matrix comparisons were statistically significant by a variety of approaches and our analysis of marker loci suggested that significantG -matrix differentiation was unlikely to occur by chance alone, the quantitative magnitude of the differences detected appears small. The interpretation of slight quantitative effect onG-matrix structure is supported by the similarity of the eigenvectors of eachGmatrix, the close alignment of PC1 of each matrix in multivariate space (i.e., the angle between them), and the similar responses to selection produced by each G matrix. These findings point to the need for statistically signif-icantG-matrix comparisons to be interpreted in light of their biological significance. Surprisingly, of the suite of tools available forG-matrix comparisons (see Steven
et al.2007 and Doroszuket al. 2008 for overviews), few
investigators have pairedGmatrices with estimates of natural selection (b vectors) to see if the predicted response to selection will differ (see below).
Our use of the ERECTAto examine the effects of a mutation at a highly pleiotropic gene on G-matrix structure, selection, and the response to selection entailed both benefits and costs. On the one hand,
erectais an induced mutation and may provide a better model of new mutations—upon which much of the theoretical work is based—than standing genetic varia-tion. The incorporation oferectainto an RIL mapping population also breaks up associations between erecta
alleles and their respective Landsberg and Columbia genomes, which would otherwise confound estimation of the effects of thisERECTA.In addition, theERECTA
gene is highly pleiotropic, and mutations to it (induced or natural) may have greater consequences on a suite of traits than mutations to typical genes throughout the genome and thus enhanced our power to detect effects onG-matrix structure and selection. On the other hand, these same factors also could represent disadvantages. For instance, it is clearly possible (perhaps likely) that the induced erecta mutation is not representative of naturally occurring mutations at this gene, and the pleiotropic nature of theERECTAgene is not likely to be representative of all genes throughout the genome. Both of these interpretations are supported by our analyses of reference loci that indicated that most loci shared at least 1 PC and by other studies from the literature that suggest pleiotropy may be restricted and limited to functionally integrated units (e.g., Cheverud
et al. 1997). The relatively small Ler 3 Col mapping population may have inflated the effect sizes associated witherectaand limits our ability to distinguish between the effects oferecta vs. neighboring loci. In addition, RIL crosses often estimate genetic variance associated with divergence between populations, and thus the genetic variances, covariances, and selection detected using them may not be reflective of standing genetic variation
within populations (e.g., Agrawal et al. 2001; Orr
2005b). Ultimately resolving any of these issues would be a daunting empirical challenge. However, our find-ings that variation aterectais significantly associated with changes in G-matrix structure and possibly natural selection nonetheless illustrate how polymorphism at major genes can affect contemporary patterns of ge-netic (co)variation and selection.
Predicting the response to selection: Intensive ef-fort over the last 25 years has been devoted to estimating natural selection in the wild (see Endler 1986;
Hoekstra et al. 2001; Kingsolver et al. 2001; Geber
TABLE 4
Genotypic selection gradients estimated from BLUPS, estimated separately for RILs with alternateerectaalleles
Colerecta Ler erecta
Trait b(SE) P b(SE) P Genetics Phenotypics
Bolting time 0.0073 (0.01) 0.49 0.0004 (0.06) 0.95 2.41 4.35
Rosette diameter 0.415 (0.15) 0.012 0.185 (0.07) 0.015 0.19 0.47 Inflorescence branches 0.212 (0.08) 0.017 0.092 (0.03) 0.0027 0.43 1.31 Basal branches 0.258 (0.09) 0.010 0.20 (0.04) ,0.0001 0.26 2.03
For ColerectaA,N¼29 lines; for Ler erecta,N¼59 lines. For purposes of comparison, genetic and phenotypic standard deviations for the traits are also provided (calculated from the entire data set). Significant selection gradients are shown in boldface type.
and Griffen2003; Herefordet al. 2004). While these
efforts may have clarified the typical strength of selec-tion, they are rarely combined with estimates of genetic variation to predict evolutionary trajectories. Houle
(2007) recently noted how surprising it is that estimates ofGandbare rarely (with some exception) obtained from the same population and also rarely combined to make quantitative predictions. Theoretical work (Turelliand Barton1990, 1994; Bartonand Turelli
1991) has shown that predictions based on the in-finitesimal model are robust to the genetic details underlying the traits for predictions made over a short number of generations, suggesting that these predic-tions could be useful.
We suggest that one challenge currently inhibiting predictions of multivariate evolution—apart from ob-taining the necessary data—is that there are no ac-cepted methods for placing confidence limits on estimates of Dz or significance testing of Dz. In the univariate case, investigators have compared the actual response to selection to predictions from the breeders equation (R¼h2s) and placed uncertainty estimates on
Rby using the upper and lower confidence limits of the heritability or selection differential estimates (Galen
1996; Grantand Grant2006). Simply using the upper
and lower confidence limits ofbiis not applicable to the multivariate case, as it is uncleara prioriwhich combi-nations of upper and lower estimates ofbishould be multiplied withG.
For multivariate responses to selection, several inves-tigators have predictedDz(e.g., Connerand Via1992;
Mitchell et al. 1998; Etterson and Shaw 2001;
Caruso 2004), yet were unable to place confidence
limits on their estimates. Ettersonand Shaw(2001)
tested the significance of the predicted response to selection, estimated as the additive genetic covariance between a trait and fitness, with likelihood-ratio tests that compared the fitted model to one in which the correlation was constrained to equal zero. Using a different approach, Caruso (2004) compared Dz to
selection to b using a t-test, taking advantage of the standard error of theb-estimates obtained by regression. The benefit of our approach is that predicted responses to selection can be compared to zero for significance testing, as well as to other specified values (e.g.,Dzfor a different treatment or allelic class, tob, to univariate predictions). The approach inherits all of the assumptions of selection analyses (Mitchell-Oldsand
Shaw1987) and adds the assumption that individual
bi’s are themselves sampled from normal distributions.
An alternative would be to bootstrap the multiple regressions used to estimate b, sample individual bi’s
from these bootstrap distributions (e.g., Calsbeekand
Smith 2007), and combine them with G to place
confidence intervals on Dz. Our method is similar to the one used by Frankset al. (2007), who sampled from
bootstrapped distributions of both parent–offspring
regressions and selection differential estimates to pro-duce confidence limits onR.Regardless of the method used to incorporate uncertainty in b, the confidence limits generated by our method are underestimates, as no variation in the elements of G is included in the estimation. Conceivably, families or inbred lines could be sampled with replacement to create bootstrapped estimates ofG(e.g., Smithand Rausher2008), which
could then be combined with b’s estimated from the parametric boostrap to produce a confidence limit, although this is likely to be computationally intensive if
Gis estimated with likelihood. Despite the limitation of not incorporating uncertainty in G, we argue that an underestimate of the confidence limits ofDzis better than no estimate.
One additional benefit of placing confidence limits onDzis that it can be used to compareGmatrices. For a given strength and pattern of selection, the evolutionary response will be determined by the patterns of variation and covariation described by G (Lande 1979). An
effective means of comparing G matrices is thus to ask, for a given strength of selection, Are there differ-ences in Dz? Our approach is similar to the ‘‘random skewers’’ method developed by Cheverud (Cheverud
et al. 1983; Cheverud 1996; Cheverudand Marroig
2007) as well as to recent work by Smithand Rausher
(2008) and Hansenand Houle(2008). In the random
skewers method, randomly drawn vectors (with rows equal to the dimension ofG) are combined with theG
matrices being compared, and the distribution of vector correlations between the Dz’s are compared. Steven
et al.(2007) modify the skewers approach and compare Dz’s for differentGby multiplying them by hypothetical (yet ecologically realistic)b, a useful approach for when
bis either unknown or likely to change during adapta-tion. Smithand Rausher(2008) compare the angles of
response vectors after projecting them onto a plane, while Hansen and Houle (2008) calculate the
‘‘re-sponse difference’’ by multiplying two Gmatrices (G1 andG2) by a givenband calculating the vector norm of the difference betweenDz1andDz2(i.e.,jDz1Dz2j). Hansen and Houle (2009) give expressions for the
expectations of this norm over random selection gra-dients, as a general measure of response differences betweenG1andG2whenbis unknown.
Conclusions and future directions: Understanding the role of genes of major effect in contemporary microevolution is likely to be an ongoing challenge. While intuition might suggest that genes of major effect, or those that affect several traits at once, might speed adaptation, their spread through populations will ulti-mately be determined by the relationship between the traits they affect and fitness and any trade-offs they generate with other traits under selection. Our results suggest that pleiotropic genes of major effect will not necessarily have dramatic effects on evolutionary trajec-tories, although whether this is a general pattern remains an empirical question. A major goal for future empirical work will be to determine how any naturally segregating genes of major effect influence the micro-evolution of quantitative traits.
We thank Aneil Agrawal, Mark Blows, Emma Hine, Bill Hill, Allen Orr, Patrick Phillips, and Bruce Walsh for discussion and B. Beavis and two anonymous reviewers for comments. Our research is supported by grants from National Sciences and Engineering Research Council Canada and the Canadian Foundation for Innovation ( J.R.S.), the National Science Foundation (C.W., M.T.B., J.S.), and the University of Toronto Ecology and Evolutionary Biology Post-Doc program (K.D.H.).
LITERATURE CITED
Agrawal, A. F., E. D. Brodieand L. H. Rieseberg, 2001 Possible consequences of genes of major effect: transient changes in the G-matrix. Genetica112:33–43.
Amer, P. R., J. C. McEwan, K. G. Dodds and G. H. Davis, 1999 Economic values for ewe prolificacy and lamb survival in New Zealand sheep. Livest. Prod. Sci.58:75–90.
Arthur, P. F., 1995 Double muscling in cattle: a review. Aust. J. Agric. Res.46:1493–1515.
Barton, N. H., and M. Turelli, 1991 Natural and sexual selection on many loci. Genetics127:229–255.
Blows, M. W., S. F. Chenowethand E. Hine, 2004 Orientation of the genetic variance-covariance matrix and the fitness surface for multiple male sexually selected traits. Am. Nat.163:329–340. Bradshaw, H. D., and D. W. Schemske, 2003 Allele substitution at a
flower colour locus produces a pollinator shift in monkeyflowers. Nature426:176–178.
Bradshaw, H. D., S. M. Wilbert, K. G. Ottoand D. W. Schemske, 1995 Genetic mapping of floral traits associated with reproduc-tive isolation in monkeyflowers (Mimulus). Nature376:762–765. Bradshaw, H. D., K. G. Otto, B. E. Frewen, J. K. Mckayand D. W. Schemske, 1998 Quantitative trait loci affecting differences in floral morphology between two species of monkeyflower ( Mimu-lus). Genetics149:367–382.
Brock, M. T., and C. Weinig, 2007 Plasticity and environment-specific covariances: an investigation of floral-vegetative and within flower correlations. Evolution61:2913–2924.
Bull, J. J., M. R. Badgett, H. A. Wichman, J. P. Huelsenbeck, D. M. Hilliset al., 1997 Exceptional convergent evolution in a virus. Genetics147:1497–1507.
Bulmer, M. G., 1980 The Mathematical Theory of Quantitative Genetics. Oxford University Press, Oxford.
Caballero, A., M. A. Toroand C. Lopez-Fanjul, 1991 The re-sponse to artificial selection from new mutations inDrosophila mel-anogaster.Genetics128:89–102.
Calsbeek, R., and T. B. Smith, 2007 Probing the adaptive landscape using experimental islands: density-dependent natural selection on lizard body size. Evolution61:1052–1061.
Carrie` re, Y., and D. A. Roff, 1995 Change in genetic architecture resulting from the evolution of insecticide resistance: a theoret-ical and empirtheoret-ical analysis. Heredity75:618–629.
C , C. M., 2004 The quantitative genetics of floral trait varia-tion inLobelia: potential constraints on adaptive evolution. Evo-lution58:732–740.
Caruso, C. M., H. Maherali, A. Mikulyuk, K. Carlsonand R. B. Jackson, 2005 Genetic variance and covariance for physiologi-cal traits inLobelia: Are there constraints on adaptive evolution? Evolution59:826–837.
Cheverud, J. M., 1996 Quantitative genetic analysis of cranial mor-phology in the cotton-top (Saguinus oedipus) and saddle-back (S. fuscicollis) tamarins. J. Evol. Biol.9:5–42.
Cheverud, J. M., and G. Marroig, 2007 Comparing covariance ma-trices: random skewers method compared to the common prin-cipal components model. Genet. Mol. Biol.30:461–469. Cheverud, J. M., J. J. Rutledgeand W. R. Atchley, 1983
Quan-titative genetics of development: genetic correlations among age-specific trait values and the evolution of ontogeny. Evolution
37:895–905.
Cheverud, J. M., E. J. Routmanand D. J. Irschick, 1997 Pleio-tropic effects of individual gene loci on mandibular morphology. Evolution51:2006–2016.
Christian, L. L., and M. F. Rothschild, 1991 Performance carcass characteristics of normal stress carrier and stress-susceptible swine. Animal Science Research Report AS-528-F. Iowa State University Press, Ames, IA.
Clark, A. G., L. Wang and T. Hulleberg, 1995 Spontaneous mutation-rate of modifiers of metabolism in Drosophila.Genetics
139:767–779.
Conner, J., and S. Via, 1992 Natural selection on body size in Tribo-lium: possible genetic constraints on adaptive evolution. Heredity
69:73–83.
Doroszuk, A., M. Wojewodzic, G. Gort and J. Kammenga, 2008 Rapid divergence of genetic variance-covariance matrix within a natural population. Am. Nat.171:291–304.
Douglas, S. J., G. Chuck, R. E. Dengler, L. Pelecandaand C. D. Riggs, 2002 KNAT1 and ERECTA regulate inflorescence archi-tecture inArabidopsis.Plant Cell14:547–558.
Erickson, D. L., C. B. Fenster, H. K. Stenoien and D. Price, 2004 Quantitative trait locus analyses and the study of evolu-tionary process. Mol. Ecol.13:2505–2522.
El-Lithy, M. E., E. J. M. Clerkx, G. J. Ruys, M. Koornneefand D. Vreugdenhil, 2004 Quantitative trait locus analysis of growth-related traits in a newArabidopsisrecombinant inbred popula-tion. Plant Physiol.135:444–458.
Endler, J. A., 1986 Natural Selection in the Wild.Princeton University Press, Princeton, NJ.
Etterson, J. R., and R. G. Shaw, 2001 Constraint to adaptive evo-lution in response to global warming. Science294:151–154. Fernandez, J., and C. Lopez-Fanjul, 1996 Spontaneous mutational
variances and covariances for fitness-related traits inDrosophila melanogaster.Genetics143:829–837.
Fisher, R. A., 1930 The Genetical Theory of Natural Selection.Oxford University Press, Oxford.
Frankham, R., 1980 Origin of genetic variation in selection lines, pp. 56–68 inSelection Experiments in Laboratory and Domestic Ani-mals, edited by A. Robertson. Commonwealth Agricultural Bureaux, Slough, UK.
Frankham, R., L. P. Jonesand J. S. F. Barker, 1968 Effects of pop-ulation size and selection intensity in selection for a quantitative character inDrosophila.3. Analyses of lines. Genet. Res.12:267. Franks, S. J., S. Simand A. E. Weis, 2007 Rapid evolution of flower-ing time by an annual plant in response to a climate fluctuation. Proc. Natl. Acad. Sci. USA104:1278–1282.
Fry, J. D., K. A. Derondeand T. F. C. Mackay, 1995 Polygenic mu-tation in Drosophila melanogaster: genetic-analysis of selection lines. Genetics139:1293–1307.
Fujii, J., K. Otsu, F. Zorzato, S. Deleon, V. K. Khanna et al., 1991 Identification of a mutation in porcine ryanodine receptor associated with malignant hyperthermia. Science253:448–451. Galen, C., 1996 Rates of floral evolution: adaptation to bumblebee
pollination in an alpine wildflower,Polemonium viscosum. Evolu-tion50:120–125.
Geber, M. A., and L. R. Griffen, 2003 Inheritance and natural selection on functional traits. Int. J. Plant Sci.164:S21–S42. Godiard, L., L. Sauviac, K. U. Torii, O. Grenon, B. Manginet al.,
development pleiotropically affects resistance to bacterial wilt. Plant J.36:353–365.
Gottlieb, L. D., 1984 Genetics and morphological evolution in plants. Am. Nat.123:681–709.
Gottlieb, L. D., 1985 The genetic basis of species differences in plants. Reply. Am. Nat.126:149–150.
Grant, P. R., and B. R. Grant, 2006 Evolution of character displace-ment in Darwin’s finches. Science313:224–226.
Grobet, L., L. J. R. Martin, D. Poncelet, D. Pirottin, B. Brouwers et al., 1997 A deletion in the bovine myostatin gene causes the double-muscled phenotype in cattle. Nat. Genet.17:71–74. Hansen, T. F., and D. Houle, 2008 Measuring and comparing
evolv-ability and constraint in multivariate characters. J. Evol. Biol.21:
1201–1219.
Hansen, T. F., and D. Houle, 2009 Corrigendum. J. Evol. Biol.22: 913–915.
Hereford, J., T. F. Hansen and D. Houle, 2004 Comparing strengths of directional selection: How strong is strong? Evolu-tion58:2133–2143.
Hill, W. G., and A. Caballero, 1992 Artificial selection experi-ments. Annu. Rev. of Ecol. Syst.23:287–310.
Hine, E., and M. W. Blows, 2006 Determining the effective dimen-sionality of the genetic variance-covariance matrix. Genetics173:
1135–1144.
Hoekstra, H. E., J. M. Hoekstra, D. Berrigan, S. N. Vignieri, A. Hoanget al., 2001 Strength and tempo of directional selec-tion in the wild. Proc. Natl. Acad. Sci. USA98:9157–9160. Houle, D., 2007 A dispatch from the multivariate frontier. J. Evol.
Biol.20:22–23.
Hunt, J., M. W. Blows, F. Zajitschek, M. D. Jennions and R. Brooks, 2007 Reconciling strong stabilizing selection with the maintenance of genetic variation in a natural population of black field crickets (Teleogryllus commodus). Genetics177:875–880. Jorgensen, S., and R. Mauricio, 2004 Neutral genetic variation among wild North American populations of the weedy plant Ara-bidopsis thalianais not geographically structured. Mol. Ecol.13:
3403–3413.
Keightley, P. D., 1998 Genetic basis of response to 50 generations of selection on body weight in inbred mice. Genetics148:1931–1939. Keightley, P. D., and O. Ohnishi, 1998 EMS-induced polygenic mutation rates for nine quantitative characters inDrosophila mel-anogaster.Genetics148:753–766.
Kimura, M., 1983 The Neutral Theory of Molecular Evolution.Cambridge University Press, Cambridge, UK.
Kingsolver, J. G., H. E. Hoekstra, J. M. Hoekstra, D. Berrigan, S. N. Vignieriet al., 2001 The strength of phenotypic selection in natural populations. Am. Nat.157:245–261.
Kliebenstein, D., 2007 Metabolomics and plant quantitative trait locus analysis: The optimum genetical genomics platform? pp. 29–44 inConcepts in Plant Metabolomics, edited by B. J. Nikolau´ and E. S. Wurtele. Springer, Dordrecht, The Netherlands. Lande, R., 1979 Quantitative genetic analysis of multivariate
evolu-tion, applied to brain: body size allometry. Evolution33:402–416. Lande, R., and S. J. Arnold, 1983 The measurement of selection on
correlated characters. Evolution37:1210–1226.
Lister, C., and C. Dean, 1993 Recombinant inbred lines for map-ping RFLP and phenotypic markers inArabidopsis thaliana.Plant J.4:745–750.
Long, A. D., S. L. Mullaney, L. A. Reid, J. D. Fry, C. H. Langley et al., 1995 High-resolution mapping of genetic-factors affect-ing abdominal bristle number inDrosophila melanogaster.Genetics
139:1273–1291.
Mackay, T. F. C., 1990 Distribution of effects of new mutations af-fecting quantitative traits, pp. 219–228 inProceedings of the 4th World Congress on Genetics Applied to Livestock Production, edited by W. G. Hill, R. Thompsonand J. A. Wooliams. Organizing Committee, 4th World Congress on Genetics Applied to Live-stock Production, Edinburgh, UK.
Mackay, T. F. C., J. D. Fry, R. F. Lyman and S. V. Nuzhdin, 1994 Polygenic mutation inDrosophila melanogaster: estimates from response to selection of inbred strains. Genetics 136:
937–951.
Masle, J., S. R. Gilmoreand G. D. Farquhar, 2005 TheERECTA gene regulates plant transpiration efficiency in Arabidopsis. Na-ture436:866–870.
Mauricio, R., and M. D. Rausher, 1997 Experimental manipula-tion of putative selective agents provides evidence for the role of natural enemies in the evolution of plant defense. Evolution
51:1435–1444.
McCulloch, C. E., M. D. Boudreauand S. Via, 1996 Confidence regions for evolutionary trajectories. Biometrics52:184–192. Mcguigan, K., and M. W. Blows, 2007 The phenotypic and
ge-netic covariance structure of Drosophilidwings. Evolution61:
902–911.
Mcguigan, K., A. VanHomrighand M. W. Blows, 2008 An evolu-tionary limit to male mating success. Evolution62:1528–1537. Mitchell, R. J., R. G. Shaw and N. M. Waser, 1998 Pollinator
selection, quantitative genetics, and predicted evolutionary re-sponses of floral traits inPenstemon centranthifolius (Scrophularia-ceae). Int. J. Plant Sci.159:331–337.
Mitchell-Olds, T., and R. G. Shaw, 1987 Regression analysis of natural selection: statistical inference and biological interpreta-tion. Evolution41:1149–1161.
Mosher, D. S., P. Quignon, C. D. Bustamante, N. B. Sutter, C. S. Mellershet al., 2007 A mutation in the myostatin gene in-creases muscle mass and enhances racing performance in hetero-zygote dogs. PLoS Genet.3:779–786.
Nuzhdin, S. V., J. D. Fryand T. F. C. Mackay, 1995 Polygenic mu-tation inDrosophila melanogaster: the causal relationship of bristle number to fitness. Genetics139:861–872.
Orr, H. A., 1998 The population genetics of adaptation: the distri-bution of factors fixed during adaptive evolution. Evolution52:
935–949.
Orr, H. A., 2005a Theories of adaptation: what they do and don’t say. Genetica123:3–13.
Orr, H. A., 2005b The genetic theory of adaptation: a brief history. Nat. Rev. Genet.6:119–127.
Orr, H. A., and J. A. Coyne, 1992 The genetics of adaptation: a re-assessment. Am. Nat.140:725–742.
Phillips, P. C., and S. J. Arnold, 1999 Hierarchical comparison of genetic variance-covariance matrices. I. Using the Flury hierar-chy. Evolution53:1506–1515.
Qi, Y. P., Y. Sun, L. Xu, Y. Q. Xuand H. Huang, 2004 ERECTA is required for protection against heat-stress in the AS1/AS2 path-way to regulate adaxial-abaxial leaf polarity in Arabidopsis. Planta
219:270–276.
Rausher, M. D., 1992 The measurement of selection on quantita-tive traits: biases due to environmental covariances between traits and fitness. Evolution46:616–626.
Robertson, A., 1967 The nature of quantitative genetic variation, pp. 265–280 inHeritage From Mendel, edited by A. Brink. Univer-sity of Wisconsin Press, Madison, WI.
Rollmann, S. M., M. M. Magwire, T. J. Morgan, E. D. Ozsoy, A. Yamamoto et al., 2006 Pleiotropic fitness effects of the Tre1-Gr5a region in Drosophila melanogaster. Nat. Genet. 38:
824–829.
Shpak, E. D., M. B. Lakemanand K. U. Torii, 2003 Dominant-neg-ative receptor uncovers redundancy in theArabidopsisERECTA leucine-rich repeat receptor-like kinase signaling pathway that regulates organ shape. Plant Cell15:1095–1110.
Shpak, E. D., C. T. Berthiaume, E. J. Hill and K. U. Torii, 2004 Synergistic interaction of three ERECTA-family recep-tor-like kinases controlsArabidopsis organ growth and flower de-velopment by promoting cell proliferation. Dede-velopment 131:
1491–1501.
Shpak, E. D., J. M. Mcabee, L. J. Pillitteri and K. U. Torii, 2005 Stomatal patterning and differentiation by synergistic in-teractions of receptor kinases. Science309:290–293.
Shrimpton, A. E., and A. Robertson, 1988a The isolation of poly-genic factors controlling bristle score inDrosophila melanogaster.I. Allocation of third chromosome sternopleural bristle effects to chromosome sections. Genetics118:437–443.
Shrimpton, A. E., and A. Robertson, 1988b The isolation of poly-genic factors controlling bristle score inDrosophila melanogaster.II. Distribution of third chromosome bristle effects within chromo-some sections. Genetics118:445–459.
S , J. C., L. F. D and E. D. B , III, 2007 Sexual dimor-phism in the quantitative-genetic architecture of floral, leaf, and allocation traits inSilene latifolia.Evolution61:42–57.
Stinchcombe, J. R., and J. Schmitt, 2006 Ecosystem engineers as selective agents: the effects of leaf litter on emergence time and early growth inImpatiens capensis.Ecol. Lett.9:258–270. Stinchcombe, J. R., M. T. Rutter, D. S. Burdick, P. Tiffin, M. D.
Rausheret al., 2002 Testing for environmentally induced bias in phenotypic estimates of natural selection: theory and practice. Am. Nat.160:511–523.
Torii, K. U., N. Mitsukawa, T. Oosumi, Y. Matsuura, R. Yokoyama et al., 1996 TheArabidopsisERECTA gene encodes a putative re-ceptor protein kinase with extracellular leucine-rich repeats. Plant Cell8:735–746.
Turelli, M., and N. H. Barton, 1990 Dynamics of polygenic char-acters under selection. Theor. Popul. Biol.38:1–57.
Turelli, M., and N. H. Barton, 1994 Genetic and statistical analy-ses of strong selection on polygenic traits: What, me normal? Genetics138:913–941.
Visscher, A. H., M. Dijkstra, E. A. Lord, R. Suss, H. J. Rosleret al., 2000 Maternal and lamb carrier effects of the Booroola gene on food intake, growth and carcass quality of male lambs. Anim. Sci.
71:209–217.
Weinig, C., M. C. Ungerer, L. A. Dorn, N. C. Kane, Y. Toyonagaet al., 2002 Novel loci control variation in reproductive timing in A ra-bidopsis thalianain natural environments. Genetics162:1875–1884. Weinig, C., J. R. Stinchcombeand J. Schmitt, 2003a Evolutionary genetics of resistance and tolerance to natural herbivory in Ara-bidopsis thaliana.Evolution57:1270–1280.
W , C., J. R. S and J. S , 2003b QTL archi-tecture of resistance and tolerance traits in Arabidopsis thaliana in natural environments. Mol. Ecol.12:1153–1163.
Westerman, J. M., and M. J. Lawrence, 1970 Genotype-environ-ment interaction and developGenotype-environ-mental regulation in Arabidopsis thaliana.I. Inbred lines; description. Heredity25:609–627. Xu, L., Y. Xu, A. W. Dong, Y. Sun, L. M. Piet al., 2003 Novel as1 and
as2 defects in leaf adaxial-abaxial polarity reveal the require-ment for ASYMMETRIC LEAVES1 and 2 and ERECTA func-tions in specifying leaf adaxial identity. Development 130:
4097–4107.
Yoo, B. H., 1980a Long-term selection for a quantitative character in large replicate populations ofDrosophila melanogaster.1. Response to selection. Genet. Res.35:1–17.
Yoo, B. H., 1980b Long-term selection for a quantitative character in large replicate populations of Drosophila melanogaster. 2. Lethals and visible mutants with large effects. Genet. Res.35:
19–31.
Zeyl, C., 2005 The number of mutations selected during adaptation in a laboratory population ofSaccharomyces cerevisiae. Genetics
169:1825–1831.
Zurlage, P., A. D. Shrimpton, A. J. Flavell, T. F. C. Mackayand A. J. L. Brown, 1997 Genetic and molecular analysts of smooth, a quantitative trait locus affecting bristle number in Drosophila melanogaster.Genetics146:607–618.