Earthquake Analysis of High Rise Building
Using Combination of Chevron and Inverted
V Bracings
Kummari Pedda Ramesh 1, B.Naga Niranjan Kumar 2
P.G. Student, Department of Civil Engineering, Dr.K.V.Subba Reddy Institute of Technology, Duapdu, Andhra Pradesh, India1
Assistant Professor, Department of Civil Engineering, Dr.K.V.Subba Reddy Institute of Technology, Duapdu, Andhra Pradesh, India2
ABSTRACT: In structural engineering, bracings is a structural system composed to counter the effects of lateral load acting on a structure. Bracings are structural members used to augment the strength of RCC structures. These bracings will be built in each level of the structure, to form an effective box structure. The present work is an attempt to analyse and design a commercial building using ETABS.AG+17 storey building is considered for this study. Analysis is carried out by static method and design is done as per IS 456:2000 guidelines. For the analysis of the building for seismic loading with two different Zones (Zone-IV & Zone-V) is considered with all there soil types. Results of Displacement are compared in tabular forms and a remarkable conclusion is made.
KEYWORDS: Commercial Building, ETABS, Lateral load Resisting systems I. INTRODUCTION
A new bracing system shaped like a diamond is incorporated in the main building frame and its applicability is evaluated by detailed calculations. It is also compared with the other known bracing system known as the cross bracing system. Both the bracing system has been shown below.
Bracing is a very effective global upgrading strategy to enhance the global stiffness and strength of steel and composite frames. It can increase the energy absorption of structures and/or decrease the demand imposed by earthquake loads. Structures with augmented energy dissipation may safely resist forces and deformations caused by strong ground motions. Generally, global modifications to the structural system are conceived such that the design demands, often denoted by target displacement, on the existing structural and non-structural components, are less than their capacities (Figure 1). Lower demands may reduce the risk of brittle failures in the structure and/or avoid the interruption of its functionality. The attainment of global structural ductility is achieved within the design capacity by forcing inelasticity to occur within dissipative zones and ensuring that all other members and connections behave linearly
II. NUMERICAL MODELLING
Geometry Details
Length of building : 72m Width of building : 72m Height of building : 54m
Height of floor : 3m
Column sizes
Column size Base to Storey 9 = 600 mm x 450mm Column size Storey 9 to Storey 18 = 450mm x 300mm
Clear Cover = 40mm
Beam sizes
Beam Size Storey first storey to eighteenth storey = 300 mm *450 mm
Cover = 25mm
Slab thickness 110 mm
Materials
Concrete grade : M30
Longitudinal bars : 20mm Confinement bars : 8mm
Chevron & Inverted V Bracings on each elevation
Grade of Concrete and Steel : M30; Fe500
Plan considered
III. EXPERIMENTAL RESULTS
CASE: 1 Comparison Of Displacement In Static Analysis For Zone-4 & Zone-5 In Soil-1, Soil-2 & Soil-3 Table 5.1 Displacement Comparison values along Z-4, S-1 in Static Analysis
Graph 5.1
Variation of Displacement along Z-4,S-1 in Static Analysis0 5 10 15 20 25 30 35 40
D
ISP
LAC
E
M
E
N
T
(m
m
)
1.2(DL+LL+EQX) X-Direction DISPLACEMENT (mm)
Z-4, S-1 Without Bracings
With Chevron Bracings
WITH Inverted V Bracings
No. of Storey's
1.2(DL+LL+EQX) X-Direction Displacement (mm) Z-4, S-1
Storey’s Without Bracings
With Chevron Bracings
With Inverted V Bracings
Storey 18 34.625 23.393 20.713
Storey 17 33.988 22.635 19.851
Storey 16 33.019 21.730 18.847
Storey 15 31.681 20.680 17.747
Storey 14 30.007 19.505 16.554
Storey 13 28.041 18.203 15.285
Storey 12 25.824 16.797 13.961
Storey 11 23.393 15.314 12.606
Storey 10 20.790 13.773 11.243
Storey 9 18.056 12.188 9.876
Storey 8 15.991 10.734 8.600
Storey 7 13.883 9.279 7.338
Storey 6 11.729 7.818 6.098
Storey 5 9.541 6.367 4.894
Storey 4 7.333 4.941 3.739
Storey 3 5.127 3.551 2.648
Storey 2 2.978 2.245 1.636
Storey 1 1.075 1.037 0.712
Table 5.2 Displacement Comparison values along Z-4, S-2 in Static Analysis 1.2(DL+LL+EQX) X-Direction Displacement (mm)
Z-4, S-2 Storey’s Without
Bracings
With Chevron Bracings
With Inverted V Bracings
Storey 18 47.042 31.755 28.111
Storey 17 46.225 30.773 26.984
Storey 16 44.911 29.553 25.629
Storey 15 43.091 28.123 24.133
Storey 14 40.814 26.526 22.509
Storey 13 38.14 24.755 20.783
Storey 12 35.123 22.844 18.982
Storey 11 31.818 20.826 17.134
Storey 10 28.274 18.73 15.272
Storey 9 24.552 16.575 13.415
Storey 8 21.748 14.597 11.68
Storey 7 18.882 12.619 9.963
Storey 6 15.952 10.633 8.276
Storey 5 12.976 8.659 6.638
Storey 4 9.973 6.719 5.067
Storey 3 6.973 4.826 3.58
Storey 2 4.049 3.017 2.203
Storey 1 1.453 1.368 0.968
Base 0 0 `0
Graph 5.2
Variation of Displacement along Z-4,S-2 in Static Analysis
0 5 10 15 20 25 30 35 40 45 50
D
ISP
LAC
E
M
E
N
T
(m
m
) 1.2(DL+LL+EQX) X-Direction DISPLACEMENT(mm) Z-4,S-2
Without Bracings
With Chevron Bracings
WITH Inverted V Bracings
Table 5.3
Displacement Comparison values along Z-4, S-3 in Static Analysis
1.2(DL+LL+EQX) X-Direction Displacement (mm) Z-4, S-3
Storey’s Without
Bracings
With Chevron Bracings
With Inverted V Bracings
Storey 18 57.734 38.957 34.482
Storey 17 56.763 37.781 33.127
Storey 16 55.152 36.289 31.47
Storey 15 52.916 34.533 29.632
Storey 14 50.12 32.572 27.637
Storey 13 46.835 30.398 25.518
Storey 12 43.131 28.052 23.306
Storey 11 39.072 25.572 21.036
Storey 10 34.719 22.999 18.744
Storey 9 30.146 20.353 16.463
Storey 8 26.705 17.924 14.332
Storey 7 23.187 15.494 12.223
Storey 6 19.589 13.056 10.151
Storey 5 15.934 10.633 8.139
Storey 4 12.246 8.25 6.21
Storey 3 8.562 5.925 4.385
Storey 2 4.971 3.695 2.698
Storey 1 1.78 1.652 1.189
Base 0 0 0
Graph 5.3
Variation of Displacement along Z-4,S-3 in Static Analysis
0 10 20 30 40 50 60 70
D
IS
P
LAC
EM
EN
T
(m
m
)
1.2(DL+LL6EQX) X-Direction DISPLACEMENT (mm) Z-4, S-3
Without Bracings
With Chevron Bracings
WITH Inverted V Bracings
Table 5.4
Displacement Comparison values along Z-5, S-1 in Static Analysis
1.2(DL+LL+EQX) X-Direction Displacement (mm) Z-5, S-1
Storey’s Without
Bracings
With Chevron Bracings
With Inverted V Bracings
Storey 18 51.870 35.008 30.988
Storey 17 50.984 33.938 29.759
Storey 16 49.536 32.595 28.267
Storey 15 47.528 31.018 26.616
Storey 14 45.017 29.256 24.825
Storey 13 42.067 27.304 22.921
Storey 12 38.740 25.196 20.935
Storey 11 35.094 22.969 18.896
Storey 10 31.185 20.658 16.839
Storey 9 27.078 18.282 14.791
Storey 8 23.987 16.100 12.877
Storey 7 20.826 13.917 10.983
Storey 6 17.595 11.727 9.123
Storey 5 14.312 9.550 7.316
Storey 4 10.999 7.410 5.583
Storey 3 7.691 5.322 3.943
Storey 2 4.465 3.320 2.424
Storey 1 1.600 1.496 1.068
Base 0 0 0
Graph 5.4
Variation of Displacement along Z-5,S-1 in Static Analysis
010 20 30 40 50 60 70
D
IS
P
LAC
EM
EN
T
(m
m
)
1.2(DL+LL+EQX) X-Direction DISPLACEMENT (mm) Z-5, S-1
Without Bracings
With Chevron Bracings
WITH Inverted V Bracings
Table 5.5
Displacement Comparison values along Z-5, S-2 in Static Analysis
1.2(DL+LL+EQX) X-Direction Displacement (mm) Z-5, S-2
Storey’s Without
Bracings
With Chevron Bracings
With Inverted V Bracings
Storey 18 70.501 47.552 42.085
Storey 17 69.34 46.145 40.458
Storey 16 67.374 44.329 38.441
Storey 15 64.643 42.184 36.195
Storey 14 61.226 39.788 33.758
Storey 13 57.214 37.133 31.169
Storey 12 52.689 34.267 28.466
Storey 11 47.73 31.238 25.694
Storey 10 42.411 28.093 22.891
Storey 9 36.822 24.863 20.105
Storey 8 32.622 21.895 17.497
Storey 7 28.325 18.926 14.921
Storey 6 23.929 15.948 12.391
Storey 5 19.464 12.988 9.936
Storey 4 14.959 10.077 7.582
Storey 3 10.459 7.236 5.356
Storey 2 6.072 4.51 3.296
Storey 1 2.17 1.993 1.452
Base 0 0 0
Graph 5.5
Variation of Displacement along Z-5, S-2 in Static Analysis
0 10 20 30 40 50 60 70 80 St o re y 1 8 St o re y 1 7 St o re y 1 6 St o re y 1 5 St o re y 1 4 St o re y 1 3 St o re y 1 2 St o re y 1 1 St o re y 1 0 St o re y 9 St o re y 8 St o re y 7 St o re y 6 St o re y 5 St o re y 4 St o re y 3 St o re y 2 St o re y 1 B as e D IS P LA C EM EN T( m m )1.2(DL+LL+EQX) X-Direction DISPLACEMENT (mm)
Z-5, S-2
WithoutTable 5.6
Displacement Comparison values along Z-5, S-3 in Static Analysis
1.2(DL+LL+EQX) X-Direction Displacement (mm)Z-5, S-3 Storey’s Without
Bracings
With Chevron Bracings
With Inverted V Bracings Storey 18 86.563 58.354 51.641 Storey 17 85.146 56.657 49.672 Storey 16 82.735 54.433 47.202 Storey 15 79.381 51.798 44.444 Storey 14 75.185 48.857 41.451 Storey 13 70.258 45.597 38.271 Storey 12 64.701 42.077 34.952 Storey 11 58.611 38.358 31.547 Storey 10 52.079 34.496 28.102
Storey 9 45.213 30.53 24.688
Storey 8 40.057 26.885 21.484
Storey 7 34.782 23.24 18.32
Storey 6 29.384 19.583 15.215
Storey 5 23.901 15.949 12.201
Storey 4 18.369 12.372 9.31
Storey 3 12.843 8.883 6.577
Storey 2 7.456 5.535 4.048
Storey 1 2.66 2.433 1.783
Base 0 0 0
Graph 5.6
Variation of Displacement along Z-5, S-3 in Static Analysis0 20 40 60 80 100 St o re y 18 St o re y 17 St o re y 16 St o re y 15 St o re y 14 St o re y 13 St o re y 12 St o re y 11 St o re y 10 St o re y 9 St o re y 8 St o re y 7 St o re y 6 St o re y 5 St o re y 4 St o re y 3 St o re y 2 St o re y 1 B as e D IS P LA C EM EN T (m m )
1.2(DL+LL+EQX) X-Direction DISPLACEMENT(mm)
Z-5, S-3
Without BracingsWith Chevron Bracings
WITH Inverted V Bracings
CASE: 2 Zone Wise Comparison Of Displacement In Static Analysis For Soil-1, Soil-2 & Soil-3
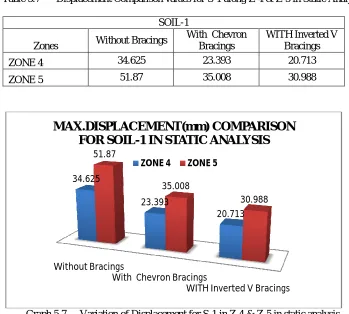
Table 5.7 Displacement Comparison values for S-1 along Z-4 & Z-5 in Static Analysis SOIL-1
Zones Without Bracings
With Chevron Bracings
WITH Inverted V Bracings
ZONE 4 34.625 23.393 20.713
ZONE 5 51.87 35.008 30.988
Graph 5.7 Variation of Displacement for S-1 in Z-4 & Z-5 in static analysis
Table 5.8 Displacement Comparison values for S-2 along Z-4 & Z-5 in Static Analysis
SOIL-2
Zones
Without
Bracings
With Chevron
Bracings
WITH Inverted
V Bracings
ZONE 4
47.042 31.755 28.111ZONE 5
70.501 47.552 42.085Without Bracings
With Chevron Bracings
WITH Inverted V Bracings 34.625
23.393
20.713 51.87
35.008
30.988
MAX.DISPLACEMENT(mm) COMPARISON
FOR SOIL-1 IN STATIC ANALYSIS
Graph 5.8 Variation of Displacement for S-2 in Z-4 & Z-5 in static analysis IV. CONCLUSION
1. The structural performance is analyzed. Without bracings, With X Bracing with chevron bracings, the displacement of 45% is reduced when lateral systems are provided.
2. By providing lateral systems in the framed structures the reduction in the displacement, shear, moment thereby increasing the stiffness of the structure for resisting lateral loads due to earth quakes.
REFERENCES
1 S.M.Wilkinson, R.A.Hiley "A Non-Linear Response History Model For The Seismic Analysis Of High-Rise Framed Buildings" september 2005,Computers and Structures.
2 KAPUR AND ASHOK K.JAIN (1983)“SEISMIC RESPONSE OF SHEAR WALL FRAME VERSUS BRACED CONCRETE FRAMES” UNIVERSITY OF ROORKEE,
ROORKEE 247 672.APRIL 1983 IS: 1893(PART I): 2002 INDIAN STANDARD CRITERIA FOR EARTHQUAKE RESISTANT DESIGN OF STRUCTURES
PART I GENERAL PROVISIONS AND BUILDINGS (FIFTH REVISION).
3 J.R. Wu and QStructural..LIperformance(2003)”ofmulti-outrigger-braced Tall Buildings”. Thetructural designof tall and special
buildings, Vol.12, October2003, pp 155-176.
4 KAPUR AND ASHOK K.JAIN (1983)“SEISMIC RESPONSE OF SHEAR WALL FRAME VERSUS BRACED CONCRETE FRAMES”UNIVERSITY OF ROORKEE, ROORKEE 247 672.APRIL 1983
5 IS: 1893(Part I): 2002 Indian Standard Criteria for Earthquake Resistant Design of Structures Part I General provisions and
buildings (Fifth Revision).
6 Pankaj Agarwal and Manish Shrikhande.(2010), Earthquake“ Resistant Design of Structures” PHI Learning Private Limited. 7 Taranath B.S. (1988), “Structural Analysis and Design of Tall Buildings”McGraw-Hill Book Company.
Without Bracings
With Chevron
Bracings WITH Inverted V
Bracings 47.042
31.755
28.111 70.501
47.552
42.085