ABSTRACT
SUN, JING. Optimization of the Neutron Absorption Steady Source Measurement
Method --by using an 124Sb-Be Source. (Under the direction of Robin P. Gardner.)
In the mineral exploration and oil well logging industries where logging tools are
used based on neutron moderation and absorption principles, one needs to have an
accurate knowledge of the neutron absorption cross-sections of the sample of interest for
calibration purposes. This is difficult to ascertain by ordinary chemical analysis since
some elements that are present in trace amounts (like boron, samarium, and gadolinium)
have very large neutron absorption cross-sections. In oil well logging applications,
chlorine appears in larger than trace amounts and often dominates the absorption
cross-sections. For this reason a sensitive measurement is obtained by using the response to a
source of thermal neutrons when a small sample is placed within a good moderating
medium. Tittle and Crawford (1983) described and demonstrated such an approach. This
method has evolved into one that uses a 252Cf source of neutrons with a 3He proportional counter. Attempts to optimize the sensitivity of this technique by Monte Carlo simulation
with both MCNP and a specific purpose Monte Carlo code (Mickael, 1988) involving
different detector positions relative to the sample, variable source-to-sample distances,
and different moderators (Bussian, Jetter, and Supernaw, 1991, Talavarjula, 1995, and
Sood, Gardner, and Gray, 2000) have had only limited success. The present approach
involves the use of a 124Sb-Be neutron source with an average neutron energy of about 12 Kev compared to the 3 to 4 MeV average of the 252Cf source. Monte Carlo calculations
Optimization of the Neutron Absorption Steady
Source Measurement Method
--by using an
124Sb-Be Source
by
JING SUN
Master's Thesis submitted to the Faculty of
North Carolina State University
in partial fulfillment of
the requirements for the degree of
Master of Science
NUCLEAR ENGINEERING
Raleigh, North Carolina
2002
APPROVED BY:
______________________ ________________________
Minor representative Co-Chair of Advisory Committee
BIOGRAPHY
Jing Sun was born in Jilin, China on February 28th, 1976 and moved to Beijing when she was one and a half years old. In the fall of 1994, she began her college education in
Tsinghua University and obtaining her Bachelor of Science degree in Engineering Physics
in the summer of 1999.
In August 2000, the author was admitted to North Carolina State University as a
doctoral student in the Department of Nuclear Engineering. During the first two semesters,
she was supported by the Department. For the remainder of her work, she was supported by
the Center for Engineering Applications of Radioisotopes as a research assistant.
Jing Sun is the daughter of Zhongzhi Sun and Guirong Liu. She is the only child in
the family.
ACKNOWLEDGEMENTS
First of all, I would like to record my deep indebtedness and my sincere gratitude to
the chairman of my advisory committee, Professor Robin P. Gardner for the valuable
guidance, support and continuous encouragement he gave me during the research. I am also
equally indebted to the co-chairman of the committee, Professor Charles W. Mayo, for his
helpful advice and suggestions. Special thanks are also extended to Dr. Wushow Chou, the
minor representative, for his suggestions and attendance.
I would gratefully acknowledge the contribution of Lecturer and Reactor Health
Physicist, Dr. Gerald D. Wicks, for the computational procedure and benchmark of the
source activation safety also the design of capsulation of Antimony pellet. I am grateful to
Larry Dufour and other technicians in Workshop for their carefully design and efforts for
the experimental device and the source capsulation. I am also grateful to all group members
of CEAR, SangHoon Lee, Walid Metwally, Weijun Guo, Xiaogang Han and Ashraf
Shehata, who have inspired and assisted in my research study. I would also gratefully
acknowledge the financial support of the Associates Program for Nuclear Techniques in Oil
Well Logging with present members Baker Atlas and Advantage Engineering.
Finally I would like to extend my sincere gratitude to my parents for their always
moral support from far away in my home country China. For my boyfriend, Dapeng, I
Contents
List of Tables
vii
List
of
Figures
viii
1 Introduction
1
1.1 An Overview 1
1.2 Cross Section Experiment 1
1.3 Literature Review 2
1.3.1 Tittle and Crawford’s work 2
1.3.2 Salaita’s work 2
1.3.3 Bussian, Jetter and Supernaw’s work 3
2
Experimental
Technique
4
2.1 Experimental principle and method 4
2.2 Previous Work at NCSU 6
2.2.1 Tallavarjula’s work 6
2.2.2 Sood’s work 6
2.3 The Improved Design 7
3 MCNP Simulation
9
3.1 A brief description of the input file 10
3.1.2 Surface Cards 11
3.1.3 Material Cards and Perturbation Effect 12
3.1.4 Importance Cards 13
3.1.5 Source Specification Cards 13
3.1.6 Tally Specification Cards 13
3.1.7 Weight Windows 14
3.1.8 Peripheral Cards 15
3.2 Simulations with MCNP 15
3.2.1 Calculation with Aqueous Samples 16
3.2.2 Calculation with Powder Samples 17
3.3 Discussions of Simulation 22
4 Experiments with
124Sb-Be
Source
24
4.1 Experiment System 24
4.2 Counting Rate Electronics 25
4.3 Preparation for Samples 30
4.3.1 Aqueous Samples 30
4.3.2 Powder Samples 31
4.4 Preparation for Source 32
4.5 Calibrations with Standard Samples 37
4.5.1 Experiments with 252Cf and 124Sb-Be Source in new apparatus 37
4.5.2 Semi-empirical model 40
4.6 Discussions for Experiment Measurements 49
5
Conclusions
and
Future
work
51
5.1 Summary and Conclusions 51
5.2 Future Work 52
Reference
54
Appendix
56
A MCNP INP file
56
B Style and model of electronic apparatus
60
C Pictures For Sb(Be) Source
Experiment
61
D Procedure for test of a Sb(Be) source
62
E Procedure for use a Sb(Be) source
66
F Calculation for Source Mass
67
List of Tables
Table 3-1 Data from simulations of Both Antimony-Beryllium and Californium steady
source with sodium chloride solution samples 19
Table 3-2 Data from simulations of Both Antimony-Beryllium and Californium steady
source with silicon oxide and boric acid powder samples 19
Table 3-3 Sensitivity improvement--The comparison for slopes and intercepts of the
calibration curves between two sources 23
Table 4-1. The thermal neutron microscopic cross sections (2200 m/s) for pure element as
standard aqueous and powder samples 34
Table 4-2. The pre-calculated macroscopic cross sections of standard aqueous samples 35
Table 4-3. The pre-calculated macroscopic cross sections of standard powder samples 36
Table 4-4. Repeated experiments data versus Sood’s results 41
List of Figures
Figure 2-1. Expected result of sensitivity improvement with 124Sb-Be source 5 Figure 2-2. Design of the steady source technique of cross section measurement 8
Figure 3-1. Sensitivity comparison from simulations of Both Antimony-Beryllium
and Californium steady source with sodium chloride solution samples 20
Figure 3-2. Sensitivity comparison from simulations of Both Antimony-Beryllium
and Californium steady source with silicon oxide and boric acid
powder samples 21
Figure 4-1. Side view of the experiment device 27
Figure 4-2. The electronic circuit system for cross section measurement 28
Figure 4-3. The operating high voltage plateau determination 29
Figure 4-4.The structure of the source encapsulation 33
Figure 4-5. Sensitivity improvement comparison from experiment measurements
for absorption cross section between two sources with aqueous
samples (90°) 38
Figure 4-6. Sensitivity improvement comparison from experiment measurements
for absorption cross section between two sources with aqueous
samples (180°) 39
Figure 4-7. Semi-empirical Model of Absorption cross section measurement for
both 90° and 180° detector locations by MCNP simulations 43 Figure 4-8. Comparison between MCNP simulation and experimental
measurements with 124Sb-Be source 44
Figure 4-10. Detector response with Semi empirical Model (180o) 46 Figure 4-11. Calibration Curve of Repeat Experiments with 252Cf Source and
paraffin box device 47
Figure 4-12. Comparison between results of Antimony source in water tank
and Californium source in paraffin box 48
Figure B-1. Electronic apparatuses for experiment 60
Figure C-1. Experimental device 61
Figure C-2. Aqueous Samples for experiment 61
Figure E-1. Outer Aluminum Capsule and End Caps (left) & Inner Stainless Steel (right)
Capsule 66
Figure E-2. Outer Aluminum Capsule and End Caps (top) & Inner Stainless Steel (bottom)
Capsule 66
Figure E-3. Figure E-3. End View of Inner Stainless Steel Capsule 66
Chapter 1
Introduction
1.1 An Overview
In geological industry, like mineral exploration and oil well logging, knowledge of the
elements in the formation is very important. Thermal neutron absorption cross sections of
the geological materials are vital parameters that are required for modeling neutron
porosity logging tool responses. Thus accurate thermal neutron absorption cross sections
are significant for proper quantitative interpretation. Generally, rocks in the field would
contain trace amounts of some elements like boron, lithium or gadolinium, which have
high absorption cross sections. This small variation can bring huge uncertainty. Chemical
analysis can often have difficulties and is always expensive. Therefore nuclear cross
section evaluation is important in this field. An alternative method for calculating the
absorption cross section for using elemental analysis is to measure the thermal neutron
cross section directly from the sample.
1.2 Cross Section Experiment
A steady source in a moderating medium has been used to determine thermal neutron
cross sections by some previous researchers. The present research is based on those
previous works but gains a new optimized design. In this optimized design, a 124Sb-Be source is introduced. Together with a 3He detector and a sample, they are immersed in a
samples is calibrated to estimate the absorption cross sections of the sample as measured
by the detector. Change in the detector response this is an indirect method. The
experiment can be optimized using calculated results from MCNP. In this work Monte
Carlo simulation using MCNP is used to study possible improvement of sensitivity of
these measurements. In this work the experiment is modified using the information
gained by Monte Carlo analyses and benchmarked against the result of the MCNP code.
The goal of the thesis is to improve the sensitivity of the experimental measurement of
thermal neutron cross section we in the interpretation of oil well logging.
1.3 Literature Review
For the cross section measurement of bulk samples, several experimental techniques have
been developed by using steady neutron source methods, there include pulsed neutron
source methods and reactivity balance methods. The present work chooses to use a steady
neutron source, a sample and a neutron detector immersed in water moderator.
1.3.1 Tittle and Crawford’s work
Tittle and Crawford[1] (1983,1984) introduced the steady neutron source by using a water drum together with a one curie 239Pu-Be neutron source. The rock powders were saturated with water as the samples. The neutron detector was a small 3He proportional counter. The conclusion was that the effect of scattering by the sample was minimized by using an
angle of detector orientation of 90o.
Salaita[2]’s (1985) device consisted of a water tank, a 252Cf source and a 3He detector (1/4" × 2" in size). The sample material was in a cylindrical plexiglass container. The detector was located very close to the sample and the source was placed at the center of
the sample. They tried both the aqueous and the powder samples. Counting times are 200
seconds for each.
1.3.3 Bussian, Jetter and Supernaw’s work
Bussian, Jetter and Supernaw[4]’s (1991) experimental equipment also used a 252Cf source but with two 3He detectors (0.64 cm in diameter and 7.62 cm in length). The detectors made 180o and 90o angular orientations respectively. The source-sample distance was 17 cm. They obtained both transport and absorption cross sections. Counting rates at 180o and 90o were expressed as linear functions of Σ
Chapter 2
Experimental Technique
2.1 Experimental principle and method
This work is using steady neutron source technique with a 124Sb-Be source, a 3He detector and a sample immersed in a big moderating (water) tank. The principle for this
method is simple and easy to be understood. When a steady neutron source is presented
in a large moderating medium, there is an equilibrium established between the neutrons
being born and those lost by absorption and leakage. If a sample with a neutron
absorption cross section that is different from that of moderating media, is introduced into
this system, the neutron flux in the vicinity of the sample will be perturbed. By measuring
this change in flux (the change in counts from the detector) due to the presence of a
particular sample, it is possible to obtain a calibration for sample cross sections.
Using small sample volume is feasible for geologic rock samples. However, the
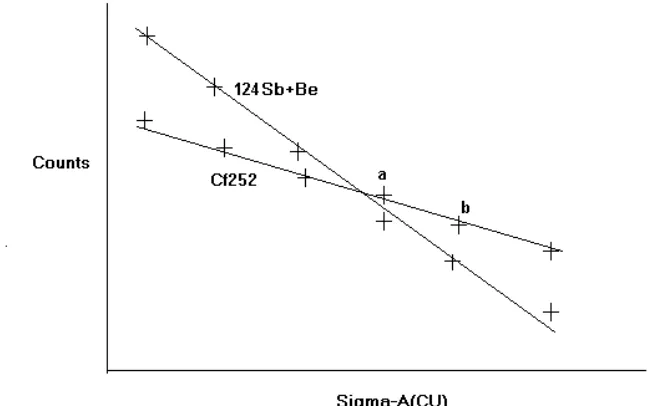
measurement sensitivity drops with reducing volumes. From Tallavarjula[5]’s sensitivity studies for different sample volumes by using McDNL code, the sensitivity of the
measurement can be expressed as the slope of the linear function of counting rates versus
absorption cross sections. If there are two points, a and b, on the calibration result chart
(Figure 2-1), r and Σa stands for the normalized counting rates and the absorption cross
sections, the sensitivity is given by,
b a
Rb Ra S
Σ − Σ
The sensitivity improvement would be gained by sharper slope of the calibration linear
function. From Tallavarjula[5]’s conclusion, a sample volume in the range (250 cm3 to 300 cm3) should give reasonable sensitivity.
2.2 Previous work at NCSU
Several experiments using steady source technology have been developed and evaluated
at NCSU. These experiments were benchmarked, investigated and developed using
Monte Carlo simulation codes, MCNP or McDNL.
2.2.1 Tallavarjula’s work
Tallavarjula[5]’s (1995) work optimized the previous investigations. A water tank, a 252Cf source and a polyethylene sample holder being held immersed in the water moderator.
After some Monte Carlo simulations, one of primary design parameters, the source to
sample distance, was determined for 15.24 cm. And the sample volume was 275 cm3 according to the sensitivity. His work counted for both scattering and absorption cross
sections by the samples. The effect of scattering on the detector located at 180o was found to be substantial compared to the one located at 90o. Advantage was taken of this fact and a semi-empirical model incorporating both absorption and scattering was developed.
Sensitivity was expressed as a function of fractional powder volumes, so that the
technique can be used for rock samples available in small amounts.
2.2.2 Sood’s work
Sood[6] (2000) made the experiment device much smaller, the moderator was changed to solid paraffin to reduce the size of the device without large changes in the moderating
properties. This can also provide a relatively stable and permanent device and can
as the 275 ml one. The 3He detector was placed at two different angular locations, 180o and 90o. His work improved in the calibration of the device and increased the absorption and scattering cross sections range. Accurate results were obtained relating Σa to the
detector yield for reference samples of dry powders and aqueous solutions. A
semi-empirical model was developed and successfully tested that describes both absorption
and scattering cross sections of the sample.
2.3 The improved design
Monte Carlo sensitivity studies demonstrated that neutrons reaching the sample interface
should consist of a large fraction of thermal neutrons. To improve the sensitivity of the
previous work, a new source (124Sb-Be) has been introduced and a prototype apparatus has been constructed. A 124Sb-Be source with low energy of 23 KeV was used to improve the sensitivity. A water tank was adopted as moderated medium to provide experimental
flexibility. The 3He detectors were placed at 90o and 180o orientation for neutron
absorption measurements. The design of the new experimental system is shown below in
Chapter 3
MCNP Simulation
To optimize the determination of the experiment parameters and the design of the device,
the steady source experiment measurement was simulated using Monte Carlo code:
MCNP. MCNP is a general purpose Monte Carlo Neutral Particle transport code,
developed at Los Alamos National Laboratory (LANL). One of the many strong points of
MCNP is its ability to model the geometries and particle transport in difficult problems
nearly exactly. The experiment was benchmarked against the Monte Carlo calculations
and then studies. The completed experimental device is depicted in MCNP input file. The
system is divided into small cells in order to increase the importance of different
positions. The sample was located in the high flux region, as close as possible to the low
energy Antimony-Beryllium source. Because of the large gradient in the thermal flux in
the region near the source, the detected counting rates are highly sensitive to the detector
position. Any small disturbance in the detector location will bring poor reproducibility.
Therefore the weight window method and the perturbation effect are also introduced into
present research. The MCNP simulated calculations were run on the workstations with
UNIX operation system: ULTRA 10. The running time is about one hour. The total
history is 10 million for each calculation. MCNP used in present work is available from
Los Alamos. The main reference is MCNP – a general purpose Monte Carlo n-particle
experiment and some details of present Monte Carlo work can be discussed in this
chapter. A sample input file is included in Appendix-A.
3.1 A brief description of the input file
MCNP stands for Monte Carlo Neutral Particle transport code. It can be used in several
transport modes: neutron only, photon only, electron only, combined neutron/photon
transport where the photons are produced by neutron interactions,
neutron/photon/electron, photon/electron, or electron/photon. The neutron energy regime
is from 10 -11 MeV to 20 MeV. MCNP uses continuous-energy nuclear and atomic data libraries. The primary sources of nuclear data are evaluations from the Evaluated Nuclear
Data File (ENDF) system, the Evaluated Nuclear Data Library (ENDL) and the
Activation Library (ACTL) compilations from Livermore, and evaluations from the
Applied Nuclear Science (T– 2) Group at Los Alamos. The data for cross section
calculation in present experiment simulation are selected from library ENDF. According
to some preliminary calculations, the source does not work well if the source-sample
distance larger than 1 cm. To gain good results, the sample was placed as close as
possible to the source. From Tallavarjula[5]’s work, the volume of the sample was
selected as 275 cm3. The calculation time for each sample is about one hour, which means there are 10 million histories in each calculation. Perturbation effect is treated to
reduce thermal effect. Thermal S(α,β) tables are appropriate if the neutrons are
transported at sufficiently low energies where molecular binding effects are important.
Thermal S(α,β) tables are not required, but they are absolutely essential to get correct
encompass those required for a complete representation of thermal neutron scattering by
molecules and crystalline solids. Weight window method is also used as variance
reduction technique to control particle weight. More details about weight windows are
given in 3.1.7. The cards of MCNP input file relevant to the present experiment are
discussed. A complete description of the code can be found in the MCNP manual.
3.1.1 Cell Cards
The entire experiment device is depicted completely. The whole system is divided into
small cells in order to get better importance distribution for different positions. For each
cell the cell material number, mass density (with a negative sign), Boolean geometry
specifications are given. The Boolean specification describes how a certain cell is
formed, whether it is inside a surface (prescribed by a preceding “-“ sign) or outside, if it
is union of different cells (prescribed by a “:”) or an intersection (a blank). The last line
represents void around the system, with a 0 for material number and no density
specification. In present experiment, this region stands for the whole space outside the
big plexiglass water tank.
3.1.2 Surface Cards
Several surfaces that are used to construct the cells are specified each by a surface
number, Mnemonic, and geometry parameters. The surfaces used are planes normal to
the principal axes (PX, PY, PZ); spheres with center at origin or any of the axes (SO, SX,
SY, SZ); cylinders parallel to the principal axes (C/X, C/Y, C/Z). The planes used in
water tank. The cylinders used in present experiment define the sides of the sample, the
detector and the water tank. The geometry parameters include intercepts of the planes,
and radii for spheres and cylinders.
3.1.3 Material Cards and Perturbation Effect
There are specified by a material number (Mm-card) followed by the cross section file
ZAID for each element and its weight fraction. The cross section data is specified by the
file rmccs and file tmccs1, which contain the required paths to access the cross section
data files. Each material number corresponds to the relative cell number. Material one
stands for cell one, moderator medium. Material two stands for powder and aqueous
samples. Material three stands for 3He detector. Mode N stands for thermal neutrons in present experiment.
For thermal neutron scattering from water, the perturbation effect is introduced. S (α, β)
is specified in the present experiment. The large gradient in the thermal flux is significant
in the region near the source, thus the detected count rates are highly sensitive to the
detector. Any small disturbance in the detector location will bring poor reproducibility. In
general, S (α, β) effects are most significant below 2 eV so that their applications are
important for thermal neutrons. The S (α, β) treatment is invoked by identifiers on MTn
cards by the card – mtn lwtr. The n refers to the material n defined on a regular Mm card.
In the present experiment S (α, β) is set for moderation medium water. The appearance of
an MTn card will cause the loading of the corresponding S (α, β) data from the thermal
material at a given energy, if perturbation effect is introduced, the S (α, β) treatment will
automatically override the default or old treatments. The currently S (α, β) contributions
to detectors are approximate.
3.1.4 Importance Cards
The importance of a cell is used to terminate the particle’s history, for geometry splitting
and Russian roulette to help particles move to more important regions of the geometry.
Importance for each cell is specified using the card – imp:n. In present experiment
simulation, assume no neutron particles escape from the water tank by set the zero
importance for the cell outside the water tank.
3.1.5 Source Specification cards
The sdef card specifies the source coordinates and the cell in which it is located. The
energy spectrum specified by SPn cards and SIn cards and using the built-in functions for
source probability. If the surface source is transformed into several locations, the SIn card
lists the transformation numbers and the SPn and SBn cards give the probabilities and
bias of each transformation. In present simulation the antimony source is specified as a
uniform source with the maximum energy 0.023 MeV. For result comparison between
two sources, the 252Cf source is also defined in MCNP input file. The parameters [-3 a b]
specify Watt fission spectrum for 252Cf source, where a equals 1.025 MeV, b equals 2.926 MeV-1.
Point detector 3He is specified by f4:n card and fm4:n card in the present experiment, and the coordinates of the location and radius of sphere of exclusion. The 3He detector tally calculates the flux passing through the whole detector surface. To simulate a real detector
f4:n –card is used for neutron particles, which tallies flux averaged over the detector cell
volume. A tally multiplier card, fm4:n card specifies the material number (e.g. 3He), and the reaction index {103 for (n, p) reaction of 3He}. Fm-card calculates the quantity:
where, Ψ(E) is energy dependent flux (particles/cm2) and R
m(E) is an operator describing
the reaction cross section (barns) of type-m. The constant C is atomic density (in atom
per barn-cm). To obtain the true yields, this tally has to be multiplied by the detector cell
volume. The energy range over which the integration is performed can be specified by a
EN card.
3.1.7 Weight Windows
The weight window is a space-energy-dependent splitting and Russian roulette technique.
For each space-energy phase space cell, the user supplies a lower weight bound. The
upper weight bound is a user-specified multiple of the lower weight bound. These weight
bounds define a window of acceptable weights. If a particle is below the lower weight
bound, Russian roulette is played and the particle's weight is either increased to a value
within the window or the particle is terminated. If a particle is above the upper weight
bound, it is split so that all the split particles are within the window. No action is taken
for particles within the window. Weight window provide an alternative means to
∫
E R E dEimportances (IMP:n cards) for specifying space and energy importance functions. The
advantages of weight windows are that they provide an importance function in space and
time or space and energy; control particle weights; are more compatible with other
variance reduction features such as the exponential transform (EXT:n card); can be
applied at surface crossings, collisions, or both; the severity of splitting or Russian
roulette can be controlled; can be turned off in selected space or energy regions; and can
be automatically generated by the weight window generator. Weight windows can be
either cell–based or mesh–based. A cell–based weight-window lower bound in a cell that
is in a universe is interpreted as a multiplier of the weight-window lower bound of the
filled cell.
3.1.8 Peripheral Cards
The number of histories, and description of the tally types to be printed etc., are specified
at the end of the input deck by cutoff cards. The total history for each calculation is 10
million. The MCNP simulated calculations are run on the workstations with UNIX
operation system: ULTRA 10. The running time is about one hour for each calculation.
3.2 Simulations with MCNP
The experiment was simulated by MCNP with standard samples of known neutron
thermal absorption cross section values. The source, the sample and the detector are
located in a water tank 97 cm in height. The source and sample were put as close as
possible. The source-sample center distance was set 3.001 cm in MCNP input file. The
detector with a 0.5 cm in radius. Tittle and Crawford (1984) as well as Bussian (1991)
stated that the detector orientation of 90o minimized the effect of sample scattering on the detector counts. Therefore the detector was oriented at 90o with respect to the source-sample center line for the initial calibration of the steady source experiment. The
importance for each cell is specified in present experiment simulation while setting zero
importance for the cell outside the water tank. In present steady source experiment
simulation the antimony source is specified as a uniform source with the maximum
energy 0.023 MeV. For result comparison between two sources, the 252Cf source is also defined in MCNP input file specified with Watt fission spectrum. The calculation time
for each sample is about one hour, during which 10 million histories were calculated for
each. Perturbation effect is treated to reduce thermal effect. Weight window method is
also used as variance reduction technique to control particle weight.
3.2.1 Calculation with Aqueous Samples
To encompass geologic aqueous solutions (borehole fluids) samples the known neutron
thermal absorption cross section of standard aqueous samples range about from 22 CU to
75 CU was adequate. These aqueous samples were prepared by dissolving different
amounts of pure sodium chloride in pure de-ionized water. Therefore the solutions of
various concentrations as well as various absorption cross sections were gained. The
theoretical cross sections of these standard samples were selected from MCNP nuclear
and atomic data libraries. The primary sources of cross section data are evaluations from
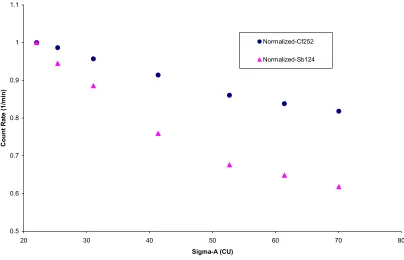
The results from simulations of Both Antimony-Beryllium and Californium steady source
experiments with sodium chloride solution samples are shown in Table 3-1, and the
sensitivity comparison plots between two steady sources are shown in Figure 3-1. The
counting rate data was normalized by divided by a normalization standard count rate. For
these aqueous samples, sodium chloride solution with 1.0062 gm/cm3 in density is chosen as the standard one for aqueous samples.
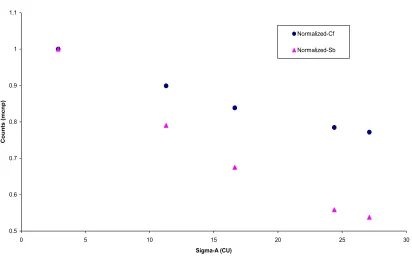
3.2.2 Calculation with Powder Samples
The experiment simulation was also calibrated with standard powder samples. To suitable
for geologic rock powders samples, the known neutron thermal absorption cross section
for samples range about from 2 CU to 20 CU was adequate. These powder samples were
prepared by mixing pre-calculated amounts of silicon oxide and boric acid powder.
Different amounts of silicon oxide and boric acid powder give various concentrations as
well as various absorption cross sections powder samples. The theoretical cross sections
of both silicon oxide and boric acid were pre-calculated by selected from MCNP nuclear
and atomic data libraries. Therefore the theoretical macroscopic cross section of the
mixture could be calculated from the Evaluated Nuclear Data File (ENDF) system.
The results from simulations of Both Antimony-Beryllium and Californium steady source
experiments with silicon oxide and boric acid powder samples are shown in Table 3-2,
and the sensitivity comparison plots between two steady sources are shown in Figure 3-2.
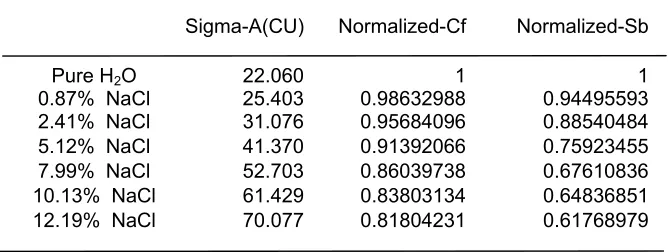
Sigma-A(CU) Normalized-Cf Normalized-Sb
Pure H2O 22.060 1 1
0.87% NaCl 25.403 0.98632988 0.94495593
2.41% NaCl 31.076 0.95684096 0.88540484
5.12% NaCl 41.370 0.91392066 0.75923455
7.99% NaCl 52.703 0.86039738 0.67610836
10.13% NaCl 61.429 0.83803134 0.64836851
12.19% NaCl 70.077 0.81804231 0.61768979
Table 3-1 Data from simulations of Both Antimony-Beryllium and Californium steady
source with sodium chloride solution samples
Sigma-A(CU) Normalized-Cf Normalized-Sb
SiO2 (pure) 2.88 1 1
SiO2 + 0.3g H3BO3 11.29 0.899197838 0.790388357
SiO2 + 0.5g H3BO3 16.64 0.838402432 0.675333849
SiO2 + 0.8g H3BO3 24.39 0.784598497 0.558600101
SiO2 + 0.9g H3BO3 27.12 0.771831462 0.537889490
Table 3-2 Data from simulations of Both Antimony-Beryllium and Californium steady
Aqueous Samples
0.5 0.6 0.7 0.8 0.9 1 1.1
20 30 40 50 60 70 80
Sigma-A (CU)
C
oun
t R
at
e
(
1
/min)
Normalized-Cf252 Normalized-Sb124
Figure 3-1. Sensitivity comparison from simulations of Both Antimony-Beryllium
and Californium steady source
Powder samples
0.5 0.6 0.7 0.8 0.9 1 1.1
0 5 10 15 20 25 30
Sigma-A (CU)
Counts (m
cnp)
Normalized-Cf Normalized-Sb
Figure 3-2. Sensitivity comparison from simulations of Both Antimony-Beryllium
and Californium steady source
3.3 Discussions of Simulation
From Monte Carlo simulation calculations (Figure 3-1 and Figure 3-2) sensitivity gains
improved with the 124Sb-Be source compare to the 252Cf source. The sensitivity improvement is expressed by the change of the slope of the linear function as absorption
cross section versus counting rate. The comparison of the slopes and intercepts of the
calibration curves between two sources is given in Table 3-3.
A steady source experiment was optimized and benchmarked by Monte Carlo simulation
(MCNP code). An 124Sb-Be source was introduced into the system which gives sensitivity improvement compare to Californium-252 source. However, such a source
with very low energy (maximum energy is 23 Kev) would bring significant problem
about thermal effect. Some treatments like perturbation effect (S(α,β)) method has been
used in MCNP simulation to reduce molecular binding effects. Thermal S(α,β) tables are
not required, but they are absolutely essential to get correct answers in problems
involving neutron thermalization. The data on these tables encompass those required for a
Sources Results from simulation with
Aqueous samples
Results from simulation with
Powder samples
Californium 252
m : - 0.0039 (1/CU) (slope) C : 1.0813 (non-units) (intercept)
m : - 0.0094 (1/CU) (slope) C : 1.0136 (non-units) (intercept)
Antimony 124
m : - 0.0065 (1/CU) (slope) C : 1.1612 (non-units) (intercept)
m : - 0.0191 (1/CU) (slope) C : 1.0265 (non-units) (intercept)
Table 3-3 Sensitivity improvement--The comparison for slopes and
Chapter 4
Experiments with
124Sb-Be Source
Similar in principle to that described by Tittle and Crawford (1984) a steady source
experiment device was developed. Plexiglass tubes used as waterproof holders for the
source, sample and detector were made by a workshop at NC State. Both aqueous
samples and powder samples were used in the experiments to encompass geological
samples. A 3He was used as thermal neutron detection medium. The 124Sb-Be source was obtained from Frontier Technologies source company and also encapsulated at NC State
prior to activated in the NC State PULSTAR Reactor. A 252Cf source used in previous work by Tallavarjula and Sood was used for sensitivity improvement comparison.
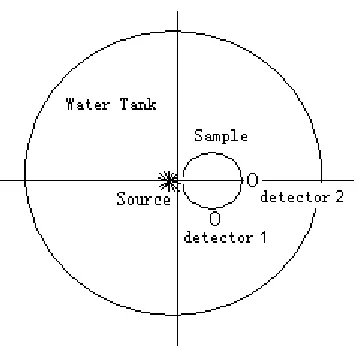
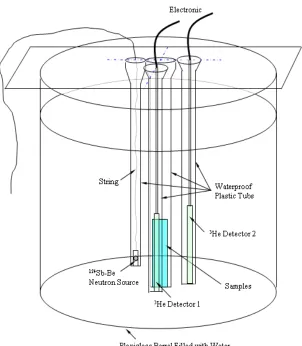
4.1 Experiment System
The side view of the new experiment design is shown in Figure 4-1. The system consists
of a moderating tank of 106.68 cm in diameter and filled with water up to 99.5 cm in
height. Plexiglass tubes, which are used in the present design because of their good
properties under radiation, are designed specially as the holders for the source, the sample
and the detector so that these can be waterproof during the experiments and the detector
can be held grazing the sample container surface.
A cylindrical polyethylene bottle with 6 cm in diameter and 10.5 cm in height was chosen
to contain the aqueous or powder samples. From the conclusion of Tallavarjula[5]’s
sensitivity. In present experiment the volume of the sample is determined as 275 cm3. A string is designed to move the samples during the experiment for various cross section
measurement points.
A 124Sb-Be neutron source was welded into an plastic encapsulation and activated in the PULSTAR reactor before experiments. It was placed with its axis along the axis of the
moderating tank with its center about 45 cm below the center of the tank. The source
encapsulation external dimensions are 2.1 cm in diameter and 15 cm in length. It is held
very close to the sample, with a distance of about 5 cm from the source axis to the sample
axis. The steady neutron energy spectrum is uniform with 23 KeV in maximum
approximately. A string is used to move the source before and after the experiment.
The 3He detector is widely used as detection tools for thermal neutrons. The reaction is expressed by,
The cross section for the reaction is large so that the counting efficiency of the detector
can be high enough with small active dimensions. The thermal neutron cross section for
this reaction is 5330 barns at 2200 m/s and falls off with 1/ν energy dependence. The
orientation of the angle used in experiment is 90o and 180o (Figure 2-2).
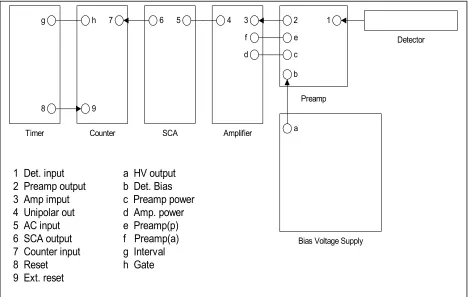
4.2 Counting Rate Electronics
KeV p
H n
He 1 764
1 3 1 1 0 3
The counting rate electronic circuit is used to measure the counting rate of the pulse from
the 3He detector. The pulse out of the detector goes through a preamplifier. After that, they are processed by a linear amplifier. The linear amplifier provides voltage gain to the
preamplifier pulses, so that the pulses can be counted easily. The amplified linear pulses
are converted to logic pulses by a single channel analyzer (SCA). When set in the integral
discriminator mode, SCA produces a logic pulse only if the linear input pulse exceeds a
set discrimination level. If the input pulse is below the lower level discriminatior (LLD),
no output appears. The numbers of logic pulses are recorded by a scaler. They are also
accumulated over a certain period of time set for each measurement. The modules of the
measure system are shown in Figure 4-2.
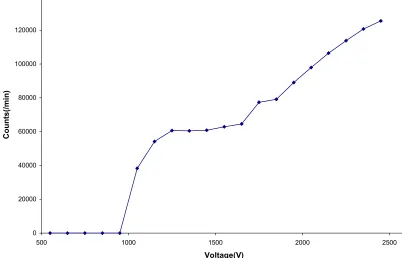
The parameters of experimental apparatuses were preset by,
Gain (AMP) = 100 × 1.5 Lower (SCA) = 0.3 V
The high voltage plateau determination test was done to determine the operating voltage.
The test was begin at 550 V and was raised by small increment each time. A one-minute
count was set. The plateau curve is shown in Figure 4-3. From the test results, the
Figure 4-2. The electronic circuit system for cross section measurement g
9 7
8
h 6 5 4 3 2 1
Timer Counter SCA Amplifier
Preamp
Detector
Bias Voltage Supply c
e
a b d
f
1 Det. input 2 Preamp output 3 Amp imput 4 Unipolar out 5 AC input 6 SCA output 7 Counter input 8 Reset 9 Ext. reset
0 20000 40000 60000 80000 100000 120000 140000
500 1000 1500 2000 2500
Voltage(V)
Counts(/
m
in
)
4.3 Preparation for Samples
The experiment was calibrated with standard samples of known neutron thermal
absorption cross section values. To encompass geologic samples the cross section range
of 2 CU to 20 CU was adequate for powder samples while the cross section range from
22 CU to 75 CU was adequate for aqueous samples. In present experiments, the mixture
of pure silicon oxide and boric acid powder were chosen as powder samples as well as
Sodium chloride solutions were chosen as aqueous samples. In addition, pure sodium
carbonate powder samples and pure sodium sulfate powder samples were also used as
calibration standards. The theoretical macroscopic cross sections of these standards can
be calculated from the microscopic cross section values of these elements at 2200 m/s
and the sample density. The thermal neutron microscopic cross sections (2200 m/s) for
pure element used in experiment as standard aqueous and powder samples are listed in
Table 4-1.
4.3.1 Aqueous Samples
The standard aqueous samples were prepared by dissolving different amounts of pure
sodium chloride in pure de-ionized water. Therefore solutions providing various
macroscopic absorption cross sections were obtained. The amounts of sodium chloride
compound were pre-calculated, and the densities of solutions were pre-known, therefore
the solution weight and density can be calculated as formula given below,
Wsolution = WNaCl + WH2O Total solution weight
ρsolution = Wsolution/Vsolution Solution density
WNaCl and ρNaCl represent the weight and the density of compound sodium chloride. WH2O
and ρH2O represent the weight and the density of water. The weight of each element in
sodium chloride is given by,
WNa = (WNaCl / MNaCl) × ANa Weight of Sodium
WCl = (WNaCl / MNaCl) × ACl Weight of Chlorine
WH = (WH2O / MH2O) × AH Weight of Hydrogen
WO = (WH2O / MH2O) × AO Weight of Oxygen
MH2O and MNaCl represent the molecule numbers of water and sodium chloride. Then the
theoretical macroscopic cross section of the aqueous samples could be calculated by,
Where NA is the Avogadro’s constant. σi is the microscopic cross section of the element i.
Ai is the atomic mass of the element i. Capital I represents the total number of elements
in the mixture. The pre-calculated macroscopic cross sections of standard aqueous
samples were listed in Table 4-2.
4.3.2 Powder Samples
The experiment was also calibrated with standard powder samples. 10B has very high thermal neutron absorption cross sections. Thus boric acid was introduced to make
powder standards. Powder samples used in the experiments were prepared by mixing
pure silicon oxide and boric acid powders. To represent geologic rock powders samples,
the known neutron thermal absorption cross section of standard samples range was
∑
∑
= × × I ×i
A wi Ai i
N σ
chosen from 2 CU to 20 CU. The amounts of compounds silicon oxide and boric acid
were pre-calculated, and their densities and weights were known, and the theoretical
macroscopic cross section of the mixture powder samples was calculated. The formula
used for element weight and powder sample macroscopic cross sections calculations were
similar to those used for aqueous samples. However because element Oxygen was
appeared in both silicon oxide and boric acid, the weights of Oxygen were added
together. Pure sodium carbonate powder samples and pure sodium sulfate powder
samples were also used as calibration standards. The pre-calculated macroscopic cross
sections of standard aqueous samples are listed in Table 4-3.
4.4 Preparation for Source
A 124Sb-Be neutron source was encapsulated by a workshop at NC State. After encapsulation, the source has an external dimension of 2.1 cm diameter and 15 cm length.
A string was designed on the top for moving source before and after experiments. The
source should be activated in the reactor for about 15 hours and be shut down for about
17 hours before used in experiments. The estimate output is 4000 neutron/sec. Actions
occurred inside the source pellet to give out neutrons by,
123Sb Æ 124Sb Æ γ γ + 9Be Æ n
The source was placed with its axis along the axis of the moderating tank during the
experiment, but its center is about 45 cm below the center of the tank. The procedure of
Element Z A σa (barns)
H 1 1.008 0.3326
B 5 10.820 758.4
C 6 12.001 0.0037
N 7 14.008 1.880
O 8 15.999 0.0002
Na 11 22.991 0.531
Si 14 28.086 0.171
S 16 32.064 0.520
Cl 17 35.457 33.800
K 19 39.098 2.100
Ca 20 40.080 0.430
Table 4-1. The thermal neutron microscopic cross sections (2200 m/s) for
Sodium Chloride
Solutions
Solution Density
ρsolution (gm/cm3)
Σa
(CU)
Pure H2O 1.0000 22.242
0.87 % NaCl 1.0062 25.403
2.41 % NaCl 1.0172 31.076
5.12 % NaCl 1.0367 41.408
7.99 % NaCl 1.0577 52.703
10.13 % NaCl 1.0736 61.429
12.19 % NaCl 1.0890 70.077
Table 4-2. The pre-calculated macroscopic cross sections of
Mixture Powder
Solutions
Solution Density
ρsolution (gm/cm3)
Σa
(CU)
Pure SiO2 1.678 2.88
SiO2 + 0.31g H3BO3 1.678 11.29
SiO2 + 0.52g H3BO3 1.678 16.64
SiO2 + 0.82g H3BO3 1.678 24.39
SiO2 + 0.91g H3BO3 1.678 27.12
Table 4-3. The pre-calculated macroscopic cross sections of
4.5 Calibration with Standard Samples
4.5.1 Experiments with
252Cf and
124Sb-Be Source in new apparatus
The calibration experiments were done with both 124Sb-Be and 252Cf steady sources and both aqueous and powder samples. The counting rates were normalized by being divided
by a normalization standard counting rate. For aqueous samples a water sample was
chosen as the standard, while for powder samples, a pure silicon oxide powder sample
with 1.678 gm/cm3 in density was chosen. A 252Cf source (3.5 µg as of 03/31/1993, Model SR-CF-100) with 7.3 × 10⁶ n/s neutron output and a 124Sb-Be source (124Sb 10mCi/122Sb 16mCi of 05/23/02) with 4.0 × 10³ n/s neutron output were used for
measurement comparison. The detector was located in 90o and 180o orientations separately and 5 minutes counting rates were used for each measurement. The sample
was removed and reintroduced into the system, recording the counting rate five times.
The mean counting rates were obtained by averages and were normalized to form
standard one. Calibration curves of neutron absorption cross-sections measurements with
Antimony Vs. Californium with Aqueous Samples (90)
0.5 0.6 0.7 0.8 0.9 1 1.1
20 30 40 50 60 70 80
Sigma-A (CU)
C
o
unt
R
at
e (1/m
in)
Exp(Sb-124)-90:1400V Exp(Cf-252)-90:1400V
Figure 4-5. Sensitivity improvement comparison from experiment measurements for absorption cross section
Antimony Vs. Californium with Aqueous Samples(180)
0.5 0.6 0.7 0.8 0.9 1 1.1
20 30 40 50 60 70 80
Sigma-A (CU)
C
o
unt
R
at
e (1/m
in)
Exp(Cf-252)-180:1400V Exp(Sb-124)-180:1400V
Figure 4-6. Sensitivity improvement comparison from experiment measurements for absorption cross section
4.5.2 Semi-empirical model
A semi-empirical model was proposed to describe both absorption and scattering
cross-sections of the discrete aqueous and powder samples in Tallavarjula[5]’s work. Two detector locations (90° and 180° orientations) are introduced for measurements. The detector response is modeled by an exponential attenuation term given by,
( ) ( )
A exp[ d( )
eff]Rθ = θ − θ ∑
Where R(θ) is the detector yield at the orientation θ. A(θ), d(θ) and k(θ) are empirical parameters and can be determined using a least squares method on the cross-sections
values of the known standards. ∑eff is the effective cross-sections defined by taking into
account both the absorption and the scattering cross-sections of the sample as:
( )
S aeff =∑ +k ∑
∑ θ
A similar, new semi-empirical model is introduced in Sood[6]’s work. The method of two detector locations used to describe both absorption and scattering cross-sections are same
as the old model. However, the improvement is that new model allows independent
behavior of the thermal neutron absorption and scattering cross-sections. The response
function of the detector is given by
( ) ( )
c exp[ a( )
a b( )
S]Rθ = θ − θ ∑ − θ ∑
If calibration measurements are made at 90° and 180° orientations, two simultaneous equations will resolve ∑a and ∑s explicitly. Figure 4-7 shows the absorption
experimental measurements. After normalization the simulation results fit the
experimental curve very well. The detector responses of simulation and experiments at
both 90° and 180° orientations are also shown in Figure 4-9 and Figure 4-10. Sensitivity improvement was expressed by the change of the slope of the linear function as
absorption cross-sections versus counting rates. The comparison for slopes and intercepts
of the calibration curves between two sources for both simulated calculation and
experimental measurements is given in Table 4-5.
4.5.3 Compare to previous work (
252Cf Source in paraffin box)
For the reason of comparing sensitivity improvements, the experiments with 252Cf source in paraffin box were done for aqueous samples only. The calibration curve is shown in
Figure 4-11. And the experiment data compare to Sood[6]’s results are listed in Table 4-4.
The counting rates were normalized. The slope is closed to the previous value and the
errors of slope and intercept are acceptable.
Repeat Experiment Result Sood’s Result
Slope (1/CU) -0.0034 -0.00336
Error of Slope (1/CU) 5.83e-05 4.77e-05
Intercept (non-units) 1.0387 1.0572
Error of Intercept (non-units) 1.019e-03 2.59e-03
The results showed in 4.5.1 and 4.5.2 are all experiments done in water tank apparatus.
To present the sensitivity improvement from previous work, the comparison between
those done in paraffin box with 252Cf source and those done in water tank with 124Sb-Be source is given in Figure 4-12. The results seem not being improved too much from
Sood[6]’s experiments. Because the scattering effects from moderating medium are significant in these measurements, this cannot be ignored in data analysis and
conclusions. A Cadmium shield is considering to reduce neutron scattering effect in the
Semi-empirical Model (90 and 180)
0.0E+00 1.0E-03 2.0E-03 3.0E-03 4.0E-03 5.0E-03 6.0E-03
20 30 40 50 60 70 80
Sigma-A (CU)
Count
in
g
Rate
Counts from Cf-252(90) Counts from Cf-252(180) Counts from Sb-124(90) Counts from Sb-124(180)
Figure 4-7. Semi-empirical Model of Absorption cross section measurement for both
MCNP Vs. Exp for Sb-124
0.75 0.8 0.85 0.9 0.95 1 1.05
20 30 40 50 60 70 80
Sigma-A (CU)
Coun
ting Ra
te
Exp(Sb-124)-90
Norm MCNP Sb-124(90)
Figure 4-8. Comparison between MCNP simulation and experimental measurements
Semi-empirical Model for Sb-124(90)
0.8 0.85 0.9 0.95 1
0.8 0.85 0.9 0.95 1
Experimental Detector Response (90 degree)
MCN
P
D
e
tec
tor
Re
sponse
(90
degr
ee
)
Exp(Sb-124)-90
Linear (Exp(Sb-124)-90)
Semi-Empirical Model for Sb-124
0.4 0.5 0.6 0.7 0.8 0.9 1 1.1
0.7 0.75 0.8 0.85 0.9 0.95 1
Experimental Detector Response (180 degree)
M
C
NP Det
ect
or Re
sponse
(
180 de
gree)
Exp(Sb-124)-180
Linear (Exp(Sb-124)-180)
y = -0.0034x + 1.0387
0.8 0.85 0.9 0.95 1
20 30 40 50 60 70 80
Sigma-A(CU)
Count
Rat
e
(#
)
Comparison with previous data
0.7 0.75 0.8 0.85 0.9 0.95 1 1.05
20 30 40 50 60 70 80
Sigma-A (CU)
Coun
ting
Rate
Exp(Sb-124)-180 Norm Previous Data
Figure 4-12. Comparison between results of Antimony source in water tank
4.6 Discussion for Experiment Measurements
An improved apparatus and a 124Sb-Be source were benchmarked by Monte Carlo simulation then was introduced into the experimental system for both aqueous and
powder samples measurements. Such a source would bring some problems about gamma
rays. The adjustments for the lower level of SCA should reduce gamma rays effect to
minimum. The half life time of 124Sb-Be is very short, only about 2.5 days. Therefore the counting rates will diminish quickly day by day. The results normalization will keep
multiple measurements to an agreement. Sensitivity improvement was expressed by the
change of the slope of the linear function as absorption cross-sections versus counting
rates. From Table 4-5, the lower energy source (124Sb-Be) offered better sensitivity improvement.
A semi-empirical model was successfully applied to verify both absorption and scattering
cross-sections. The simulation data and experimental results are fitted very well.
However, the thermal effect still has some problems to the simulation results. More
Sources
Results from MCNP simulation
with Aqueous samples
Results from experiment
with Aqueous samples
252Cf m : - 0.0039 (1/CU) (slope)
C : 1.0813 (non-units) (intercept)
m : - 0.0039 (1/CU) (slope) C : 1.0746 (non-units) (intercept)
124Sb-Be m : - 0.0065 (1/CU) (slope)
C : 1.1612 (non-units) (intercept)
m : - 0.0059 (1/CU) (slope) C : 1.0895 (non-units) (intercept)
Chapter 5
Conclusions and Future Work
5.1 Summary and Conclusions
1. A steady source experiment technique for neutron absorption cross-sections
measurement was optimized and benchmarked by Monte Carlo simulation (MCNP
code). An Antimony-124 (Be) source was introduced into the system with lower
energy 23 KeV. From both simulated calculations and the experimental results, the
sensitivity for absorption cross section measurement with 124Sb-Be source has been
improved compare to 252Cf source has done.
2. Such a very low energy (maximum energy is 23 Kev) source would bring significant
problem about thermal effect. Some treatments like perturbation correction (S(α,β))
method and weight window method has been used in MCNP simulation to reduce the
molecular binding effect.
3. Monte Carlo studies were also used for some attenuation tests with both aqueous
samples and powder samples at the beginning, so that the behavior of thermal neutron
flux perturbation in the vicinity of a sample could be demonstrated. The thermal
neutron flux can be described as an exponential function of the positions.
4. Using the knowledge obtained from MCNP simulations, the experimental apparatus
construction and the source shielding would be relatively accurate. Experimental
responses and MCNP responses matched very well for Cf-252 source. However, for
Sb-124 Source, Experimental responses still have less slope than simulation. In MCNP
an ideal situation. During experiments, Antimony source with short half-life shows a
big instability, which affects the response very much. The density of the sample is also
not exactly same as calculated by standard formula. These factors will make less
sensitivity than simulations.
5. During the experiments the gamma rays brought big trouble on counting rates stability.
The lower level of SCA was adjusted carefully and worked together with MCA to
reduce the gamma rays effect to minimum.
6. Neutron scattering in moderator will affect the detector’s counting rates slightly. This
kind of effect is minimized on 90o orientation. The detector response on 90o orientation was given a little better results then the one on 180o orientation.
7. A semi-empirical model was successfully developed and applied to incorporate both
absorption and scattering cross-sections in MCNP simulated calculations. This model
was then confirmed and validated in experimental measurements.
8. Compared to the previous work, the results seem not being improved too much from
Sood’s experiments. Because the scattering effects from moderating medium cannot
be ignored in data analysis and conclusions.
5.2 Future Work
1. Gamma rays shielding is still a problem. More improvement should be considered
during the later work.
2. A Cadmium (Cd) shield around the detector is being considered to reduce the
3. Experiments for geologic rock samples will be done after calibrations, which will be
more helpful to the applications in the oil well logging industries. The absorption cross
sections gained from experiment results would compare to those from Monte Carlo
Reference
[1] Tittle, C.W., Crawford, G.W., 1983. Measuring the thermal neutron absorption cross
section of rocks. Log analy.
[2] Salaita, G.N., 1985. A system for measuring thermal neutron absorption cross section
of small liquid and rock samples. SPWLA 26th Annual Logging Symposium Transactions, Paper Q.
[3] Mickael, M.w., 1988. Monte Carlo simulation of dual-spaced neutron porosity well
logging tool responses. Ph.D. Thesis NCSU.
[4] Bussia, A.E., Jetter, W.A., Supernaw, I.R., 1991. Amethod for measuring thermal
neutron absorption and transport cross sections. Nucl. Geo 5(4), 439-449
[5] Tallavarjula, S., 1995. Thermal neutron cross section measurement for geological
materials. Ph.D. Thesis, NCSU.
[6] Sood, A., Gardner, R.P., Gray, T.K., 2000. Steady neutron source measurement
method for Σa and Σs in geological samples. Applied Radiation and Isotopes, 53,
603-616.
[7] Knoll, G.F., 1989. Radiation Detection and Measurement. John Wiley & Sons, New
York.
[8] Beckurts, K.H., Wirtz, K., 1964. Neutron Physics. Springer-Verlag, New York.
[9] Mughabghab, S.F., divadeenam, M., Holden, N.E., 1981. Neutron Cross Sections,
[10] MCNP- a general purpose Monte Carlo n-particle transport code version 4C.
LA-7396-M, Los Alamos National Laboratory.
[11] Weast, R.C., 1983. CRC Handbook of Chemistry and Physics. The Log Analyst.
Appendix
APPENDIX A
MCNP INP file.
Sb-Be Source problem calculated by MCNP "PLOT: mcnp ip inp=filename" c
c c c c c c c c c c c c c c c c c c c c c c c c c c c c c c c c c c c c Descriptions
c Source: Sb-124 (Uniform source)
c Cf-252 (for sensitivity comparison) c Samples: Both Aqueous samples and powder samples c Detector: He-3 cylinder detector is used
c Source located at the original point c Importance cards are defined
c Perturbation effect is considered c Weight window generator is used
c c c c c c c c c c c c c c c c c c c c c c c c c c c c c c c c c c c c
c cell cards c
1 2 -1.678 -1 4 -5 $ sample
2 3 -9.75e-3 -2 4 -5 $ He-3 detector(180) 3 3 -9.75e-3 -3 4 -5 $ He-3 detector(90) 4 1 -1.00 -8 6 -7 #1 #2 #3 $ water tank
5 1 -1.00 -9 8 6 -7 $ water tank 6 1 -1.00 -10 9 6 -7 $ water tank 7 1 -1.00 -11 10 6 -7 $ water tank 8 1 -1.00 -12 11 6 -7 $ water tank 9 0 12:-6:7 $ out of tank c
c surface cards c
1 c/z 3.001 0 3.0 $ sample cylinder 2 c/z 8.0 0 0.5 $ detecter at 180 deg. 3 c/z 3.001 5.0 0.5 $ detecter at 90 deg. 4 pz -5.25 $ bottom of the sample 5 pz 5.25 $ top of the sample 6 pz -48.5 $ bottom of the tank 7 pz 48.5 $ top of the tank 8 c/z 3.001 0 10 $ cyl-8 (water tank) 9 c/z 3.001 0 15 $ cyl-9 (water tank) 10 c/z 3.001 0 25 $ cyl-10 (water tank) 11 c/z 3.001 0 40 $ cyl-11 (water tank) 12 c/z 3.001 0 55 $ cyl-12 (water tank) c
c material cards c
mode n
c
c m2 1001.50c -0.1119013 8016.50c -0.8880987 $ water sample c
m2 1001.50c -0.09757 8016.50c -0.78053 11023.51c -0.04795
17000.51c -0.07395 $ NaCl + H2O AWL5 rho=1.089 c
c m2 1001.50c -0.09986 c 8016.50c -0.79884 c 11023.51c -0.03985
c 17000.51c -0.06145 $ NaCl + H2O AWL4 rho=1.0736
c
c m2 1001.50c -0.10223 c 8016.50c -0.81787 c 11023.51c -0.03143
c 17000.51c -0.04847 $ NaCl + H2O AWL3 rho=1.0577
c
c m2 1001.50c -0.10542 c 8016.50c -0.84338 c 11023.51c -0.02014
c 17000.51c -0.03106 $ NaCl + H2O AWL2 rho=1.0367
c
c m2 1001.50c -0.10843 c 8016.50c -0.86747 c 11023.51c -0.00948
c 17000.51c -0.01462 $ NaCl + H2O AWL1 rho=1.0172
c
c m2 1001.50c -0.11014 c 8016.50c -0.88116 c 11023.51c -0.00342
c 17000.51c -0.00528 $ NaCl + H2O AWL1/2 rho=1.0062
c
c m2 14000.51c -0.4666667
c 8016.50c -0.5333333 $ SiO2 c
c m2 1001.50c -1.0e-8 c 5010.50c -1.0e-8 c 5011.35c -1.0e-8 c 8016.50c -0.5325
c 14000.51c -0.4675 $ Si02 + 0.0 gm H3BO4 c
c m2 1001.50c -0.00003039 c 5010.50c -0.00001922 c 5011.35c -0.00008951 c 8016.50c -0.53260669
c 14000.51c -0.46725418 $ Si02 + 0.3 gm H3BO4 c
c 14000.51c -0.4670514 $ Si02 + 0.5 gm H3BO4 c
c m2 1001.50c -0.8392104e-4 c 5010.50c -0.5217312e-4 c 5011.35c -0.2478778e-3 c 8016.50c -0.5329832
c 14000.51c -0.4666328 $ Si02 + 0.8 gm H3BO4 c
c m2 1001.50c -0.00008930 c 5010.50c -0.00005648 c 5011.35c -0.00026303 c 8016.50c -0.53290021
c 14000.51c -0.46669102 $ Si02 + 0.9 gm H3BO4 c
c m2 11023.51c -0.3931624
c 17000.51c -0.6068376 $ NaCl (pure) c
c m2 11023.51c -0.4339623 c 8016.50c -0.4528302
c 6012.50c -0.1132075 $ Na2CO3 (pure) c
c m2 11023.51c -0.3239437 c 8016.50c -0.4507042
c 16032.51c -0.2253521 $ Na2SO4 (pure) c
c m2 20000.51c -0.3973600 c 8016.50c -0.4755948
c 6012.50c -0.1189800 $ CaCO3 (pure) c
c m2 20000.51c -0.2980200 c 8016.50c -0.5787208 c 6012.50c -0.0892350
c 1001.50c -0.0279753 $ CaCO3 + 0.9 H2O c
c m2 20000.51c -0.2980200 c 8016.50c -0.5787208 c 6012.50c -0.0892350
c 1001.50c -0.0279753 $ CaCO3 + 0.8 H2O c
c m2 20000.51c -0.2980200 c 8016.50c -0.5787208 c 6012.50c -0.0892350
c 1001.50c -0.0279753 $ CaCO3 + 0.7 H2O c
c m2 20000.51c -0.2980200 c 8016.50c -0.5787208 c 6012.50c -0.0892350
c 1001.50c -0.0279753 $ CaCO3 + 0.6 H2O c
m3 2003.50c -1.0 $ He-3 c
c importance cards c
imp:n 1 7r 0 c
c tally src-cell x det. center co-ordinates flag c wwg 14 4 0 11.5 0 0 0
wwg 24 4 0 5.001 6.5 0 0 wwge:n 2.0e-6 1.0e-1 10
c
c source specification cards c
sdef erg=d1 wgt=1 pos=0 0 0 si1 0 0.023
sp1 0 1 $ Uniformed Antimony source Max=23KeV
c
c sc1 Cf-252 Watt spectrum
c sp1 -3 1.025 2.926 $ Californium source c
c tally specification cards c
c f14:n 2 c fm14 -1 3 103 f24:n 3
fm24 -1 3 103 c
c problem cutoff cards c
APPENDIX B
Style and model of electronic apparatuses
Detector: 3He
Bias Voltage Supply: ORTEC 456
Pre-Amplifier: ORTEC 109 PC
Amplifier: ORTEC 575
Single Channel Analyzer: TENNELEC TC 450
Counter: TENNELEC TC 531
Timer: TENNELEC TC 541
APPENDIX C
Pictures For Sb(Be) Source Experiment
Figure C-1. Experimental device