Rainfall Prediction based on Ensemble Model
B.Narayanan 1, Dr.M.Govindarajan 2
Assistant Professor, Department ofComputer Science and Engineering, D.D.E, Annamalai University,
Chidambaram, Tamil Nadu, India1
Assistant Professor, Department of Computer Science and Engineering, FEAT, Annamalai University,
Chidambaram, Tamil Nadu, India2
ABSTRACT: In order to get unnoticed relationship, Data Mining is the trusted area of the modern digital world for the analysis of mass of data sets. The time series analysis is the method used to analyze statistical data observed at regular sequence in a period. This scientific technique is used in forecasting upcoming events over a period. Rainfall prediction can be precisely made with time series analysis. The Support Vector Machine(SVM) and Naive Bayes are the two chief classification methods. In this study, an ensemble model viz., AdaSVM and AdaNaive are applied to analyze the rainfall data sets obtained over a long period of time. It is compared with the existing methods SVM and Naive Bayes. The accuracy and classification error are the two parameters used individually for the prediction of rainfall. The conclusion leads to AdaSVM and AdaNaive is more suitable than the SVM and Naive Bayes for the chosen data set.
KEYWORDS:Data Mining, Time Series, Rainfall Prediction, Weather Forecasting, Support Vector Machine, Naive Bayes, AdaSVM, AdaNaive, Accuracy, Classification Error.
I. INTRODUCTION
In olden days, extraction of pattern from data sets is done manually. In the modern computer era, data set collection, manipulation and its storage is dramatically increased. This leads to huge complexity in Pattern recognition. Data mining is the computerized application of specific algorithms in order to identify specific pattern from the large data sets. A model is developed by learning concept using computer is the part of the area of data mining called as machine learning. For the given large data sets, this model learn by training and testing and by using the learning concept, it predicts new instances of data. The process of generating classification model in order to predict an outcome is generally called as modeling. The data mining process of predicting the value of a target categorical variable by developing a model based on one or more attributes categorical variable is known as classification [1,2]. This can classifies the given data based on the training set and class labels.
The statistical data measured at specified time interval over a period of time is called as time series data. Analysis on this data for the prediction of future occurrence of a time based event is called as time series analysis. One of the most important areas where time series analysis is carried out is in weather forecasting [3].
The predictive data mining techniques such as Support Vector machines and Naive Bayes also called as classifier techniques for analyzing time series data sets are used in this paper in order to predict rainfall. With the intention to increase the prediction accuracy and also to reduce the error rate, boosting is also carried out. The boosting is a method of joining inappropriate and weak prediction rules for generating machine oriented learning. It is an ensemble meta algorithm which is used to reduce bias and variance in machine learning and it will also convert weak learners to strong ones.
do happen periodically. There is no rhyme or regularity in rainfall. Hence prediction of rainfall is needed for the agriculturists, planners, Government and agricultural department. Rainfall prediction is the most important form of prediction in weather forecasting. Though exact prediction may elude, near perfect forecast can be done. This paper makes an attempt to suggest based on a mass of past data.
The work is arranged as follows. Section II describes the previous related work. The Geographical Study of the area is described in section III. Section IV gives Materials and Methods used for the study. Proposed methodology is outlined in section V. In section VI Performance evaluation measures used for the analysis is described. In section VII Experimental results and discussion are explained. Conclusion and future work are indicated in section VIII.
II. RELATEDWORK
Several researchers in computer science have compared several forecasting methods in the prediction of rainfall and weather forecasting. A few of them are outlined here under.
Suhartono, Ria Faulina et al [4] suggested an ensemble model based on ANFIS (Adaptive Neuro Fuzzy Inference System) and ARIMA (Autoregressive Integrated Moving Average) for the prediction of monthly rainfall for two different areas namely Pujon and Wagir located at indonesia. The findings show that an individual ANFIS gives perfect forecast in monthly Pujon’s data and ARIMA model gives perfect forecast in monthly Wagir’s data.
C. R. Rivero et al [5] proposed a Bayesian method for the prediction of cumulative rainfall prediction. The time series rainfall data sets obtained from Cordoba, Argentina is given to the proposed model. The results obtained from the Bayesian model implemented by an ANN filter are satisfactory for the given data set.
A.Geetha , G.M Nasira [6] suggested that decision tree is an ideal method for the rainfall prediction and for analyzing multiple variables, it seems to be an important method. The results show that the rainfall prediction success rate for the year 2014 is 80.67 and were still working for increasing the accuracy rate.
Zhangjiajie, Hunan China [7] presented a novel model which improves the accuracy for time series analysis. At first step, the factors of the environment have been screened nonlinear by support vector machine (SVM). The next step is to estimate the order by Controlled autoregressive (CAR). Finally, the reliability of SVM-CAR is validated by the prediction model. The results indicate that this kind of model gives high-precision and shows very good prospect in drought and flood prediction.
Kesheng Lu, Lingzhi Wang [8] developed a modular type Support Vector Machine(SVM) in order to forecast monthly rainfall in the Guangxi, China. The training sets are generated using bagging technique. The base models are trained to generate different regression i.e different kernel function of SVM with different parameters are used. From all base models, a v-SVM by learning is generated. The findings reveal that forecasting accuracy and quality of prediction is higher by using this proposed nonlinear ensemble model.
Deepti Gupta, Udayan Ghose [9] developed rainfall forecasting models based on Classification and Regression Tree algorithm, Naive Bayes approach, K nearest Neighbour and 5-10-1 Pattern Recognition Neural Network. The result accuracy obtained to the corresponding techniques are 80.3%, 78.9%, 80.7% and 82.1% respectively.
V. B. Nikam and B. B. Meshram [10] identified the challenges in weather prediction . The meteorological data with useful information may be called as weather data. The data obtained from Indian Meteorological Department (IMD) is taken into account for the study. The Bayesian data mining techniques is used for analyzing and prediction of the rainfall. The results indicate that the accuracy of Prediction is good with moderate computing resources by using the Bayesian approach.
III.GEOGRAPHICAL STUDY OF THE AREA
geographical situation of the Cuddalore district is about 160 kilometer south of Chennai. It is fairly a big area of width 3706 Sq.Km.
IV.MATERIALS AND METHODS USED
Dataset:
The rainfall data obtained from indianwaterportal.org is used for the study. The data contains various variables which are responsible for the rainfall for a specific region is taken into account for this work. The historical rainfall data of the CSV type having a record for each line of text akin to the data for a specific month of an year. The time series historical data over 102 years starting from 1901 till 2002 is taken for this experiment. The record attributes are placed as Year/Month, Average Temperature, Cloud Cover, Diurnal Temperature, Maximum Temperature, Minimum Temperature, Potential Evapotranspiration, Reference Crop Evapotranspiration, Vapour Pressure, Wet day Frequency and Precipitation for every month of a specified year. Though there are many measured parameters available in the raw weather dataset, the less relevant features responsible for the rainfall prediction are ignored and the above said features are only taken into account. The "Average Temperature" represents the temperature in the study area which is averagely maintained in a particular month of an year . The "Maximum Temperature" represents the highest temperature noted in the study area for a specific month of an year. The "Minimum Temperature" represents the lowest temperature noted in the study area for a specific month of an year. The "Diurnal Temperature" represents the variation between high temperature and low temperature which occurs during the same month in the year and this is one of the most basic forms of climate pattern. The "Cloud Cover" also called as cloudiness indicates to the fraction of the sky hidden by clouds when noted from a specific place. The "Potential Evapotranspiration" is the total of evaporation and plant transpiration from the lands of earth and surface of the ocean towards the atmosphere for month in a year. An Important part of the water cycle is Evapotranspiration. For example, a tree which contributes to evapotranspiration may be called as Evapotranspirator. A representation for the environmental demand of evapotranspiration can otherwise be called " Reference Crop Evapotranspiration". This represents both height of the short green crop and adequate water status in the soil. In other words it is a reflection of the energy available to evaporate water and the wind available to transport the water vapour from the ground to the lower atmosphere. According to meteorological science, "Vapour Pressure" means partial pressure of water vapour in the atmosphere. The Proportion of wet days among the entire days in a particular month in a year is referred to as "Wet day Frequency" . A major component of water cycle is the "Precipitation", which is the condensation of atmospheric water vapour which falls under gravity for a particular month in a year. The major cause for bringing fresh water in the planet is Precipitation. The "month and the year" in which the weather data is taken into account but is not used for the study.
The dataset is separated for training and testing where 60% of the dataset is used for training and 40% of the dataset is used for testing. By using the classification algorithm, the training dataset is used and models generated. The generated model is applied on the testing dataset in order to test the accuracy.
Machine Learning Methods:
Support Vector Machine:
In the Pattern recognition area, the machine learning technique used is Support Vector Machine(SVM). This method is used to minimize the structural risk. The machine learning technique that is used in the pattern recognition area is SVM. The SVM is used to minimize the structural risk. In the hyper plane (decision surface), nearness of data points means support vectors. The aim of SVM is to make a model on the basis of training data. It lends target values based on the attributes of the test data. For linearly separable data, the data in the hyper plane is divided by the largest margin in the SVM. The inseparable data in the input space is turned to big dimensional space by the SVM using ∈ ℝ →
( )∈ ℝ where ( ) denotes kernel function to get the separated hyper plane. The Kernel function is any symmetric function which fulfils the Mercer’s condition (Courant and Hilbert, 1953). The linear, polynomial, radial basis function (RBF) and sigmoid are the basic kernel used in SVM. Fruitful results are obtained by the application of the SVM and its fusion techniques for time series analysis [11, 12]. The Chief merits of SVM's are its accurate classification technique in solving binary problems. Besides this machine is memory intensive.
Naive Bayes:
of b instance in class a in p(a |b) is represented by the Bayes theorem as p(a |b) = p(b|a )p(a )/p(b). For the
chosen class a , p(b|a ) denotes the probability of generating b instance. p(a ) denotes the probability of the happening of a and p(d) is probability of the happening of d. When the attribute is single, this theorem of classification is done easily. The Naive Bayes classification is done by extending this theorem for more than one attribute by the use of the formula p(b|a ) = p(b1|a )∗p(b2|a )∗… .∗p(bn|a ) where probability of class a is
denoted by p(b1|a ) which generates the value for attribute 1, the value for 2nd attribute is generated by the probability of class a indicated by p(b2|a ) . By the assumption that attributes must have independent distributions, the
calculation is done by Naive Bayes in the formula. The Naive Bayes is used in financial forecasting to get better results [13]. The Merits of Naive Bayesian analysis is that it is fast to train and classify. Besides Naive Bayesian is not sensitive to irrelevant features. It is based on real and discrete data and also handles streaming data as well.
Ensemble Model:
AdaBoost:
The meta algorithm in combining with many other learning algorithms is called AdaBoost algorithm. It is used to improve the performance of classification. The nested operator is used by the AdaBoost and it has a sub process. The learner provided in the its sub process is made use to generate a better model. By creating more than one classifier, the ability of ensemble model expands the classification accuracy. By joining the results of their classification techniques, the ensemble model supports decision making. By this boosting method the accuracy of the given algorithm is bettered. Yoav Freund and Robert E. Schapire in 1995 [14] developed the AdaBoost algorithm. In the training period of AdaBoost algorithm, the input set given is (A , B ), (A , B ), … . , (A , B ) where Ai denotes space set A and Bi
denotes space set B. It is assumed that B = (−1, +1). The base or weak algorithm are called in AdaBoost for the repeated sets Z = 1, … . Z. In the training set, AdaBoost pertains to weight. At the beginning point, the weights are evenly distributed, while for the other training the weights are increased to indicate that they are not properly classified. By this method, weak learner are trained with hard examples. The merit is that this process would improve the accuracy of classification.
V. PROPOSED METHODOLOGY
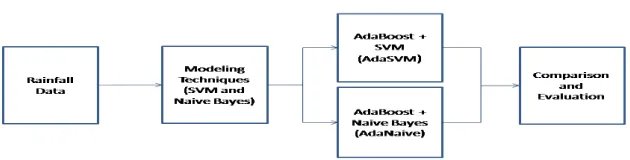
In this paper, an attempt is made to analyze the time series data set to forecast rain precisely than the existing models. Hence ensemble models such as AdaSVM and AdaNaive are developed using AdaBoost technique. The object of the AdaBoost technique is that it focuses on the weak learners who are hard to learn. SVM when joined with AdaBoost (AdaSVM) will make superior classification by giving weak learners with appropriate training. A like approach is used for Naive Bayes classifier in which AdaBoost based Naive Bayes (AdaNaive) is used to generate better classified data. Fig 1 depicts the proposed work classifying the mass of input rainfall data by using SVM and Naive Bayes modeling techniques. It may be seen that it is further classified in order to improve the performance with the help of AdaBoost+SVM (AdaSVM) and AdaBoost+Naive Bayes (AdaNaive). Both are subjected to comparison and evaluation.
VI.PERFORMANCE EVALUATION MEASURES
Accuracy:
Accuracy means very nearness to a measured value or the standard set. Accuracy in time series analysis is the value
forecasted which is very near to the actual value. The formula for accuracy is = ( + )/( + + + )
where the true positive cases are denoted by TP, true negative cases are denoted by TN, FP and FN are denoted for false positive cases and false negative cases respectively.
Classification Error:
The classification Error ( ) of any technique ‘t’ are the cases not correctly classified( + ). The formula for calculating classification Error is = ∗100 where t represents the technique, F denotes number of items classified incorrectly and N reveals total number of samples.
VII. EXPERIMENTAL RESULTS AND DISCUSSION
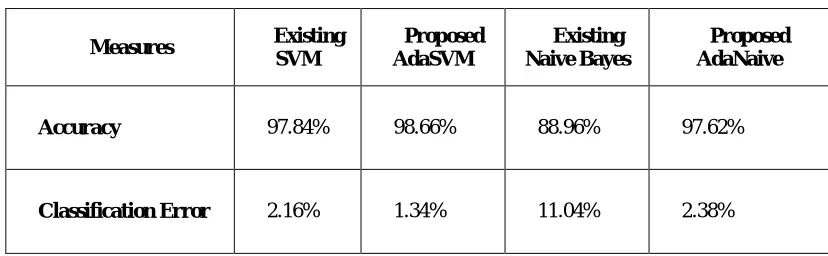
SVM, AdaSVM, Naive Bayes, AdaNaive are the classification methods used for time series forecast in this paper. Two groups are seperated from the data set for training and for testing the algorithms of classification. In order to implement the classification algorithms, the tool used is Rapidminer data analysis. “Read CSV” operator of rapidminer tool is first loaded for Secondary data retained in CSV file . For classification process only a subset of data is selected from the loaded data. To select a subset from original data, “Select Attributes” are utilised by the operator. The chosen subset is then subjected to “X-Validation” operator. It develops the classification model which is validated by the test data. AdaBoost based SVM (AdaSVM), SVM, AdaBoost based Naive Bayes (AdaNaive) and Naive Bayes are implemented for classification by using “X-Validation” operator. The performance of the classification algorithm is evaluated by using the performance operator. Performance evaluation achieved for both the classification algorithms (existing and proposed) are given in Table 1.
Table 1: Performance evaluation of existing and proposed techniques
Measures Existing SVM
Proposed AdaSVM
Existing Naive Bayes
Proposed AdaNaive
Accuracy 97.84% 98.66% 88.96% 97.62%
Classification Error 2.16% 1.34% 11.04% 2.38%
Fig 2: Accuracy and Classification Error for rainfall forecasting of the specified techniques (in %)
VIII. CONCLUSION AND FUTURE WORK
The two existing techniques Support Vector Machine and Naive Bayes are used in this study for the time series analysis for rainfall prediction is carried out. The results show that the accuracy, classification error of prediction by SVM is 97.84% and 2.16% respectively where as Naive Bayes is 88.96% and 11.04% respectively. The proposed AdaSVM produces 98.66% of accuracy and 1.34% of classification error for the same set of input data. The proposed AdaNaive gives 97.62% of accuracy and 2.38% of classification error. It may be concluded from the results that there is good amount of increase in the accuracy of prediction and substantial decrease in the percentage of classification error in both the proposed techniques. Future studies can reveal whether we can extend the study in identifying by changing the technique yields the result or by increasing the input data set for the same technique results change in the findings. Importance of rainfall prediction cannot be over emphasized. Continuous research for hitting at most acceptable method of prediction is needed. This paper is an early attempt but right step towards the final goal.
REFERENCES
[1] Cheng Zhou, Boris Cule, Bart Goethals “Pattern Based Sequence Classification”, IEEE Transactions on Knowledge and Data Engineering, Vol. 28, 5, pp.1285-1298, 2016.
[2] B. Tang, H. He, P. M. Baggenstoss and S. Kay “A Bayesian Classification Approach Using Class-Specific Features for Text Categorization”, IEEE Transactions on Knowledge and Data Engineering, Vol.28, 6, pp.1602-1606, 2016.
[3] P.Samuel Quinan, Miriah Meyer “Visually Comparing Weather Features in Forecasts”, IEEE Transactions on Visualization and Computer Graphics, Vol. 22, 1, pp. 389-398, 2016.
[4] Suhartono, Ria Faulina, Dwi Ayu Lusia, Bambang W. Otok, Sutikno, Heri Kuswanto “Ensemble Method based on ANFIS-ARIMA for Rainfall Prediction”, IEEE International conference on statistics in Science, Business and Engineering (ICSSBE), pp.1-4, 2012.
[5] C. R. Rivero, J. Pucheta, S. Laboret, M. Herrera and V. Sauchelli “Time Series Forecasting Using Bayesian Method: Application to Cumulative Rainfall”, IEEE latin america transactions, Vol. 11, 1, pp. 359-364, 2013.
0 10 20 30 40 50 60 70 80 90 100
Accuracy Classification Error
Existing SVM
Proposed AdaSVM
Existing Naïve Bayes
[6] A.Geetha , G.M Nasira " Data Mining for Meteorological Applications: Decision Trees for Modeling Rainfall Prediction", IEEE International conference on Computational Intelligence and Computing Research (ICCIC), pp.1-4, 2014.
[7] Zhangjiajie, Hunan China “Research on Precipitation Prediction Based on Time Series Model”, International conference on Computer Distributed Control and Intelligent Environmental Monitoring, pp. 568-571, 2012.
[8] Kesheng Lu, Lingzhi Wang " A Novel Nonlinear Combination Model Based on Support Vector Machine for Rainfall Prediction",IEEE 4th International Conference on Computational Sciences and Optimization(CSO), pp.1343-1346, 2011.
[9] Deepti Gupta, Udayan Ghose, " A Comparative Study of Classification Algorithms for Forecasting Rainfall ", IEEE 4th International conference on Reliability, Infocom Technologies and Optimization (ICRITO) (Trends and Future Directions), pp. 1-6, 2015.
[10] V. B. Nikam and B. B. Meshram, "Modeling Rainfall Prediction Using Data Mining Method: A Bayesian Approach",Fifth International Conference on Computational Intelligence, Modelling and Simulation, Seoul, pp.132-136, 2013.
[11] Kamil Żbikowski, “ Using Volume Weighted Support Vector Machines with walk forward testing and feature selection for the purpose of creating stock trading strategy”, Expert Systems with Applications, Vol. 42, 4, pp. 1797-1805, 2015.
[12] Shuhaida Ismail, Ani Shabri, Ruhaidah Samsudin, “A hybrid model of self-organizing maps (SOM) and least square support vector machine (LSSVM) for time-series forecasting”, Expert Systems with Applications, Vol. 38, 8, pp.10574-10578, 2011.
[13] Kurniady, A., Kosala, R., "Knowledge-based integrated financial forecasting system”, International Conference on Computer Research and Development (ICCRD), Vol.1, pp.120-124, 2011.