ISSN(Online): 2319-8753 ISSN (Print) : 2347-6710
I
nternational
J
ournal of
I
nnovative
R
esearch in
S
cience,
E
ngineering and
T
echnology
(An ISO 3297: 2007 Certified Organization)
Vol. 5, Issue 6, June 2016
Optimization of Stake Height and Pressures
for Irrigation Design with Pressure
Compensated Microsprinklers
Ravi Kishore1, V.K. Gahlot 2
PhD Scholar, Department of Civil Engineering, Maulana Azad National Institute of Technology, Bhopal, M P, India1
Professor, Department of Civil Engineering, Maulana Azad National Institute of Technology, Bhopal, M P, India2
ABSTRACT: Hydraulic parameters which effect the design of irrigation system using pressure compensated microsprinklers are stake heights and pressure differences within the system due to friction and elevation changes, inherent design characteristics of emitter, the unit-to-unit variation of emission devices during manufacture, and partial or full clogging of the emitters from particles, insects or organic growth. It is important to know the capacity of irrigation system, or, how much water the irrigation system is capable of applying in a given time period making it pertinent to evaluate performance of pressure compensated micro-sprinklers (PCMS) at different heights at different pressures and overlapping. In this study, the pressure compensated microsprinklers were evaluated at different pressures of 100kPa, 150kPa and 200kPa and stake heights with overlaps of 30%, 40% and 50%. Regression equations were developed for the effect of stake height and pressure variation.
KEYWORDS:coefficient of uniformity, micro-sprinklers, overlapping, stake heights.
I. INTRODUCTION
One of the main tasks of irrigation research has been to find new ways to minimize energy and water use in irrigated agriculture through experimentation. Most of the irrigation today is by open flow systems having a relatively low efficiency of water application. Due to scarcity of water and latest advancements in technology irrigators have started using micro irrigation systems i.e. drips and micro-sprinklers. Micro-irrigation systems (primarily drip and micro sprinklers) often achieve efficiencies in excess of 95 percent, as compared with flood irrigation efficiencies of 60 percent or less. These devices deliver water onto the soil surface very near the plant or below the soil surface directly into the plant root zone. Micro irrigation emitters are designed to discharge water at very low flow rates. Variation in flow characteristics, even though small in magnitude, may represent relatively large variation percentage wise. Unlike other methods of irrigation, distribution of irrigation water in sprinkler is independent of land topography and nature of soil. One of the major constraints in the irrigation system using micro sprinkler and micro jets is its improper hydraulic design not based on optimized values of the hydraulic parameter of the emitters. So it is very much essential to know the optimum values of the hydraulic parameters of the type of a micro-sprinklers or a micro jet which are of two types independent and dependent. The independent parameters are the input pressure and stake height which can be manipulated by the operator. The dependent variables are (i) rate of discharge, (ii) effective wetting radius (iii) average depth of water, (iv) drop size, and (v) coefficient of uniformity (CU, %) of a single emitter. While irrigating large fields (in ha) it has been often reported that water does not reach the farthest distances due to the improper hydraulic design of the system. Some emitters are pressure compensating meaning they discharge water at a constant rate or with little variation over a range of pressures, and when operated in line over a large area the uniformity of distribution is very high. In addition, use of pressure compensating emitters allows the designer to use longer lateral lines and smaller diameter pipes, resulting in lower system costs [1] .
ISSN(Online): 2319-8753 ISSN (Print) : 2347-6710
I
nternational
J
ournal of
I
nnovative
R
esearch in
S
cience,
E
ngineering and
T
echnology
(An ISO 3297: 2007 Certified Organization)
Vol. 5, Issue 6, June 2016
Usually there is a plateau in the sprinkler distribution pattern before the descent begins. Generally, the larger this plateau, the further apart sprinklers can be placed. However, a safe practice observed is to make sure that the last droplets of one sprinkler reach the adjacent sprinkler (50% overlap). Proper overlapping of the sprinklers provides increased uniformity in water distribution over irrigated areas. Poor uniformity may result in some areas being over-irrigated and some areas being under-over-irrigated, which could result in plant stress.
II. LITERATUREREVIEW
Emitter and spaghetti tubing effects on the flow uniformity of micro sprinkler were examined by Boman [2] [3]. Micro-sprinkler assembly discharge variations were examined to partition the contributions from spaghetti tubing and emitter. The coefficients of variation (CV) of the emitter alone were found to be excellent (less than 2%) for the two models tested. Variations in 0.61 m lengths of spaghetti tubing ranged from 2% to 7.6%. Micro jets (classified as non-pressure compensating) were evaluated by Singh et.al. [4] for the non-pressure–discharge relationship, emission uniformity, wetting diameter. These parameters were determined for pressures ranging from 0.5 to 1.7 kg/cm2 and stake heights of 0 to 10 cm. The emission uniformity was found to be more than 90%. They concluded that the wetting diameter increased with increase in operating pressure and stake height of micro jets. Manjunatha et.al. [5] reported testing of micro sprinklers at 0.5, 1.0, 1.5 and 2.5 kg/cm2 pressure and for four heights (20 cm, 35 cm, 50 cm, and 65 cm). The study was limited to single applicator (Non pressure compensated).
A methodology was discussed by James et.al.[6] for determination of optimum design parameters of a micro sprinkler or micro jet (Non pressure compensated). The independent parameter such as input pressure and stake height were varied and discharge, effective radius, average depth of water and the Coefficient of Uniformity of a single emitter were evaluated. The stake heights (risers) were kept at 0.4, 0.5, 0.6 and 0.7m and the experiments were conducted at 7.5, 10.0, 12.5 and 15.0 N/m2 pressure. Coefficient of uniformity of single emitter (CU) varied from 34.87 to 54.75 for the stake height of 0.30m, 38.81 to 58.25 at the stake height of 0.40 m, from 42.26 to 55.44 at the stake height of 0.50 m, from 53.07 to 67.01 at the stake height of 0.60 m and from 46.65 to 68.14 at the stake height of 0.70 m at different pressures.
Solomon et al. [7] and Solomon [8] reported on performance measures for distribution uniformity for water conservation potential of multi-stream, multi-trajectory rotating sprinklers for landscape irrigation. The concept of distribution uniformity (DU) and low quarter distribution uniformity (DULQ), previously introduced, was generalized. DULQ is the most frequently used version of DU, although others are possible. When the critical least watered area is taken as the low 50% (the low half), then DU becomes DULH. They introduced a generalized notation for distribution uniformity:
(1)
Where,
VLXX is the average of the low XX%, and Vavg is the overall average
DULQ = DUL25 and DULH = DUL50
Uniformity of Water Applications and Parameters for drippers
Christiansen coefficient of uniformity (CU) [9] for evaluating the uniformity of water application, particularly in sprinkler irrigation system is based on the sum of the absolute deviations of each observed value of discharge from their mean value as follows:
ISSN(Online): 2319-8753 ISSN (Print) : 2347-6710
I
nternational
J
ournal of
I
nnovative
R
esearch in
S
cience,
E
ngineering and
T
echnology
(An ISO 3297: 2007 Certified Organization)
Vol. 5, Issue 6, June 2016
Keller and Karmeli [12] suggested two coefficients, namely the emission uniformity coefficient (EU) and absolute emission uniformity coefficient (EUa) to define the uniformity of water application in a drip irrigation system. The coefficients are given by:
100
q
q
=
(%)
EU
a nx
(3) or
x a a ' n aq
q
q
q
50
=
EU
(4) Where,qn = minimum observed dripper flow rate, lph
q′n = observed dripper flow average of the lowest 1/4th of the drippers, lph qa = average dripper flow rate, lph
qx = average of highest observed 1/8th of dripper flow rates, lph
Emission uniformity (EU) has been generally used to describe the flow variation from emitting device. Distribution Uniformity (DU) indicates the degree to which the water is applied uniformly over the area and is determined by following relationship 100 caught water of depth Average caught depth quarter low Average = (%)
DU x (5)
Indian standards for drip irrigation and pressurized irrigation system components are IS 13487:1992, IS 13488:1992, IS 14805:1998, and IS 10799:1999. As per IS 14605:1998, micro sprayers shall bear the hydrostatic pressure of 1.2 times the maximum working pressure for a period of 1 hr without any damage, leakage and pull out from the assembly. Threaded connections shall withstand a torque of 20 Nm for metal to metal contact and 4 Nm for plastic to plastic or plastic to metal contact without showing any signs of damage. Upper and lower specification limits for uniformity of flow rate are ± 10% for regulated sprayers and ± 7% for non-regulated sprayers.
Veeresh et al.[13] discussed effect of pressure variation in micro sprinkler irrigation for a fixed stake height of 0.2m with pressures (H) of 1.0,1.2 , 1.1.4,1.6, 1.8, 2.0,2.2,and 2.6 kg/cm2 [13] and found the pressure discharge relationship of form Q= aHb for all the micro sprinklers under study.
Performance of rotating spray plate sprinklers were tested, evaluated and reported by Ahmed et al. [15] with five different types of spray nozzles, used on centre pivot irrigation system. Several outdoor single-sprinklers and overlapped – sprinklers irrigation tests were conducted for determining: water application rate, uniformity of water distribution, and application efficiency. The uniformity values were calculated by integrating each row of collector data to obtain an average rate for each row, and using these four values to evaluate [9], [10], [11] the "Christiansen Uniformity".
According to Sourell [16] the irrigation performance of rotating spray plate sprinkler, in different mobile irrigation machines, could be changed with the characteristics of the spray plate sprinklers, overlapping spacing, and machine speed. Kishore et al.[17] have reviewed and summarized various research works [18], [19] and [20]. Most reviews have [17] and [21] discussed research gaps which need scientific interventions for precision in irrigation water application using pressure compensated microsprinklers and held the need of performance evaluation of micro sprinklers at different heights at different pressures and overlapping, as well as to develop different overlapping and riser heights. Field evaluation of micro sprinklers for different crops is also needed for functional relationship between pressure and discharge at with the above variables to find the net impact on crop productivity.
ISSN(Online): 2319-8753 ISSN (Print) : 2347-6710
I
nternational
J
ournal of
I
nnovative
R
esearch in
S
cience,
E
ngineering and
T
echnology
(An ISO 3297: 2007 Certified Organization)
Vol. 5, Issue 6, June 2016
III.MATERIALANDMETHODS Experimental set up
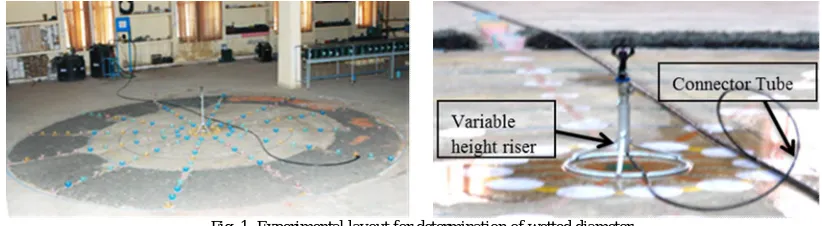
The set up for determination of individual discharge of the pressure compensated micro sprinklers consisted of four pressure compensated micro sprinklers (PCMS) of 40 lph discharge at 20 cm height and at 200 kPa, a micro tube of 1.60 m length, to join each PCMS with lateral of 16 mm diameter black HDPE pipe of more than 3000 mm length and one pressure gauge. In order to keep the pressure loss at the minimum in the pipeline of 32 mm size pipe was used. The other accessories in the set up included a 0.5 horsepower electrically operated pump; catch cans, and the hardware materials for efficient running of the network. The standard guidelines for the selection of collectors were observed: The collectors used were of equal size and uniform shape. The laboratory doors and windows were closed during the running of the experiments. A grid of 0.3 m was made in a clear area of 8m x 8m inside the testing lab. The PCMS were clamped to variable height riser stands. Lifting and lowering of the clamp varied the stake height of the emitter from the ground (Fig.1). The PCMS were placed at the predetermined distance (as per the overlap) from each other and catch cups were placed at the crossing points of the lines (nodes).
Fig. 1. Experimental layout for determination of wetted diameter
Observation procedures
Discharge was measured directly from the micro sprinkler nozzle without disturbing stake height and pressure by volume and time method and the average of three observations was taken as representative discharge at that inlet pressure and specified height. The maximum diameter of water throw was measured radially in all directions. The water was collected in each receptor (catch) after one hour of operation was measured with the help of a precision measuring cylinder. The distance after which the catch became less than 1mm was called effective radius.
A relationship was developed as under to compute the distances between successive PCMS for keeping them away from each other in a square configuration for desired overlap as per the pressure and stake height conditions. For the determined range (Dw) at each stake height and pressure, the distance between the micro sprinklers(Dm) was calculated for the overlaps of 30%, 40% and 50% using the relationship developed:
(6)
Where,
Dm = Distance between micro sprinklers, m Dw = Range, m
OL = Overlap, %
ISSN(Online): 2319-8753 ISSN (Print) : 2347-6710
I
nternational
J
ournal of
I
nnovative
R
esearch in
S
cience,
E
ngineering and
T
echnology
(An ISO 3297: 2007 Certified Organization)
Vol. 5, Issue 6, June 2016
suggested by Keller and Karmelli [12]. CU was calculated using the Christiansen [9] equation (Eq.2) for computing the uniformity coefficient.
IV. RESULTS AND DISCUSSION
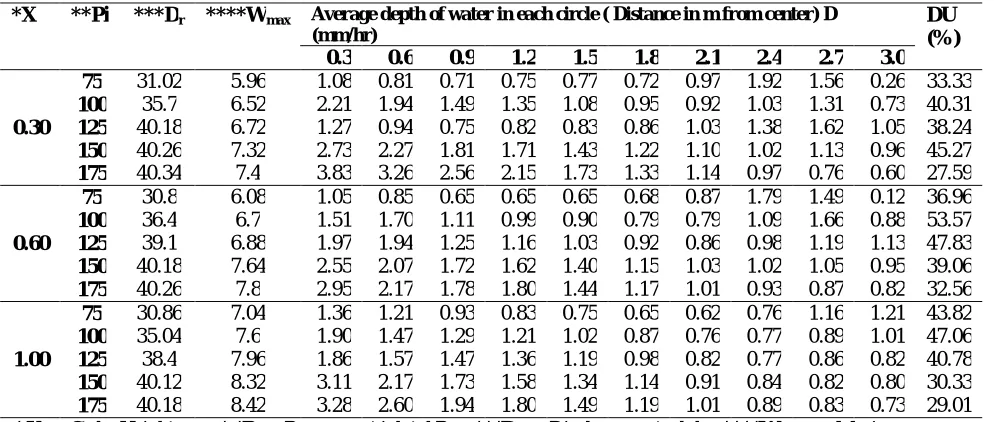
The values of parameters like discharge, effective radius, average depth of application and uniformity coefficient of water distribution corresponding to a particular stake height and net pressure for all the four emitters were tabulated, a sample of which is presented in Table.1
Wetted Diameter (Range)
For the stake height (X) of 0.3m the range increased (Y) from 6m to 7.4m with pressure (75 to 175 kPa). The range difference was only 0.10m between pressure of 175 and 150 kPa. A power trend was observed as below:
(7)
There was not much difference for the overlap of 50% in the distance between PCMS between pressures of 175 and 150 kPa (0.05m only). Similarly there was only a difference of 0.10m for the pressures of 125kPa and 100kPa. For the stake height of 0.6m the range increased with pressure (75 to 175 kPa) and showed a power trend
(8)
There was not much difference in the range between pressures of 150 and 175 kPa (0.16m only). There was a difference of 0.75m in the range between pressures of 150 and 125 kPa.
Table 1. Evaluation of hydraulic parameters of microsprinklers
*X **Pi ***Dr ****Wmax Average depth of water in each circle ( Distance in m from center) D
(mm/hr)
DU (%) 0.3 0.6 0.9 1.2 1.5 1.8 2.1 2.4 2.7 3.0
0.30
75 31.02 5.96 1.08 0.81 0.71 0.75 0.77 0.72 0.97 1.92 1.56 0.26 33.33
100 35.7 6.52 2.21 1.94 1.49 1.35 1.08 0.95 0.92 1.03 1.31 0.73 40.31
125 40.18 6.72 1.27 0.94 0.75 0.82 0.83 0.86 1.03 1.38 1.62 1.05 38.24
150 40.26 7.32 2.73 2.27 1.81 1.71 1.43 1.22 1.10 1.02 1.13 0.96 45.27
175 40.34 7.4 3.83 3.26 2.56 2.15 1.73 1.33 1.14 0.97 0.76 0.60 27.59
0.60
75 30.8 6.08 1.05 0.85 0.65 0.65 0.65 0.68 0.87 1.79 1.49 0.12 36.96
100 36.4 6.7 1.51 1.70 1.11 0.99 0.90 0.79 0.79 1.09 1.66 0.88 53.57
125 39.1 6.88 1.97 1.94 1.25 1.16 1.03 0.92 0.86 0.98 1.19 1.13 47.83
150 40.18 7.64 2.55 2.07 1.72 1.62 1.40 1.15 1.03 1.02 1.05 0.95 39.06
175 40.26 7.8 2.95 2.17 1.78 1.80 1.44 1.17 1.01 0.93 0.87 0.82 32.56
1.00
75 30.86 7.04 1.36 1.21 0.93 0.83 0.75 0.65 0.62 0.76 1.16 1.21 43.82
100 35.04 7.6 1.90 1.47 1.29 1.21 1.02 0.87 0.76 0.77 0.89 1.01 47.06
125 38.4 7.96 1.86 1.57 1.47 1.36 1.19 0.98 0.82 0.77 0.86 0.82 40.78
150 40.12 8.32 3.11 2.17 1.73 1.58 1.34 1.14 0.91 0.84 0.82 0.80 30.33
ISSN(Online): 2319-8753 ISSN (Print) : 2347-6710
I
nternational
J
ournal of
I
nnovative
R
esearch in
S
cience,
E
ngineering and
T
echnology
(An ISO 3297: 2007 Certified Organization)
Vol. 5, Issue 6, June 2016
Fig. 2. Wetted diameter at different stake heights and pressures
There was a little difference (0.18m) in the range between pressures of 125 and 100kPa. This resulted in similar distances for different overlaps for the pressures of 175 and 150 kPa at this stake height (0.60 m). Similarly the distances for the pressure setting of 125 and 100 kPa are very close to each other for each of the corresponding overlap.
For the stake height of 1.0m the range increased from 7.0 m to 8.3 m with pressure (75 to 175 kPa). The range difference was only 0.10m between pressure of 175 and 150 kPa. A power trend was observed as below
(9)
All the relations were of the form Y=aXb . The value of R2 for the three equations remained in the range of 0.96 to 0.98. It was highest for the stake height of 1.0 m and lowest for the stake height of 0.6 m.
Discharge rate
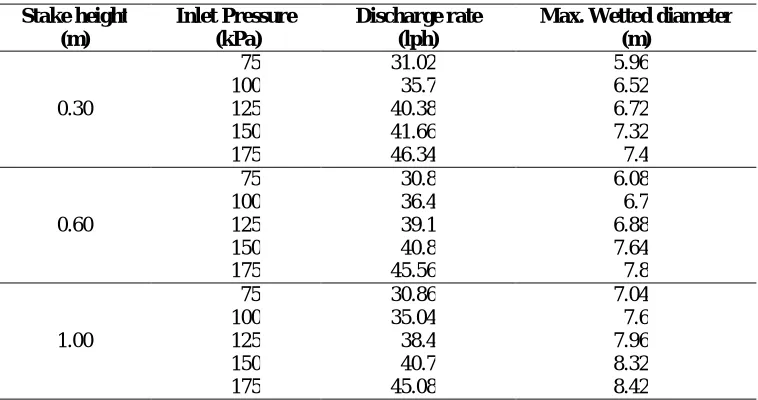
The discharge rate of the micro-sprinkler increased with the pressure but decreased with the increase in the stake height (Table 2). The discharge rates were quite close to each other (Fig. 3).
Table 2. Effect of pressure and stake height on wetted diameter and discharge
Stake height (m)
Inlet Pressure (kPa)
Discharge rate (lph)
Max. Wetted diameter (m)
0.30
75 31.02 5.96
100 35.7 6.52
125 40.38 6.72
150 41.66 7.32
175 46.34 7.4
0.60
75 30.8 6.08
100 36.4 6.7
125 39.1 6.88
150 40.8 7.64
175 45.56 7.8
1.00
75 30.86 7.04
100 35.04 7.6
125 38.4 7.96
150 40.7 8.32
ISSN(Online): 2319-8753 ISSN (Print) : 2347-6710
I
nternational
J
ournal of
I
nnovative
R
esearch in
S
cience,
E
ngineering and
T
echnology
(An ISO 3297: 2007 Certified Organization)
Vol. 5, Issue 6, June 2016
Fig 3. Pressure vs discharge
The DU varied between 70.3 to 83.1% for pressure 150 kPa and for all degree of overlaps, indicating the critical pressure of 100kPa with 50% overlap, below this overlap of 50% the values of DU were below 70% and the system cannot be designed at this configuration.
It is evident that at the pressure of 200 kPa and at the 30 percent overlap the values of DU are above 70 percent and therefore approximately 20 percent more area (difference between the degree of overlap being 20%) can be effectively irrigated if the crop water requirement is approximately 3 mm/h. This system with 30% will also work with a DU of above 70% even if the pressure during operations drops up to 150 kPa. From Fig. 4, discharge (lph) can be predicted for pressure (kPa) as per equation given below. The results were in agreement with similar studies but conducted with drip irrigation [10], [11] and [20].
(10)
Where, P is pressure in kPa. The R2 value as 0.98 is very good. For validating the above equation, the data for pressure of 175 kPa as under was used
Measured discharge = 41.4 lph Expected discharge = 40.7 lph
Distribution Uniformity
Based on the relationships discussed earlier the values for distribution uniformity (DU) were computed Distribution uniformity started reducing after a distance of 2.7m from the center (Fig.4) for the stake heights of 0.6m and 1.0m.
(a) (b) (c)
Fig. 4. Distribution uniformity at different heights in the wetting zone
The estimated value is well within the proximity (1.69% ) of the observed value. For the pressure of 200kPa, the DU varied for overlaps in the polynomial form of second order as below for DU :
ISSN(Online): 2319-8753 ISSN (Print) : 2347-6710
I
nternational
J
ournal of
I
nnovative
R
esearch in
S
cience,
E
ngineering and
T
echnology
(An ISO 3297: 2007 Certified Organization)
Vol. 5, Issue 6, June 2016
The value of R2 is very close to “1” which shows that the relationships are very good.
For the pressure of 150 kPa For the pressure of 150 kPa the trend for DU was in the form of polynomial of second order (Fig.4) with the value of R2 very close to “1”.
(12)
At the pressure of 100 kPa, the trend for DU was in the form of polynomial of second order with the value of R2 being close to “1” (Fig. 4)
(13)
The distribution uniformity for all the overlaps at different pressures was of the polynomial y= ax2- bx + c
Table 4.Relationships for determining distribution uniformity at different overlaps Pressure, kPa Equation for DU
200 y = 0.0155x2 -0.655x+ 77.1 150 y = 0.042x2 - 2.88x + 118.9 +100 y = 0.064x2 - 4.43x + 139.1 Remark Here “ x “is overlap in % and “y” is DU %
V. CONCLUSION
The variation in wetted diameter as a function of pressure is in power polynomial form of Y = aXb, the value of ‘a’ ranges between 1.673 to 2.783 whereas the factor of power ‘b’ remains quite close to each other (from 0.216 to 0.298).
It indicates that if a system is designed for 1.0m height and with a distance of 3.9m between successive PCMS, for 50 percent overlap it may function well (+ 10%) for the pressure range of 75 to 175 kPa. For the overlaps of 40 percent and with a distance of 4.9m between successive PCMS, it may operate well between pressure range of 125 to 175 kPa. A similar optimum distance between successive PCMS for the overlap of 30 percent could be 5.4m. If the pressure is not expected to drop below 125kPa than the optimum distance between successive PCMS will be 5.7m.
In terms of effect on design of the system this means that a system designed and laid in a square configuration field for pressure of 175 kPa, overlap of 50% and stake height of 0.6 m will not require any change in physical setting of field placements if the pressure drops to 150 kPa. Even if pressure drops to 100 kPa it will perform as if there was an overlapping of 40 percent. Thus operation time of the system is only to be increased to give the desired application of water as per pressure-discharge relationship. The conclusions are summarized as below:
1. The discharge rate of the PCMS decreased with the pressure decrease. The relationship showed a polynomial of second order trend with R2 value of 0.98.
2. Distribution uniformity varied with the decrease in the pressure and also with the decrease in the overlap. The trend for each pressure was polynomial. The value remained above 70% for combinations till 150 kPa pressure. However it was below recommended or acceptable value of 70% for pressure of 100kPa and below overlaps of 50%.
3. The maximum distribution uniformity (DU) of 83.1percent occurred at the pressure of 200 kPa and overlap of 50%; and the maximum CU of 90.2% was also at the pressure of 200kPa and 50% overlap.
ISSN(Online): 2319-8753 ISSN (Print) : 2347-6710
I
nternational
J
ournal of
I
nnovative
R
esearch in
S
cience,
E
ngineering and
T
echnology
(An ISO 3297: 2007 Certified Organization)
Vol. 5, Issue 6, June 2016
VI.ACKNOWLEDGEMENTS
Authors acknowledge the valuable suggestions given by Dr. Nawab Ali, Ex Director, and Dr. CK Saxena, Senior Scientist, Central Institute of Agricultural Engineering Bhopal and Dr KS Reddy, Principal Scientist, Central Institute of Dryland Agriculture, Hyderabad.
REFERENCES
[1] Bisconer I. 2011. Benefits of Using Pressure Compensating (PC) Micro-Irrigation Emission Devices. American Society of Agricultural and Biological Engineers, St. Joseph, Michigan. August 7-10, 2011
[2] Boman BJ. 1988. Distribution pattern of micro sprinkler and spray emitter. Applied Agric., 5(1): 50-56.
[3] Boman BJ.1989. Emitters and spaghetti tubing effects on micro sprinkler flow uniformity. Transactions of American Society of Agricultural Engineers. 32(1): 168-172.
[4] Singh RV, Kale MU, and Chandra A. 2001. Performance evaluation of micro jets. In: Microirrigation ed. Singh HP, Kaushish SP, Kumar A, Murthy TS, Samuel JC. Central Board of Irrigation and Power. New Delhi. p. 155- 162.
[5] Manjunatha MV, Shukla K.N, Chauhan HS and Singh S. 2005. Distribution patterns of various micro sprinklers. Proc. National Conference on Micro irrigation, GB Pant University of Agriculture and Technology, Pantnagar. June 3-5.
[6] James BK., Mal BC. and Tiwari KN. 2006. A method for determination of optimum design parameters of a micro sprinkler or micro jet. Proceedings of the Annual Convention of the ISAE. Coimbatore . Jan 19-21. pp: 1-12.
[7] Solomon KH, Kissinger JA, Farrens GP, and Bornemann J. 2007. Performance and water conservation potential of multi stream, multi trajectory rotating sprinkler for landscape irrigation. Applied Engineering in Agriculture, 23(2): pp. 153-163.
[8] Solomon KH. 1984. Yield related Interpretations of irrigation uniformity and efficiency measures. Irrigation Science (5) : 161-172,.
[9] Christiansen JE. 1942. Irrigation by sprinkling, California Agricultural Experiment Station. Bulletin 670, University of California, Berkley, USA. 124 p.
[10] Saxena, C.K., Gupta, S.K. 2006. Uniformity of water application under drip irrigation in litchi plantation and impact of pH on its growth in partially reclaimed alkali soil. Journal of Agricultural Engineering, Indian Society of Agricultural Engineering. 43(3): 1-9.
[11] Saxena, C.K., Gupta, S.K. 2006. Effect of soil pH on the establishment of litchi (Litchi chinensis Sonn.) plants in an alkali environment. Indian journal of Agricultural Sciences. 76 (9): 547-549.
[12] Keller T, and Karmelli D. 1974. Trickle irrigation design parameters, Trans. ASAE 17(4) : 678-684.
[13] Veeresh JM, RajeshKumar NK, and Raghvendra K. 2013. Effect of pressure variation in micro sprinkler irrigation. Research Journal of Agricultural Sciences, 4(2) : 215-217.
[14] Shendag AS and Gadge SB. 2011. Hydraulic studies of different microsprinklers, Indian Journal of Agricultural Engineering. 4(1): 73-76. [15] Ahmed MAM, Awaad MA, El-Ansary MY, and El-Haddad ZA. 2010. Performance of rotating spray plate sprinklers. Misr J. Ag. Engineering,
27 (2) : 565 – 585.
[16] Sourell H, Faci J, and Payan E. 2003. Performance of rotating spray plate sprinkler in indoor experiments. J. of Irrigation and Drain. Engg. ASCE. 129(5): 376-380.
[17] Kishore R, Gahlot VK, and Saxena CK . 2016. Pressure Compensated Micro Sprinklers: A Review. International Journal of Engineering Research & Technology. 5(1) : 237-242 .
[18] Saxena, C.K., Gupta, S.K., Purohit, R.C., and Bhakar, S.R.. 2015. Salt water dynamics under point source of drip irrigation. Indian Journal of Agricultural Research. 19(2): 101-113.
[19] Saxena, C.K., Gupta, S.K., Purohit, R.C., Bhakar, S.R. and Upadhyay, B. 2013. Performance of Okra under Drip Irrigation with Saline Water. ISAE. Journal of Agricultural Engineering. 50 (4): 72-75.
[20] Pandey, R.S., Batra, L., Qadar, A., Saxena, C.K., Gupta, S.K., Joshi, P.K.and Singh G.B. 2010. Emitters and filters performance for sewage water reuse with drip irrigation. Journal of Soil Salinity and Water Quality. 2(2): 91-94.