Fiber Optics Evanescent Wave Sensor
Rohit Chachlani 1, Manisha Chhattopadhay 2
M.E. Student, Department of Electronics & Telecommunication, Vivekanand Education Society’s Institute of Technology, Chembur, Mumbai, India1
AssociateProfessor, Department of Electronics & Telecommunication, Vivekanand Education Society’s Institute of Technology, Chembur, Mumbai, India2
ABSTRACT: Fiber optics sensor technology is use to measure different parameters such as strain, pressure, temperature, to detect a large number of toxic substances and other chemical constituents in sea, water and air, detection of various diseases and many more. This report describes the study and design of evanescent wave absorption field sensor and its application of detection of nitrate concentration in water.
KEYWORDS: Fiber optic sensor, Intrinsic Sensor, Application Based Sensors, Evanescent Wave, Evanescent wave for Sensing Application, Evanescent Absorption Coefficient, sensitivity of evanescent sensor, Simplest Evanescent Field Absorption Sensor, Experiment Set Up Details For Measuring The Nitrite Concentration In Water, Graph of absorption coefficient with concentration for different lengths, Power detected, sensitivity of sensor.
I. INTRODUCTION
Over the past many years, the world has benefited to a great extent from the development of electronic technology and sensors. But electronics have several limitations in terms of maximum speed of function, security and environmental limitations on performance.
Due to the various advantages of optical transmission as compared to electrical transmission, there are a lot of inventions done in the field of fiber optics and fiber optic systems. In today’s world, high data rate plays an important role for data transmission. Optical fiber provides very large bandwidth giving rise to very high data date.
Initially the main difficulty in development of sensors was the cost of components used in optical source and detectors, but as time advances, due to very high demand of optical technology, components price came down and improvement in optical technology started taking place. It is expected that in the future all conventional devices will be replaced by optical fiber sensor for the measurement of various physical, chemical and biological parameters such as rotational, acceleration, electric and magnetic fields, temperature, pressure, acoustics, vibration, position, strain, humidity, viscosity, pH, glucose, heavy metals, gases, viral, infection, pollutants, etc. Optical fiber sensor technology is fast growing technology. Monitoring and data transmission using fiber optical sensors and optical fiber in cabling is now common place in various applications.
There are various advantages provided by fiber optical communication such as low power loss, small size, light weight, data security and multiplexing, flexibility, robust to environment, etc.
A lot of research work has been done in the field of optical technology which focuses on design of optical fiber. Designing a sensing system based on fiber optics and fiber optical sensor is one of the fields.
II. OBJECTIVE
When an electromagnetic wave (light) in a dielectric medium of refractive index n1 is incident on the boundary
between the optically denser medium (n1) and optically rarer medium (n2) at an angle (θ) greater than critical angle, θc
= sin , total internal reflection occurs and hence the beam is totally reflected back into denser medium.
Here, the incident light is not reflected instantaneously when it reaches the boundary but superposition of the incident and reflected beams results in the formation of a standing electromagnetic wave.
Fig. 1. Evanescent wave at an interface of two media [1]
Amplitude of electric field is maximum at the interface and decays exponentially in the outward direction of rarer medium. This decaying field is called evanescent field.
Evanescent field absorption spectroscopy is a powerful well-established laboratory technique for chemical analysis for detection of nitrite, ammonia traces in water. There are two approaches which have been adopted in these sensors. In one of the approach, if the wavelength of the light propagating coincides with the absorption band of analyte, then the evanescent wave can interact directly with the analyte. Sensors using such approach are called direct spectroscopic evanescent wave sensors. In the other approach, an intermediate reagent which responds optically to the analyte is attached to the core of the fiber. Sensors using such approach are called reagent-mediated evanescent wave sensors. In my project, I am using the first approach in which one of the media is waveguide having a thin cylindrical non absorbing crystal and other medium is the absorbing sample under study of lower refractive index. The degree of absorption depends on the amplitude of the evanescent field in the sample medium and the number of reflections within the waveguide.
Design of evanescent field absorption based sensor devices requires knowledge about certain parameters such as penetration depth (dp), total power in the fiber, bulk absorption coefficient etc. These design parameters play a crucial role in determining the sensitivity, absorption coefficient, power in cladding etc. of fiber optic sensors.
decrease. This is the basis of the Fiber Optics Evanescent wave Sensor. If Po is the power detected by detector in the absence of an absorbing fluid then the power detected in its presence is given by,
P = Po exp(-γL) ………(1)
Where L is the length of the unclad portion of the fiber and γ is the evanescent absorption coefficient of the
fluid which can be written as,
γ = NT ….………(2)
where N is the number of ray reflections per unit length of the fiber and T is the Fresnel transmission coefficient of the light at the interface of a loss-less core and lossy cladding. Final expression of evanescent absorption coefficient obtained is,
γ( )= .
…………(3) The above equation gives the value of evanescent absorption coefficient for different values of angle of incidence of the ray incident at the end face of the fiber. The evanescent wave absorption sensors are typically used to monitor the concentration of an absorbing fluid. In such sensors, the fractional change in the output power per unit change in concentration of the fluid determines the sensitivity of the sensor. Sensitivity can be written as,
S = − . ………(4)
Where P is the power transmitted by the fiber, c is concentration of fluid. Final expression of sensitivity is,
∴ S = Lε + β ………(5)
IV. APPLICATION OF SENSOR
Simplest evanescent field absorption sensor used for measurement of different concentration in water is shown in fig 5.1. Light source such as He - Ne laser is focused on one side of PCS fiber using microscopic objective. For guiding all the rays to propagate in the fiber, numerical aperture of objective is chosen to be greater than numerical aperture of fiber. For a sensor, the silica cladding is removed from middle portion of the fiber and it is called as sensing region, hence it is kept in a glass cell having facilities for filling and draining of the absorption fluid. The other end of the fiber is connected to detector (power meter) for measuring the output power.
Powers are measured when the glass cell is filled initially with solvent (Po) and then with absorption fluid (P), both the measurements are done separately. These powers along the length of the unclad portion of the fiber are used to calculate the evanescent absorption coefficient from equation 1.
When the fiber is immersed in the test solution, the evanescent field from the unclad region penetrates into the liquid and interacts with it. Since the wavelength of light passing through the fiber is almost close to the peak absorption wavelength of the solution, strong evanescent wave absorption occurs and it increases with the increase in nitrite concentration.
V. RESULT
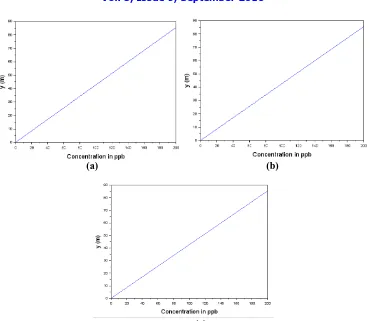
(a) (b)
(c)
Fig. 2. Graph of variation of absorption coefficient with respect to concentration from 0 to 200 parts per billion (ppb) for length (a) 20 cm, (b) 10 cm, (c) 5 cm.
VI. CONCLUSION
For a particular wavelength and angle of incidence, absorption coefficient (γ) is directly proportional to the
concentration that is, as concentration increases, γ also increases. γ is not dependent on length of unclad portion of fiber that is, for length of 5 cm, 10 cm and 20 cm, graph of γ with concentration remains the same.
Also, sensitivity of fiber is directly proportional to unclad portion of fiber, for a particular concentration and
bulk absorption coefficient (α), as wavelength increases, sensitivity also increases.
REFERENCES
BOOK,
[10] Udd, E., Fiber Optic Smart Structures, Proceedings of IEEE, vol. 84, no. 6, 884−894, 1996.
[11] shodhganga.inflibnet.ac.in/bitstream/10603/1966/.../06_chapter%201.pdf
[12] Yu, F. T. S., and Shizhuo, Y., Fiber Optic Sensors, Marcel Decker, Inc., Newyork, 2002.
[13] El-Sherif, M. A., Smart structures and intelligent systems for health monitoring and diagnostics, ABBI, vol. 2, no. 3-4, 161-170, 2005. [14] shodhganga.inflibnet.ac.in/bitstream/10603/1966/.../07_chapter%202.pdf
[15] G. Keiser, Optical Fiber Communications (ll Ed.) Mc-Graw Hill, Boston (2000). [16] J. M. Senior Optical Fiber Communications (ll Ed.) Prentice Hall India, New Delhi (2001) [17] B.D. Gupta, Chandra Deep Singh and Anurag Sharma, Optical Engineering, 33,1864 (1994).
[18] Suresh Kumar, C. P. G. Vallabhan, V. P. N. Nampoori, V N Sivasankara PilIai and P. Radhakrishnan, Journal of optics A: Pure and Applied Optic, Vo14, 247 (2002)
[19] B. D. Guptha and S.K. Khijwania, Fiber and integrated Optics, 17, 63(1998).
[20] Ramesh B. Malla, Alman sen and Norman W. Garrick, “A special fiber sensor for measuring wheel loads of vehicles on Highway”, Sensors 2008,8,pp. 2551-2568, ISSN 1424-8220.
[21] Shivang Ghetia, Ruchi Gajjar, Pujal Trivedi, “Classification of Fiber Optical sensors, IJECCT, Volume 3 issue 4 (2013).
[22] Pickering W F 1997 Monitoring of water quality Pollution Evaluation—the Quantitative Aspects (Environmental Science and Technology
Series vol 2) (New York: Dekker) pp 113–15 ch 5
WEBSITES,
[23] http://www.ni.com/white-paper/11821/en/
[24] http://www.iosrjen.org/Papers/vol4_issue2%20%28part-4%29/G04243743.pdf
[25] https://minerva-access.unimelb.edu.au/bitstream/handle/11343/35118/112189_Christopher%20Honig%20-%20Thesis.pdf?sequence=1
[26] http://spie.org/x8577.xml
[27] http://photonics.cusat.edu/Research_Fiber%20Sensors.html
[28] http://www.elprocus.com/diffrent-types-of-fiber-optic-sensors/
[29] http://www.rp-photonics.com/fiber_optic_sensors.html
[30] http://www.mdpi.com/1424-8220/13/7/8640/html