Multiple Discriminant Analysis
and Neural-Network-Based Monolith
and Partition Fault-Detection Schemes
for Broken Rotor Bar in Induction Motors
Bulent Ayhan,
Student Member, IEEE,
Mo-Yuen Chow,
Senior Member, IEEE,
and Myung-Hyun Song,
Member, IEEE
Abstract—Broken rotor bars in induction motors can be de-tected by monitoring any abnormality of the spectrum amplitudes at certain frequencies in the motor-current spectrum. It has been shown that these broken-rotor-bar specific frequencies are located around the fundamental stator current frequency and are termed lower and upper sideband components. Broken-rotor-bar fault-detection schemes should rely on multiple signatures in order to overcome or reduce the effect of any misinterpretation of the signatures that are obscured by factors such as measure-ment noises and different load conditions. Multiple discriminant analysis (MDA) and artificial neural networks (ANNs) provide appropriate environments to develop such fault-detection schemes because of their multiinput-processing capabilities. This paper describes two fault-detection schemes for a broken-rotor-bar fault detection with a multiple signature processing and demonstrates that the multiple signature processing is more efficient than a single signature processing. The first scheme, which will be named the “monolith scheme,” is based on a single large-scale MDA or ANN unit representing the complete operating load-torque region of the motor, while the second scheme, which will be named the “partition scheme,” consists of many small-scale MDA or ANN units, each unit representing a particular load-torque operat-ing region. Fault-detection performance comparison between the MDA and the ANN with respect to the two schemes is inves-tigated using the experimental data collected for a healthy and a broken-rotor-bar case. Partition scheme distributes the com-putational load and complexity of the large-scale single units in a monolith scheme to many smaller units, which results in the increase of the broken-rotor-bar fault-detection performance, as is confirmed with the experimental results.
Index Terms—Artificial neural networks (ANNs), broken rotor bar, discriminant analysis, fault diagnosis, induction motors.
I. INTRODUCTION
I
NDUCTION motors have dominated the field of electro-mechanical energy conversion, being 80% of the motorsManuscript received October 14, 2003; revised June 26, 2005. Abstract published on the Internet May 18, 2006.
B. Ayhan is with the Advanced Diagnosis Automation and Control (ADAC) Laboratory, North Carolina State University, Raleigh, NC 27695 USA.
M.-Y. Chow is with the Department of Electrical and Computer Engineering, North Carolina State University, Raleigh, NC 27695 USA (e-mail: chow@ ncsu.edu).
M.-H. Song is with the School of Information and Communication, Sunchon National University, Sunchon 540-742, Korea.
Digital Object Identifier 10.1109/TIE.2006.878301
in use [1], [2]. The applications of the induction motors are widespread. Some induction motors are the key elements in assuring the continuity of the process and production chains of many industries. A majority of the induction motors are used in electric-utility industries, mining industries, petrochemical industries, and domestic appliances industries. The list of the industries and applications that the induction motors take place in is rather long. Induction motors are also often used in critical applications such as nuclear plants, aerospace, and military applications, where the reliability must be of high standards.
The failure of induction motors can result in a total loss of the machine itself in addition to a likely costly downtime of the whole plant. More importantly, these failures may even result in the loss of lives, which cannot be tolerated. Thus, health-monitoring techniques to prevent the induction-motor failures are of great concern in the industry and are gaining an increasing attention [3]–[7].
Induction motors often operate in hostile environments such as corrosive and dusty places. They are also exposed to a variety of undesirable conditions and situations such as misoperations. These unwanted conditions can cause the induction motor to go into a premature failure period, which may result in an unserviceable condition of the motor if not detected at its early stages of the failure period. The early detection of the incipient motor fault is thus of great concern. Rotor failures are among these failures, and they now account for 5–10% of the total induction-motor failures [8]. Since 1980, the broken-rotor-bar fault-detection problem has created a substantial interest among researchers [9], [10]. Several monitoring techniques have been developed, most of which are based on a motor-current signature analysis (MCSA) [11]. In recent years, several advanced signal-processing techniques such as the high-resolution spectral analysis, higher order statistics, and wavelet analysis have been applied to the broken rotor bar and other motor fault-detection problems [2], [10], [12], [13].
MCSA techniques include parametric and nonparametric spectrum-analysis methods of the motor current in general. In the parametric methods, autoregressive models have been fitted with the time series of the signal, and model parameters have been used in order to compute the frequency spectrum. Nonparametric methods, on the other hand, are based on a Fourier transform and search for periodicities of the signal.
Power-spectral-density (PSD) analysis of the motor current is one of the widely used MCSA techniques. There are several approaches to calculate the PSD. The periodogram method and Welch’s periodogram methods are two of the nonparametric spectrum methods used in the broken-rotor-bar fault detec-tion [14].
Broken-rotor-bar fault in the induction motors can be de-tected by monitoring any abnormality of the motor-current power spectrum amplitudes at several certain frequency compo-nents. These frequency components are located around the main frequency line and are determined according to the number of poles and mechanical speed of the motor. However, there are other effects that may obscure the detection of the broken-rotor-bar fault or cause false alarms. For example, these effects can be intrinsic manufacturing dissymmetry [15], or load-torque oscillation that can produce the stator currents with the frequency values the same as the monitored frequencies. In monitoring these frequency components, it is assumed that the load torque is constant. Any variation of the load torque with the rotational speed can produce frequency harmonics, which may overlap the harmonics caused by the broken-rotor-bar fault [16]. A broken-broken-rotor-bar fault-detection scheme based on the multiple frequency signatures thus should be more reliable in overcoming or reducing the effect of the misinterpreted signatures, which are caused by the effects discussed formerly or some other unknown reasons. Multiple discriminant analysis (MDA) and artificial neural networks (ANNs) provide appropriate environments to develop such fault-detection schemes because of their multiinput-processing capabilities.
This paper presents two fault-detection schemes for the broken-rotor-bar fault detection with the multiple signa-ture processing and demonstrates that the multiple signasigna-ture processing is more effective than the single signature process-ing. The first scheme will be named the “monolith scheme,” and it is based on a single MDA or a single ANN unit repre-senting the complete motor-operating load-torque region. The second scheme will be named the “partition scheme,” and it consists of several small MDA or ANN units, each of which is representing a particular load-torque operating region. In the partition scheme, the computational load and the complexity of the single units in the monolith scheme are distributed to smaller units, which as a result, increase the broken-rotor-bar fault-detection performance. The partition scheme thus can be thought of as partitioning a highly nonlinear mapping problem in a high-dimensional space into linear or low-order nonlinear mapping problems in a reduced dimensional space. The two detection schemes have been investigated using the experimental data with the MDA and ANN detection units, respectively.
This paper is organized as follows. Section II discusses the frequencies of interest to the broken-rotor-bar problem and outlines the frequencies to be used in the MDA and ANN units. Section III briefly describes the fundamental properties of the MDA and ANN. Section IV presents the experiment setup and motor-data specifications. Section V outlines the fault-detection schemes together with the experimental results and analysis. Section VI concludes with the findings of this paper.
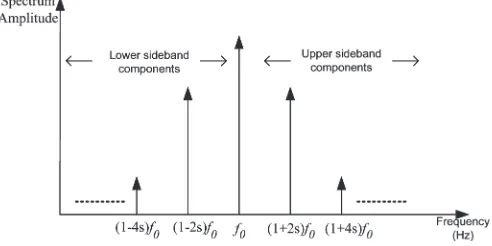
Fig. 1. Sideband frequencies around the fundamental line frequency.
II. MOTORCURRENTSPECTRALCOMPONENTS FORBROKENROTORBAR
Kliman, Thomson and Stewart, Filipetti, and Elkasabgyet al.
[17]–[20] used the MCSA methods to detect broken-rotor-bar faults by investigating the sideband components around the supplied current fundamental frequency (i.e., the line fre-quency)f0
fb = (1±2s)f0 (1)
where fb are the sideband frequencies associated with the broken rotor bar, s is the per unit motor slip. The slip s is defined as the relative mechanical speed of the motor,nm, with respect to the motor synchronous speednsas
s=ns−n nm
s . (2)
The motor synchronous speed, ns, is related to the line fre-quencyf0as
ns=120Pf0 (3)
whereP is the number of poles of the motor, and the constant “120” is used to express the motor synchronous speed ns in revolutions per minute (r/min) unit.
The broken bars also give rise to a sequence of the other sidebands given by [19]
fb= (1±2ks)f0, k= 1,2, . . . , kn wherefb>0∀k
(4)
and is depicted conceptually in Fig. 1.
Fig. 1 shows the frequency components specific to the broken-rotor-bar fault, which is given in (4) for k= 1 and2. These frequencies are located around the fundamental line frequency and are termed as the lower sideband and upper sideband components as indicated in Fig. 1. There are other spectral components that can be observed in the stator line current due to the broken-rotor-bar fault [17]
fb=
k p
(1−s)±s
f0, wherek/p= 1,3,5, . . . . (5)
correspond to the power spectrum amplitudes of the motor-current (phase-a) data at the selected frequencies. A detailed explanation about the experiment setup and specifications of the collected motor data will be given in Section IV. We use Welch’s periodogram method to compute the power spectrum of the phase-a motor-current data. In Welch’s periodogram method, we apply a Hanning window and 50% overlapping percentage among the partitioned segments. It has been noted that the use of a Hanning window and 50% overlap leads to an efficient implementation of the Fast Fourier Transform (FFT) algorithm [21]. In the fault-detection schemes, we con-sider four of the broken-rotor-bar fault specific frequency com-ponents. Suppose F={f1−, f1+, f2−, f2+} is the set of the
broken-rotor-bar fault specific frequency components, andP= {p1−, p1+, p2−, p2+}is the set of power spectrum amplitudes
at these frequencies. The frequency components in setFare: f1− = (1−2s)f0, f1+ = (1 + 2s)f0, f2−= (1−4s)f0, and f2+= (1 + 4s)f0, wheref0is the fundamental stator current
frequency and s is the slip. f1− and f1+ are the first lower
and upper sidebands, whilef2− andf2+ are the second lower
and upper sidebands around f0, which are expressed mathe-matically in (4). The inputs for the MDA and ANN units in the monolith and partition schemes consist of the signature set: {p1−, p1+, p2−, p2+}and will be discussed in Section V.
III. DETECTIONMETHODOLOGIES FOR
BROKEN-ROTOR-BARFAULT
In this section, we will briefly describe the fundamental properties of the MDA and ANN, which are used as two detection methodologies in the fault-detection schemes.
A. MDA
MDA considers the problem of assigning individuals to cer-tain groups that have been identified beforehand. The objective in the MDA is thus, to find a set of linear combinations of the variables whose values are as close as possible within groups and as far apart as possible between groups [22]. LetX= [xij] be the data matrix withm rows and n columns, where each row stands for the observations, and each column stands for the variables. The meanxjof variablejcan be expressed as
xj= m1 m
i=1
xij. (6)
Suppose that themrows ofXare separated intoqgroups, and each group is defined by a setIkofmkvalues of indexi, where the relation betweenmkandmis expressed as
q
k=1
mk =m. (7)
Letxkj be the mean variablej in group k; xkj can then be expressed as
xkj= m1 k
i∈Ik
xij. (8)
The meanxjof variablejcan be expressed as
xj= q
k=1 mk
mxkj. (9)
The total covariance between two variables can be described in two different ways, which are expressed as
cov(j, j) = 1 m
m
i=1
(xij−xj)(xij−xj) (10)
cov(j, j) = 1 m q k=1
i∈Ik
(xij−xj)(xij−xj)
. (11)
The total covariance can be decomposed into two parts: one of the two parts stands for the within-group variances, and the other part stands for the between-group variances. This decomposition is known as Huyghens decomposition formula [22] and is expressed as
cov(j, j) = 1 m q k=1
i∈Ik
(xij−xkj)(xij−xkj)
+ q k=1 mk
m(xkj−xj)(xkj−xj). (12)
Equation (12) can be interpreted as the sum of the covariance within the groups (first term) and the covariance between the groups (second term) and is expressed in a matrix form as
T=W+B (13)
where Tdenotes the total covariance,Wdenotes the covari-ance within the groups, andBdenotes the covariance between the groups.
In order to define the problem addressed by the MDA,a(i) is introduced, where a(i)corresponds to the value of a linear combination of thencentered variables for individuali.
a(i) =n
j=1
aj(xij−xj). (14)
The variancevar(a), whereais the vector composed of com-ponentsa1, . . . , an, can be expressed as
var(a) =m1
m
i=1
a2(i) = 1 m
m
i=1
n
j=1
aj(xij−xj)
2 . (15)
By expanding (15),var(a)can be written in the form depicted as [22]
var(a) = 1 m m i=1 n j=1 n
j=1
ajaj(xij−xj). (16)
then be separated into within variance and between variance as:aTTa=aTWa+aTBa. The objective of MDA is to find a linear combination of the variables that have a maximum be-tween groups variance and a minimum within groups variance. The aim is to find a such that aTBa/aTWa is maximum. This linear combination is termed as the linear discriminant function. The process to find the linear discriminant function is well described in the literature, and readers can refer to [22] and [23] for further information.
MDA, for the two-class problem with the linear discriminant function, is widely used and is known as the linear discriminant analysis (LDA). In addition, there are MDA methods with nonlinear discriminant functions for problems with nonlinear classification boundaries [24].
B. ANN
ANNs have been extensively used in mimicking and au-tomating the human expertise and experts’ knowledge in many engineering fields like the fault detection and diagnosis, control, and robotics [1], [4]–[7], [19], [25]. They have been widely ap-plied in a system identification and modeling complex nonlin-ear systems, where obtaining a mathematical model is arduous and not easy. This extensive use and interest in ANNs results from the capability of ANNs in learning the input–output mapping of a system [25].
To have a better understanding of how the neural net-works learn from the experts’ knowledge, it is convenient to have some background knowledge about the structure of the neural network and the corresponding training method-ology. In this study, we use a three-layered feedforward neural network and Levenberg–Marquardt algorithm (LM) as the training method. In this section, a brief information will be given about the feedforward structure of the neural net-works and training algorithms with the emphasis on the LM algorithm.
The simplest multilayer feedforward neural network is com-posed of three layers: input, hidden, and output [25]. In each network layer, there are processing units called nodes or neu-rons. Every node in a neural-network layer sends its output to all the nodes in the next layer. The input layer in the neural network acts as an interface, which takes the information from the outside world and transmits it to the internal processing units of the network. Each node in the hidden and output layer receives signals from the nodes of the previous layer, scaled by the weights,wj = [wj1, wj2, . . . , wjk]T. The output of thejth node in layerl,oj, forj= 1,2, . . . , kcan be found from the quantity expressed as
oj=f
k
i=1
wjivi+bj
=fwT
j v+bj (17)
wherebj is the bias of thejthneuron, andf is the activation function. The activation function can be any function that is monotonically increasing and differentiable. The sigmoid func-tion is perhaps the most popular activafunc-tion funcfunc-tion because
of its similarity to the behavioral property of many biological neurons. The sigmoid function can be expressed as
oj= 1
1 + e−(wTjv+bj)
. (18)
The network training process can be thought of as rendering the network to learn the mapping through the given input– output relation of the system by adjusting the network in-ternal parameters or the so-called weights, w. Let a system have inputs u= [u1, u2, . . . , un]T and outputs y(u) = [y1, y2, . . . , ym]T correspondingly. There exists a mapping M
from the input space A:{u∈ U|u is the input to the system} to the output space Y:y(u)∈ Y|y is the output of the system with inputu}and can be expressed as
M:U → Y. (19)
The aim in training a neural network is to find the appro-priate weights win the weight space W, such that the differ-ence between the estimated outputsyˆ(u,w)and actual outputs
y(u) is minimal. This relation can be represented mathe-matically by
min
w∈Wˆy(u,w)−y(u)2 (20)
where.2is Euclidian norm function andx2= (xTx)1/2. Assuming that there are P input–output training patterns available to train the neural network, we will defineepas the difference betweenyˆ(u,w)andy(u)for patternp
ep= ˆy(up,w)−y(up). (21)
We can now define the training error for patternp,etrp, by using
epas expressed as
etr
p =ep2. (22)
The network training error, which is expressed by the no-tation E, stands for the training error of all patterns and is a function of the network weights,w.E(w)is computed by
E(w) =P
p=1
etr
p
2
. (23)
Training neural networks is based on minimizing E(w), expressed in (23). Modification of the network weights properly at every training step results in the minimization of E(w). There are well-known training algorithms, among them are: the backpropagation, Gauss–Newton, and LM algorithms. The backpropagation algorithm is the steepest descent method that searches for an optimalwto minimize the error in (23). The LM algorithm, on the other hand, is an approximation to the well-known Gauss–Newton’s method [26]. Suppose that we want to minimize E(w) with respect tow; then Gauss–Newton’s method for the weight update rule can be expressed as [26]
where ∇2E(w) is the Hessian matrix, and ∇E(w) is the gradient. We can express∇2E(w)and∇E(w)as
∇E(w) =JT(w)·
e1(w) e2(w)
.. . eP(w)
(25)
∇2E(w) =JT(w)J(w) +S(w) (26)
whereJ(w)is the Jacobian matrix
J(w) =
∂e1(w)
∂w1 ∂e1∂w2(w) · · · ∂e1∂w(nw)
∂e2(w)
∂w1 ∂e2∂w2(w) · · · ∂e2∂w(nw) ..
. ... ... ...
∂eP(w)
∂w1 ∂e∂w2P(w) · · · ∂e∂wP(nw)
(27)
andS(w) =Pi=1ei(w)· ∇2ei(w).
For the Gauss–Newton method, it is assumed thatS(w) = 0. Thus, the weight update rule for Gauss–Newton method becomes
∆w=JT(w)J(w)−1JT(w)e(w). (28)
The weight update rule for the LM algorithm is expressed as
∆w=JT(w)J(w) +µI−1JT(w)e(w) (29)
whereµis the training parameter. If a training step results in an increase in E(w), the parameter µis multiplied by some factorλ; if the training step results in a decrease inE(w), the parameterµis divided byλ[26].
The LM algorithm is often considered to give a better con-vergence performance when compared to the Gauss–Newton and steepest descent methods on neural network minimization problems [27]. It has been shown that the LM algorithm divides the parameters into two subsets [28]. In one subset, the conver-gence takes place as if it is a Gauss–Newton converconver-gence, and on the other subset, as if it is the steepest descent. In this way, a faster convergence is acquired [28].
IV. EXPERIMENTSETUP AND
MOTOR-DATASPECIFICATIONS
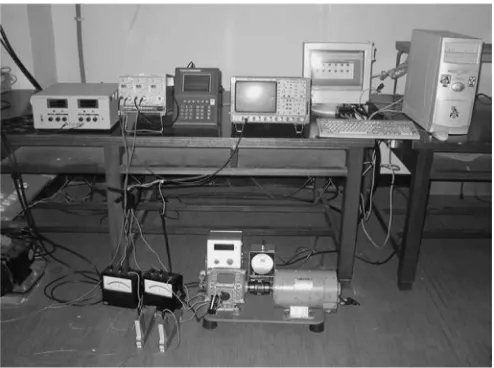
We performed invasive experiments on an actual induction motor in order to obtain an actual fault data for our analyses. The characteristics of the three-phase induction motor used in our experiment are listed in Table I. The motor was tested with a healthy rotor and with a faulty rotor that had one broken rotor bar. The broken-rotor-bar fault was induced by filling one of the rotor bars with an anchoring cement before the die-casting process. Anchoring cement is a high-strength fast-setting gypsum cement with a low conductivity. The overall data-collection scheme and the actual experiment setup picture are depicted in Figs. 2 and 3, respectively.
The induction motor was fed through a three-phase ABB, ACS 501 inverter. A Tektronix TM 5003 current amplifier am-plifies the induction motor stator currents before they are sent
TABLE I
INDUCTION-MOTORCHARACTERISTICSUSED IN THEEXPERIMENT
Fig. 2. Motor-data collection scheme.
Fig. 3. Actual experiment setup to collect the healthy and faulty motor data.
to the interfacing Pentium PC through the oscilloscope. The needed load condition of the induction motor was established by connecting the test motor to a dc motor, which is used as a generator and is capable of simulating any desired load condition. The speed of the induction motor was measured by a digital stroboscope.
Fig. 4. Healthy phase-amotor-current data collected from the experiment setup under a full-load condition of the motor.
nameplate information given in Table I. Thus, there are a total of eight different experiment cases. For each individual case, 20 sets of motor-current data were collected with a sampling frequency of 10 kHz. Thus, each motor-current data set contains 10 000 samples for a duration of 1 s. A sample phase-a motor-current data waveform corresponding to healthy motor state under a full-load condition is demonstrated in Fig. 4.
V. FAULT-DETECTIONSCHEMES AND
EXPERIMENTALRESULTS
Let us introduce some notations before we describe the two fault-detection schemes. Let C denote the motor condition, which is comprised of the two states of the motor: healthy conditionH and faulty condition with one broken rotor barF, C={H , F}. From the motor-current power spectrum analysis and broken-rotor-bar specific frequency components knowl-edge, there exists a mapping M from (P, TL) to C as ex-pressed as
M: (P, TL)→C (30)
where P={p1−, p1+, p2−, p2+} is the set of Welch’s
pe-riodogram power spectrum amplitudes at frequencies F= {f1−, f1+, f2−, f2+}, and TL is the motor load condition.
In our experiments, we have collected data at four differ-ent load conditions of the motor as discussed in Section III, whereTLis either at full-load, 75%, 50%, or 25% load,TL ∈ {TL100%, TL75%, TL50%, TL25%}. In these experiments, motor
speed data collected at a particular load condition are the same or very close to each other. Fig. 5 demonstrates the PSD esti-mates at one of the broken-rotor-bar fault specific frequencies, f1− = (1−2s)f0, under four different motor load conditions: TL∈ {TL100%, TL75%, TL50%, TL25%}. In this figure, symbol “o”
represents the PSD estimate of a healthy motor data, while symbol “x” represents the PSD estimate of a faulty motor data with one broken rotor bar.
In the monolith scheme, we use a single fault mapping unit Mthat maps the signatures extracted throughout the complete
motor-operating load condition to the motor condition both for the MDA and ANN. This scheme is depicted in Fig. 6. Inputs of the mapping unit, for either MDA or ANN, consist of the signature set {TL, p1−, p1+, p2−, p2+}, whereTL is the motor
load condition, p1−, p1+ are the first, and p2−, p2+ are the
second lower and upper sidebands’ power spectrum amplitudes around the fundamental current frequencyf0, respectively.
In the partition scheme, the single mapping unitM, which is used in the monolith scheme, is divided into disjoint submap-ping units Mi, whereMi corresponds to a submapping unit for a particular motor load condition, and M=mi=1Mi,
m
i=1Mi =∅. In our case,m= 4. The partition scheme is
de-picted in Fig. 7. The mapping units in the partition scheme pro-vide a partitioning of the complete motor-operating load region into the subregions, each subregion corresponding to a constant load condition. This procedure thus transforms the nonlinear mapping problem into linear mapping problems or mapping problems with lower order of nonlinearities. The partition scheme needs a motor load-condition information as a prerequi-site for the preparation of the corresponding mapping units. In our case, we partition motor’s load operating region into four subregions, depicted as TL ={TL100%, TL75%, TL50%, TL25%}. We then form the MDA or ANN units for each particular load subregion using the corresponding motor-current signatures.
For analyses and performance comparisons of the fault-detection schemes with the MDA and ANN units, two different cases are taken into consideration in this paper.
Case 1) Motor signature data set is treated as one whole training data set, where DataSet D= {Training Set}={Test Set}.
Case 2) Motor signature data set is separated into two sets: training and test, where DataSet D= {Training Set} ∪ {Test Set} and {Training Set} ∩ {Test Set}=∅.
In this paper, the experimental motor data are collected, such that they fall into two main groups: healthy state and faulty state of the motor (with one broken rotor bar). Since this is a two-class problem, the term LDA will be used instead of the MDA in the remainder of this paper. Detailed information about the general principles of the MDA is presented in Section III.
Fig. 5. PSD estimates atf1−= (1−2s)f0under motor load conditions:TL∈ {TL100%, TL75%, TL50%, TL25%}.
Fig. 6. Monolith scheme.
Fig. 7. Partition scheme.
In Case 2, we consider the same ANN structures but apply a different training stop technique, which is known as cross val-idation. Setting a fixed training error value to stop the training process may cause overtraining. Cross validation is a method to prevent overtraining. According to this technique, data are divided into two disjoint sets: the first data set is the training set, which is used for computing and updating the neural network
Fig. 8. Training and validation error curves with a cross-validation technique.
error for the validation set begins to rise. When the validation error increases for a specified number of steps, the training is stopped to avoid overtraining, and the most recent weights and the biases are used as the neural-network parameters [29]. Fig. 8 illustrates the principle of the cross-validation technique. In this figure, it can be seen that the training stops at the 12th epoch, since the validation error corresponding to the validation set or test data set does not decrease, but slightly increases for some consecutive steps, while training error continually decreases.
In the former part of this section, we introduced the two fault-detection schemes with the multiple signature processing for the broken-rotor-bar fault detection, which can use either the ANN or the LDA as the detection units. Experimental results based on the real motor data will also be presented in this section to affirm the notion that the multiple signature processing is more efficient than the single signature processing in addition to the performance comparison of the two detection schemes. In order to compare the fault-detection performances of the single signature and multiple signature processing, we have applied the LDA to each of the four signatures individually for both Case 1 and Case 2.
In analyzing the fault-detection performances of the two detection schemes, we will use a statistical hypothesis testing, Type I errorαand Type II errorβ. Hypothesis testing is one of the most common aspects in the statistical inference [30]. An experimenter first determines a hypothesis about a population parameter. This hypothesis is termed as “null hypothesis” and is depicted with the notationH0. The term “population” is used to indicate that the population is composed of an entire set of objects or observations that have something in common. In our case for example, a healthy and faulty motor data are two different populations. The aim of the hypothesis testing is to test the applicability of the null hypothesis in the knowledge of the experimental data. If the null hypothesis is rejected while it is actually true, this error is termed as Type I error α. In a similar way, if the null hypothesis fails to be rejected while it is actually false, this error is termed as Type II errorβ. Type I and II error definitions are introduced in Table II.
TABLE II
TYPEIANDTYPEII ERRORDEFINITION
We will use a hypothesis test to analyze the fault-detection performances of the investigated monolith and parti-tion schemes with the LDA and ANN. The null hypothesisH0 in our case is stated as
H0:Incoming motor signature test data correspond
to healthy state of the motor.
Type I errorαwill then correspond to the ratio of the healthy motor data, which are classified as faulty according to the LDA and ANN to the total number of the motor data. Likewise, Type II errorβwill correspond to the ratio of the faulty motor data, which are classified as healthy to the total number of the motor data. Apparently, Type II error has more severe consequences than Type I error in engineering applications. For example, in a motor manufacturing company, Type II error causes labeling faulty motors as the healthy motors and shipment of these faulty motors to the consumers. With Type I error, on the other hand, healthy motors are labeled as faulty, and a further analysis of these motors helps to identify and fix the problem without affecting any consumers. We will use the term “correct detection rate” (CDR), in our analyses, which are mathematically expressed as
CDR= (1−α−β). (31)
Tables III and IV depict the CDRs of each single signature for Case 1 and Case 2 together with Type I and Type II error measures. These tables indicate that CDRs change significantly according to each individual signature. Among these signatures, (1−4s)f0has the highest CDR, while the other three signa-tures have lower CDRs. The seventh to ninth rows of Table IV simply sum the CDRs and Type I–II errors of training and test data sets. We have then considered four of the signatures together and applied the monolith and partition schemes.
Table V depicts the CDR of LDA and ANN for the two schemes under Case 1 together with Type I and Type II error measures. Note that the ANN gives a perfect correct detection performance in both schemes, while LDA’s performance im-proves with a partition scheme. It is also observed that CDRs in both schemes, either with ANN or LDA, are higher than any of the single signature’s CDRs given in Tables III and IV.
The bar chart depicted in Fig. 9 presents the CDRs of both single signature processing and multiple signature processing for the two schemes under Case 1. This bar chart affirms that the multiple signature processing is more efficient in the broken-rotor-bar fault detection as expressed mathematically as
TABLE III
CDRS OFSINGLEFREQUENCYCOMPONENTSUNDERCASE1
TABLE IV
CDRS OFSINGLEFREQUENCYCOMPONENTSUNDERCASE2
TABLE V
CDRS OF THELDAANDANN WITHMONOLITH ANDPARTITIONSCHEMEUNDERCASE1
Similarly, Table VI depicts the CDRs and Type I–II errors of LDA and ANN for the two schemes under Case 2. In Case 2, since we have separated the data into training and test sets, we have included the sum of the training and test data sets’ CDRs in addition to each set’s separate CDR. There is an improvement examined in the CDR with the partition scheme, both for LDA and ANN. In addition, these CDRs are higher than any of the single signature’s CDRs that are depicted in Tables III and IV with the exception of one equal case.
The partition scheme has provided an improved correct detection performance both in the LDA and ANN. However, a significant performance increase is observed in the LDA rather than in the ANN. This is because, the ANN has already given a satisfactory response in the monolith scheme because of its nonlinear mapping and universal approximation capability. The partition scheme thus provides a way to cope with the nonlinearities in the mapping process especially for the LDA. Partitioning the initial mapping space of the fault-detection problem with respect to one of its input variables into smaller disjoint subregions and introducing submapping units, either ANN or LDA, for each of these small subregions provide an increase in the correct detection performance.
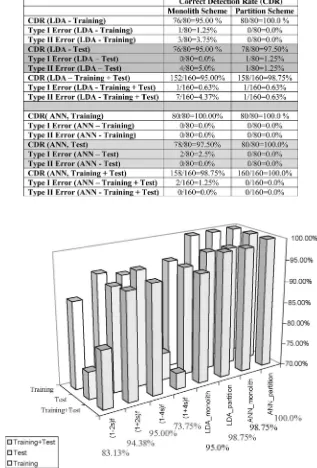
The three-dimensional (3-D) bar chart depicted in Fig. 10 presents the CDRs of both the single signature and multiple signature processing for the two schemes under Case 2. This bar chart clearly indicates that the multiple signature processing
is advantageous to the single signature processing and is math-ematically expressed in (33). It can be also noticed that CDRs are improved with the partition scheme for both the LDA and ANN, being most significant in the LDA
CDRANN_partition>CDRLDA_partition =CDRANN_monolith>CDRLDA_monolith
=CDR(1−4s)f0>CDR(1+2s)f0> . . . . (33)
VI. CONCLUSION
Fig. 9. CDRs with a single signature processing and multiple signature processing under Case 1.
TABLE VI
CDRS OFLDAANDANN WITHMONOLITH ANDPARTITIONSCHEMESUNDERCASE2
REFERENCES
[1] T. W. Wan and H. Hong, “An on-line neurofuzzy approach for de-tecting faults in induction motors,” inProc. IEMDC, Cambridge, MA, Jun. 17–20, 2001, pp. 878–883.
[2] M. E. H. Benbouzid and G. B. Kliman, “What stator current processing based technique to use for induction motor rotor faults diagnosis?,”IEEE Trans. Energy Convers., vol. 18, no. 2, pp. 238–244, Jun. 2003. [3] O. V. Thursenet al., “A survey of faults on induction motors in offshore oil
industry, petrochemical industry, gas terminals, and oil refineries,”IEEE Trans. Ind. Appl., vol. 31, no. 5, pp. 1186–1196, Sep./Oct. 1995. [4] P. V. Goode and M.-Y. Chow, “Using a neural/fuzzy system to extract
heuristic knowledge of incipient faults in induction motors,”IEEE Trans. Ind. Electron., vol. 42, no. 2, pp. 139–146, Apr. 1995.
[5] B. Li, M.-Y. Chow, Y. Tipsuwan, and J. C. Hung, “Neural-network-based motor rolling bearing fault diagnosis,”IEEE Trans. Ind. Electron., vol. 47, no. 5, pp. 1060–1069, Oct. 2000.
[6] S. Altug, M.-Y. Chow, and H. J. Trussell, “Fuzzy inference systems implemented on neural architectures for motor fault detection and di-agnosis,”IEEE Trans. Ind. Electron., vol. 46, no. 6, pp. 1069–1079, Dec. 1999.
[7] S. Altug and M.-Y. Chow, “Comparative analysis of fuzzy inference sys-tems implemented on neural structures,” inProc. Int. Conf. Neural Netw., 1997, vol. 1, pp. 426–431.
[8] M. Haji and H. A. Toliyat, “Pattern recognition—A technique for induc-tion machines rotor broken bar detecinduc-tion,”IEEE Trans. Energy Convers., vol. 16, no. 4, pp. 312–317, Dec. 2001.
[9] S. Nandi and H. A. Toliyat, “Condition monitoring and fault diagnosis of electrical machines,” inProc. 34th IEEE-IAS Annu. Meeting, Ind., vol. 1, 1999, pp. 197–204.
[10] K. Abbaszadeh, J. Milimonfared, M. Haji, and H. Toliyat, “Broken bar detection in induction motor via wavelet transformation,” inProc. IEEE IECON, 2001, vol. 1, pp. 95–99.
[11] G. B. Kliman and J. Stein, “Methods of motor current signature analysis,”
Electr. Mach. Power Syst., vol. 20, no. 5, pp. 463–474, Sep. 1992. [12] T. W. S. Chowet al., “Three phase induction machines asymmetrical
faults identification using bispectrum,” IEEE Trans. Energy Convers., vol. 10, no. 4, pp. 688–693, Dec. 1995.
[13] T. W. S. Chow and H.-Z. Tan, “HOS-based nonparametric and parametric methodologies for machine fault detection,”IEEE Trans. Ind. Electron., vol. 47, no. 5, pp. 1051–1059, Oct. 2000.
[14] B. Ayhan, M.-Y. Chow, H. J. Trussell, and M.-Y. Song, “Comparison of non-parametric spectrum methods for broken rotor bar fault detection,” in
Proc. IEEE IECON, Roanoke, VA, Nov. 2–6, 2003, pp. 2835–2840. [15] A. Bellini, F. Filippetti, G. Franceschini, C. Tassoni, and G. B. Kliman,
“Quantitative evaluation of induction motor broken bars by means of electrical signature analysis,”IEEE Trans. Ind. Appl., vol. 37, no. 5, pp. 1248–1255, Sep./Oct. 2001.
[16] R. Schoen and T. G. Habetler, “Effects of time varying loads on rotor fault detection in induction machines,”IEEE Trans. Ind. Appl., vol. 31, no. 4, pp. 900–906, Jul./Aug. 1995.
[17] G. B. Kliman et al., “Non-invasive detection of broken rotor bars in operating induction motors,”IEEE Trans. Energy Convers., vol. 3, no. 4, pp. 873–879, Dec. 1988.
[18] W. T. Thomson and I. D. Stewart, “On-line current monitoring for fault diagnosis in inverter fed induction motors,” inProc. IEE 3rd Int. Conf. Power Electron. and Drives, London, U.K., 1988, pp. 432–435. [19] F. Filipettiet al., “AI techniques in induction machines diagnosis
in-cluding the speed rifle effect,” in Proc. IEEE-IAS Annu. Meeting, San Diego, CA, Oct. 6–10, 1996, pp. 655–662.
[20] N. M. Elkasabgy, A. R. Eastham, and G. E. Dawson, “Detection of broken bars in the cage rotor on an induction machine,”IEEE Trans. Ind. Appl., vol. IA-22, no. 1, pp. 165–171, Jan./Feb. 1992.
[21] S. Lawrence Marple, Digital Spectral Analysis With Applications. Englewood Cliffs, NJ: Prentice-Hall, 1987.
[22] L. Lebart, A. Morineau, and K. M. Warwick,Multivariate Descriptive Statistical Analysis. New York: Wiley, 1984.
[23] G. McLachlan,Discriminant Analysis and Statistical Pattern Recognition. New York: Wiley, 1992.
[24] J. Maet al., “Nonlinear multiclass discriminant analysis,”IEEE Signal Process. Lett., vol. 10, no. 7, pp. 196–199, Jul. 2003.
[25] M.-Y. Chow, R. N. Sharpe, and J. C. Hung, “On the application and design of artificial neural networks for motor fault detection,”IEEE Trans. Ind. Electron., vol. 40, no. 2, pp. 181–188, Apr. 1993.
[26] M. T. Hagan and M. B. Menhaj, “Training feedforward networks with the Marquardt algorithm,” IEEE Trans. Neural Netw., vol. 5, no. 6, pp. 989–993, Nov. 1994.
[27] L. S. H. Ngia and J. Sjoberg, “Efficient training of neural nets for nonlin-ear adaptive filtering using a recursive Levenberg-Marquardt algorithm,”
IEEE Trans. Signal Process., vol. 48, no. 7, pp. 1915–1927, Jul. 2000. [28] J. Sjoberg and M. Viberg, “Separable nonlinear least-squares
minimization—Possible improvements for neural net fitting,” inProc. IEEE Workshop Neural Netw. Signal Process., 1997, pp. 345–354. [29] S. Amariet al., “Asymptotic statistical theory of overtraining and
cross-validation,” IEEE Trans. Neural Netw., vol. 8, no. 5, pp. 985–996, Sep. 1997.
[30] D. C. Montgomery, G. C. Runger, and N. F. Hubele,Engineering Statis-tics. New York: Wiley, 1999.
Bulent Ayhan(S’01) received the B.S. and M.S. de-grees in electrical and electronics engineering from Bogazici University, Istanbul, Turkey, in 1998 and 2000, respectively. He is currently working toward the Ph.D. degree at North Carolina State University, Raleigh.
He is a Research Assistant in the Advanced Di-agnosis Automation and Control (ADAC) Labora-tory, North Carolina State University. His research interests include intelligent condition monitoring of rotating machinery systems.
Mo-Yuen Chow(S’81–M’82–SM’93) received the B.S. degree in electrical and computer engineering from the University of Wisconsin, Madison, in 1982, and the M.Eng. and Ph.D. degrees from Cornell Uni-versity, Ithaca, NY, in 1983 and 1987, respectively.
Upon completion of the Ph.D. degree, he joined the Department of Electrical and Computer Engi-neering, North Carolina State University, Raleigh, where he has held the rank of Professor since 1999. His core technology is diagnosis and control, artifi-cial neural networks (ANNs), and fuzzy logic with applications to areas including motors, process control, power systems, and communication systems. He established the Advanced Diagnosis Automation and Control (ADAC) Laboratory at North Carolina State University.
Myung-Hyun Song(S’91–M’95) was born in 1953 in Jeju, Korea. He received the B.S., M.S., and Ph.D. degrees in electrical engineering from Korea University, Seoul, Korea.