CopyrightÓ2010 by the Genetics Society of America DOI: 10.1534/genetics.110.119230
Note
A Strategy for Direct Mapping and Identification of Mutations
by Whole-Genome Sequencing
Steven Zuryn, Ste´phanie Le Gras, Karine Jamet and Sophie Jarriault
1Institut de Ge´ne´tique et de Biologie Mole´culaire et Cellulaire, Institut National de la Sante´ et de la Recherche Me´dicale (INSERM) U964/Centre National de la Recherche Scientifique (CNRS) UMR 1704/Universite´ de Strasbourg,
67404 Illkirch CU Strasbourg, France Manuscript received May 25, 2010 Accepted for publication June 18, 2010
ABSTRACT
Mutant screens have proven powerful for genetic dissection of a myriad of biological processes, but subsequent identification and isolation of the causative mutations are usually complex and time consuming. We have made the process easier by establishing a novel strategy that employs whole-genome sequencing to simultaneously map and identify mutations without the need for any prior genetic mapping.
T
HE challenges posed by the identification of a causal mutation in a mutant of interest have in effect restricted the use of forward genetics to those organisms benefiting from a solid genetic toolbox. Whole-genome sequencing (WGS) is promising to revo-lutionize the way phenotypic traits are assigned to genes. However, current strategies to identify causal mutations using WGS require first the identification of an ap-proximate genomic location containing the mutation of interest (Sarinet al.2008; Smithet al.2008; Srivatsan et al.2008; Blumenstielet al.2009; Irvineet al.2009). This is because genomes contain many natural sequence variations (Denveret al.2004; Hillieret al.2008; Sarin et al. 2010), which, along with mutagen-induced ones, complicate the identification of the causal mutation when an approximate genomic location has not been previously identified. Mapping has previously been achieved with time-consuming and laborious techniques that, in addition, rely on an organism’s single-nucleotide polymorphism (SNP) map and established variant strains. For example, traditional SNP-based mapping (Wickset al. 2001; Davis et al. 2005) has previously been used in Caenorhabditis elegans to narrow down the genomic region containing the mutation of interest, prior to conducting WGS (Sarin et al. 2008). In Arabidopsis,simultaneous SNP mapping and mutation identifica-tion has been achieved with WGS, but this requires the generation of a mapping population of up to 500 F2 progeny to identify only one allele (Schneeberger et al. 2009). This is a challenging prospect for many model systems. Indeed, if the mutant phenotype is subtle, the isolation of such numbers of recombinants is very tedious. Furthermore, it is not applicable in those organisms where a mapping population cannot be generated, simply because of a lack of intercrossable variants or because of life cycles (parasitic organisms, for example) that would make it extremely difficult to follow and isolate many recombinant individuals.
Here, we describe a strategy to simultaneously and rapidly locate and identify multiple mutations from a mutagenesis screen with WGS that circumvents these limitations. This powerful and straightforward method directly uses mutagen-induced nucleotide changes that are linked to the causal mutation to identify its specific genomic location, thus negating the construction of genetic mapping populations and subsequent mapping. Treatment of organisms with a chemical mutagen induces nucleotide changes throughout the genome. Following mutagenesis, backcrossing or outcrossing of the mutagenized organism to unmutagenized counter-parts is performed to eliminate mutagen-induced mu-tations (Figure 1A; supporting information, File S2). The phenotype-causing mutation remains as only back-crossed individuals showing the phenotype of interest are retained. In addition, mutagen-induced nucleotide changes that are genetically linked to the causal muta-tion and physically surround it on the chromosome Supporting information is available online athttp://www.genetics.org/
cgi/content/full/genetics.110.119230/DC1.
1Corresponding author:Institut de Ge´ne´tique et de Biologie Mole´culaire et Cellulaire, INSERM U964/CNRS UMR 1704/Universite´ de Stras-bourg, 1 rue Laurent Fries, 67404 Illkirch CU, StrasStras-bourg, France. E-mail: [email protected]
will remain, in contrast to unlinked nucleotide changes (Figure 1A). As a result of this genetic linkage, a high-density cluster of typical mutagen-induced variants is visualized from sequence data obtained by WGS, which is positioned around the causal mutation. By locating such high-density regions, one maps the approximate genomic location of the causal mutation and subse-quently identifies the affected gene within this region.
As a proof-of-principle, we simultaneously mapped and sequenced the causal mutations of multiple C. elegans mutants isolated from an EMS mutagenesis screen using this strategy. The mutagenesis screen itself was undertaken to identify genes that controlled the reprogramming of a single cell called Y into another cell called PDA duringC. elegansdevelopment ( Jarriault et al.2008). After EMS treatment, three distinct mutant
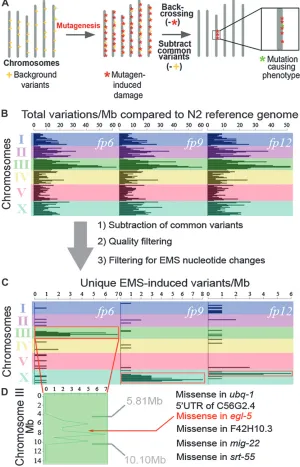
alleles (fp6, fp9, and fp12) were backcrossed to the original unmutagenized strain 4-6X. It is important to note that a backcrossing or outcrossing step is necessary for the analysis of mutants obtained from all mutagen-esis screens, irrespective of the type of mutant identifi-cation strategy used or the type of mutagen or organism used (and, as such, does not represent an extra step introduced by our method). The mutants then un-derwent WGS side-by-side (Table S1,Table S2,Figure S1, and File S2). After alignment to the wild-type N2 reference genome using MAQgene software (Bigelow et al. 2009), the sequencing data obtained for each mutant were compared, and we subtracted common nucleotide variants that were shared between at least two of our three mutants (File S1). These shared variants, which are very unlikely to be either the causal Figure1.—Mapping mutations on the basis of density of mutagen-induced DNA damage across the genome. (A) Visual representation of our WGS cloning strategy. Mutagen treatment indu-ces point mutations throughout the genome (red asterisks). Backcrossing to the original unmutated parent strain removes much of the mutagen-induced nucleotide changes except for the causal mutation (green asterisk) and those genetically linked to it. WGS sequencing can be used to detect canonical mutagen-induced point mutations, thus revealing a physi-cal position for the causal mutation. Shared back-ground variants (yellow crosses) are filtered out from WGS data by comparing the sequences of mutants sequenced side-by-side, revealing a high-density variant cluster in only one genomic region. Importantly, genomic sequences of mu-tants derived from the same starting strain must be compared, to allow subtraction of nucleotide variants that are common to this particular strain, through sequence comparison. (B) Physical map of total nucleotide variations per megabase across the genome compared to the wild-type reference genome for each mutant (fp6,fp9, andfp12) after WGS. (C) After sequence quality filtering, sub-traction of common variants between the 3 mu-tants, and filtering out noncanonical EMS nucleotide changes, high-density variant peaks are obtained in one genomic location for each mutant (red boxes). Steps 1 and 3 are essential for clear visualization of the high-density peaks whereas step 2 improves visualization. (D) Close-up of variants on chromosome III forfp6. Within this peak we identified only 6 candidate mutations that could potentially affect a protein sequence. We confirmed that the missense muta-tion inegl-5was the causal mutation (Figure S2). Forfp9andfp12we identified only 10 (9 missense and 1 39-UTR) and 4 (2 premature stop and 2 mis-sense) candidate mutations, respectively, within each mutant’s EMS-based mapped region. Thus, our method consistently allowed precise mapping in 3 different mutants to a region small enough to contain only a handful of candidate mutations.
mutation or EMS-induced mutations from the screen itself, represent strain differences between the N2 used to generate the reference genome and the PS3662 strain used here for mutagenesis. Note that this step elimi-nated 2000 point mutations as potential candidates for our causal mutation. This result strongly emphasizes the advantage of conducting WGS on two or more mutants side-by-side, as reference genomes may contain many nucleotide variations when compared to organ-isms sequenced from the laboratory (Denveret al.2004; Hillieret al.2008; Sarinet al.2010; this study) and as such would confound mutation identification.
To identify EMS-induced changes linked to the causal mutation and expose its location, we looked only at variants that matched the canonical EMS-induced G/C. A/T transitions (Drake and Baltz 1976), revealing localized peaks of high-density variation on a single chromosome for each mutant (Figure 1, B and C). These peaks correspond to regions of high mutagen-induced damage that were not removed during back-crossing and therefore are most likely genetically linked to the causal mutation. We therefore focused our attention on these physical regions to identify candidate mutations within them. We localizedfp6 to a 4.29-Mb region on chromosome III,fp9to a 7.11-Mb region on chromosome X, and fp12 to a 1.28-Mb region on a different part of chromosome X (Figure 1C).
As a proof of principle, we further examined the nucleotide changes present in the interval to whichfp6 was linked. Taking into consideration all variant types (point mutations and indels), we identified only six candidate mutations that potentially affected a gene’s
function (Figure 1D and Table S3). One of these, affecting theegl-5/hoxgene, lies almost perfectly in the middle of the predicted EMS-based mapped region. We confirmed the existence of the mutation in egl-5 by manual resequencing. Both egl-5 targeted RNAi and noncomplementation with the egl-5(n945) null allele confirmed that fp6 affected egl-5 and caused the Y-to-PDA reprogramming defect (Figure S2). fp9 andfp12 each map to distinct regions on chromosome X that also contain only a handful of candidate mutations (10 and 4, respectively) (Figure 1C). Thus, our method consis-tently allowed precise mapping in 3 different mutants to a region small enough to contain only a handful of candidate mutations and subsequent identification of the causal mutation.
We calculated that comparison of WGS data for only two mutants of the same mutagenesis screen is sufficient to localize and sequence the causal mutation (Table 1, Table S4). Thirteen times sequence coverage has been found to be sufficient to identify a mutation in a pre-SNP mappedC. elegansmutant (Shenet al.2008). Here, we tested the sequence coverage necessary to perform simultaneous mapping and mutant identification using our strategy and found that 133was more than enough (Table 1,Table S4). In addition, by performing longer reads and/or paired-end sequencing, our method can be scaled up to bigger genomes or allow multiple mutant sequencing on each flow cell lane [for, e.g., using multiplex WGS (Cronn et al. 2008)]. Further-more, because direct sequence comparison is ultimately made between two mutants sequenced side-by-side, the quality of an organism’s reference genome (which is
TABLE 1
Summary of WGS cloning strategy
Conditions used Minimal requirements tested
Backcrossing 4–63 43enough
No. of mutants sequenced 3 2 enough
Sequencing of mutant 23flow cell lanes,
paired-end reads (57mer)
13flow cell lane enough,
single-end reads (57mer) enough
Average sequence coverage 52.2–55.33 13.63enough
Advantages
Any SNP or genetic map information is not necessary
No prior wet lab work necessary: generation of a recombinant mapping population is not necessary Multiple alleles identified at once
Amenable to scaling up: can be equally used for bigger genomes Fast: 7 days sequencing, 12 hr MAQGene alignment, and 1 hr mapping Modest sequence coverage requirements limit cost
Reference genome sequence quality is not important and may not even be necessary Very straightforward without any specialized software
Requirement
Species must be amenable to mutagenesis and backcrossing
We found that all of the minimal requirements tested here were more than adequate to use our mapping strategy. Therefore, it is possible that fewer backcrosses and less sequencing coverage may suffice than is shown here. For example, for genomes with a similar size toC. elegans(100 Mb), this method can easily be scaled up by sequencing eight mutants per flow cell. As for any WGS experiments, total cost depends on genome size.
used only for alignment purposes) does not have a bearing on the mapping or mutant identification out-come. Moreover, recent advances inde novoalignment of short reads generated from next generation sequenc-ing platforms (Liet al.2010; Nowrousianet al.2010; Webband Rosenthal2010; Younget al.2010) suggest that a reference genome may not even be required to perform mutagen-based mapping and mutant identifi-cation with WGS. We predict that technical advances in these areas will make it possible to perform mutagenesis screens on any nonsequenced and genetically unchar-acterized organism and use our strategy to quickly identify the causal mutation of an interesting mutant.
By eliminating any prior work except for back/ outcrossing, a necessary step for any mutant character-ization, our simple and quick strategy provides a signifi-cant saving of time and labor as the time needed to map and identify a candidate causal mutation is trimmed down to the sequencing time (currently 7 days) and sequence analysis time (,1 day, see Table 1). In addition, our strategy allows simultaneous discovery of multiple mutant alleles from a mutagenesis screen without any mapping population generation, thus making it conceptually easy to apply to many species. Indeed, our strategy is applicable to any vertebrate or invertebrate organism subjected to mutagenesis and will be particularly useful for those organisms where traditional genetic mapping is tedious and long. The only requirement to carry on this mutant identification strategy is that the organism be amenable to back/outcrossing. Perhaps most importantly, the strategy does not use species-specific SNPs to map the mutation, thus avoiding many constraints of previous methods. Thus, the spiraling-down cost of next generation sequenc-ing technology and the establishment of our strategy open the exciting prospects of performing creative mutagenesis screens in a wide range of organisms.
We thank Arnaud Ahier, Irwin Davidson, Maria Doitsidou, and Bernard Jost for discussions and advice; Serge Vicaire from the Institut de Ge´ne´tique et de Biologie Mole´culaire et Cellulaire solexa plat-form for libraries preparation and sequencing; and Paul Ebert, Jean-Louis Mandel, Jean-Marc Reichhard, and Julien Vermot for a critical reading of the manuscript. This work was supported by a Universite´ de Strasbourg fellowship to S.Z. and grants from the Centre National de la Recherche Scientifique (CNRS) and the Fondation pour la Recherche Me´dicale to S.J. S.J. is an investigator of the CNRS.
LITERATURE CITED
Bigelow, H., M. Doitsidou, S. Sarinand O. Hobert, 2009 MAQGene: software to facilitate C. elegans mutant genome sequence analy-sis. Nat. Methods6:549.
Blumenstiel, J. P., A. C. Noll, J. A. Griffiths, A. G. Perera, K. N. Waltonet al., 2009 Identification of EMS-induced mutations
in Drosophila melanogaster by whole-genome sequencing. Genetics182:25–32.
Cronn, R., A. Liston, M. Parks, D. S. Gernandt, R. Shen et al., 2008 Multiplex sequencing of plant chloroplast genomes using Solexa sequencing-by-synthesis technology. Nucleic Acids Res. 36:e122.
Davis, M. W., M. Hammarlund, T. Harrach, P. Hullett, S. Olsen
et al., 2005 Rapid single nucleotide polymorphism mapping in C. elegans. BMC Genomics6:118.
Denver, D. R., K. Morris, M. Lynchand W. K. Thomas, 2004 High mutation rate and predominance of insertions in the Caenorhab-ditis elegans nuclear genome. Nature430:679–682.
Drake, J. W., and R. H. Baltz, 1976 The biochemistry of mutagen-esis. Annu. Rev. Biochem.45:11–37.
Hillier, L. W., G. T. Marth, A. R. Quinlan, D. Dooling, G. Fewell
et al., 2008 Whole-genome sequencing and variant discovery in C. elegans. Nat. Methods5:183–188.
Irvine, D. V., D. B. Goto, M. W. Vaughn, Y. Nakaseko, W. R. McCombieet al., 2009 Mapping epigenetic mutations in fission yeast using whole-genome next-generation sequencing. Genome Res.19:1077–1083.
Jarriault, S., Y. Schwaband I. Greenwald, 2008 A Caenorhabdi-tis elegans model for epithelial-neuronal transdifferentiation. Proc. Natl. Acad. Sci. USA105:3790–3795.
Li, R., W. Fan, G. Tian, H. Zhu, L. Heet al., 2010 The sequence and de novo assembly of the giant panda genome. Nature 463: 311–317.
Nowrousian, M., J. E. Stajich, M. Chu, I. Engh, E. Espagneet al., 2010 De novo assembly of a 40 Mb eukaryotic genome from short sequence reads: Sordaria macrospora, a model organism for fungal morphogenesis. PLoS Genet.6:e1000891.
Sarin, S., S. Prabhu, M. M. O’Meara, I. Pe’erand O. Hobert, 2008 Caenorhabditis elegans mutant allele identification by whole-genome sequencing. Nat. Methods5:865–867.
Sarin, S., V. Bertrand, H. Bigelow, A. Boyanov, M. Doitsidou
et al., 2010 Analysis of multiple EMS-mutagenized Caenorhabdi-tis elegans strains by whole genome sequencing. Genetics185: 417–430.
Schneeberger, K., S. Ossowski, C. Lanz, T. Juul, A. H. Petersen
et al., 2009 SHOREmap: simultaneous mapping and muta-tion identificamuta-tion by deep sequencing. Nat. Methods 6: 550–551.
Shen, Y., S. Sarin, Y. Liu, O. Hobertand I. Pe’er, 2008 Comparing platforms for C. elegans mutant identification using high-throughput whole-genome sequencing. PLoS One3:e4012. Smith, D. R., A. R. Quinlan, H. E. Peckham, K. Makowsky, W. Tao
et al., 2008 Rapid whole-genome mutational profiling using next-generation sequencing technologies. Genome Res. 18: 1638–1642.
Srivatsan, A., Y. Han, J. Peng, A. K. Tehranchi, R. Gibbset al., 2008 High-precision, whole-genome sequencing of laboratory strains facilitates genetic studies. PLoS Genet.4:e1000139. Webb, K. M., and B. M. Rosenthal, 2010 Deep resequencing
of Trichinella spiralis reveals previously un-described single nucleotide polymorphisms and intra-isolate variation within the mitochondrial genome. Infect. Genet. Evol. 10: 304– 310.
Wicks, S. R., R. T. Yeh, W. R. Gish, R. H. Waterstonand R. H. Plasterk, 2001 Rapid gene mapping in Caenorhabditis elegans using a high density polymorphism map. Nat. Genet.28:160–164.
Young, A. L., H. O. Abaan, D. Zerbino, J. C. Mullikin, E. Birney
et al., 2010 A new strategy for genome assembly using short se-quence reads and reduced representation libraries. Genome Res. 20:249–256.
Communicating editor: O. Hobert
GENETICS
Supporting Information
http://www.genetics.org/cgi/content/full/genetics.110.119230/DC1
A Strategy for Direct Mapping and Identification of Mutations
by Whole-Genome Sequencing
Steven Zuryn, Ste´phanie Le Gras, Karine Jamet and Sophie Jarriault
S. Zuryn et al.
2 SIFIGURE S1.—Distribution of deep sequencing coverage. For each mutant (fp6, fp9, and fp12), average coverage of each nucleotide per MB is shown across all chromosomes for combined 2-lanes paired-end data. The large peak at the very end of chromosome I may represent a highly repetitive element aligned to only a single location (within 1MB). The large peak on chromosome II maps to the location of the cog-1 gene. This most likely corresponds to sequencing of the cog-1::gfp transgene integrated into the background strain PS3662. Subsequent alignment to the native cog-1 sequence would thus over-represent coverage in this region.
S. Zuryn et al.
3 SI
FIGURE S2.—Confirmation of egl-5(fp6) mutation. (A) Sanger sequencing revealed a C to T substitution in the same position of egl-5 exon 4 as did WGS, resulting in a Threonine to Isoleucine amino acid change. The affected amino acid is a conserved residue in the highly conserved Hox domain of EGL-5. (B) fp6 and the null allele egl-5(n945) did not complement for the Y-to-PDA defective phenotype confirming that fp6 affects the egl-5 gene and that it is the causal mutation for the “no PDA” phenotype. Both fp6 and egl-5(n945) are recessive. Homozygotes for fp6 and egl-5(n945) are approximately 100% penetrant for the defective Y-to-PDA phenotype. Hermaphrodite progeny from the cross between
fp6/+ and egl-5(n945) were identified by the presence of cog-1::gfp transgene initially carried by fp6/+ males. Three separate crosses yielded the same result. (C) Lowering the activity of egl-5 by RNAi results in a “no PDA” phenotype, which phenocopies the fp6 mutants. n =164 for (B) and n = 165 for (C). Control animals were fed an empty RNAi vector. n = total number of animals scored.
S. Zuryn et al.
4 SI
FILE S1
Shared variants found in fp6, fp9 and fp12
S. Zuryn et al.
5 SI
FILE S2Supporting Methods
Preparation of mutants: C. elegans were cultured using standard methods (BRENNER 1974). We conducted an EMS mutagenesis screen in N2 nematodes carrying a cog-1::gfp transgene (PS3662 strain) that localizes GFP expression to the PDA neuron and thus allows us to select mutants that lack PDA (J. Richard, S.Z. , N. Fischer, V. Pavet, N. Vaucamps & S.J., submitted). Three mutants belonging to 3 distinct complementation groups were chosen and backcrossed to the original PS3662 strain (6X for fp6 and fp12, and 4X for fp9). We recommand that a mutagen introducing typical changes at a high frequency be used, as this facilitates the subsequent causal mutation identification. For example, damage induced by ethane methyl sulfonate (EMS) or N-ethyl-N-nitrosourea (ENU), two commonly used chemical mutagens, may be detected by the canonical nucleotide transitions they cause. Although the type of mutagen used depends on the organism to be mutagenised, one aspect that impacts on this strategy, alongside a predictable mutation type, is the mutation rate of the mutagen. In the centre of the linked regions for each mutant we sequenced, we observed G/C > A/T nucleotide changes at a frequency of 7-8 per Mb. This would correspond to a frequency of 1 mutation in every ~125 000-143 000 base pairs from a 50 mM EMS dose. In the un-linked regions of the genome, where backcrossing would have removed most, if not all, of the EMS-induced nucleotide changes, we observed between 0-2 typical EMS-induced changes per Mb. Even though a small proportion of these G/C > A/T nucleotide changes may have occurred spontaneously through genetic drift, this particular mutation load presented us with very obvious high-density variation peaks in which to concentrate our search for the causal mutation. However, a lower mutation rate may also suffice. ENU has been reported to induce 0.5-1 mutation in every 100 000 nucleotides in mice (BEIER 2000) and would thus be appropriate for use with
our strategy.
Genetic drift, mixed-origin reference genome and backcrossing: A number of studies have suggested that natural genomic variations occur between strains of the same species, especially in laboratory conditions. For example, strains of C. elegans continuously grown for more than 2 years have been suggested to accumulate as many mutations as after EMS treatment (DENVER et al. 2004). The use of WGS has started to provide extensive molecular evidence of the existence of hundreds to thousands of differential variants between the N2 sequenced reference genome and N2 derived laboratory strains has been described (HILLIER et al. 2008; SARIN et al. 2008). The existence of mutation accumulation and
genetic drift represents a challenge to mutation identification using strategies that involve comparison of the genome sequence of mutants to a reference genome, considering that, in addition to mutagenesis, the mutants may have accumulated other new variants spontaneously. In addition, a reference genome can have been made from an assembly of a number of different individuals (as is the case for the ongoing Zebrafish genome [www.sanger.ac.uk/Projects/D_rerio]). However, genetic drift or a mixed-origin reference genome do not represent an issue for mutation identification using our strategy, as the mutant genomes are compared between each other for identification and removal of background variants. This strategy vastly increases the overall robustness of mutation identification by minimizing positive and false-negative results caused by reference genome errors. We recommend backcrossing to the original strain that was subjected to mutagenesis. Doing so ensures that all mutant strains will share the same background variation, which can be subsequently subtracted. Outcrossing of the mutant strains to another wild-type isolate is also possible, but may yield more than one region of high density variation: one around the causal mutation and at least one around any other genomic locus that has to be kept in the mutant strain, such as the integration site of a reporter transgene. The number of high-density regions increases with the number of loci that need to be kept during outcrossing. We believe that the risk of having a mixed variants signature when another strain than the original strain is used to outcross is very low if outcrossing has been performed thoroughly (4X should be enough based on our experience of removing EMS-induced changes outside of linked genomic regions). Depending on the speed of genetic drift within a given species, backcrossing mutants from a mutagenesis screen in a timely manner with the original un-mutagenised strain will minimize drift. If backcrossing cannot be performed directly after the screen and if, like C. elegans, populations can be frozen and retrieved at a latter time, we recommand to keep a frozen aliquot of the original strain used for the screen and freeze the mutants retrieved directly after the screen. We also recommand to backcross multiple mutants in parallel if they are to be sequenced together.
Preparation of genomic DNA and genome sequencing: Genomic DNA was prepared from populations of each mutant using the Gentra Puregene Kit (Qiagen). 10 mg of genomic DNA was fragmented by nebulisation (according to Illumina instructions) to obtain fragments in the range of 500bp in size. Sequencing libraries were made according to the Illumina protocol. The three paired-end libraries were sequenced at the IGBMC sequencing platform on the Illumina GAII as 57-bp paired end reads, following the manufacturer's protocols. Each mutant was sequenced on two flow cell lanes producing coverage of 52.2-55.3X for the 3 mutants across the genome (SI table 2). Image analysis and base calling was performed with Illumina Pipeline version 1.6 with default parameters.
Analysis software: Sequences were mapped to E. coli strain 536 using Bowtie (LANGMEAD et al. 2009) version 0.12.0.
S. Zuryn et al.
6 SI
emphasizes the advantage of conducting WGS on two or more mutants side-by-side, as reference genomes may contain many nucleotide variations when compared to organisms sequenced from the laboratory, and as such would confound mutation identification. Alternatively, one may conduct WGS on the original starting strain used for mutagenesis, which could be used to eliminate strain specific variations. However, in the interests of reducing costs it would be more advantageous to directly sequence multiple mutants of the same background instead. Quality filtering involved selecting only those variants with a MAQgene mapping score of 63 with 0 wild-type reads. EMS may cause other genetic changes such as small insertions or deletions (indels); however, for mapping purposes, we concentrated on the most typical EMS-induced change, as these were sufficient to identify a region containing the causal mutation. After the genomic region is identified quality filtering may be removed to reveal all variants (of all quality) detected within the mapped region, thus avoiding false negatives. In our experience, an EMS-induced variant linkage region is still discernable without firstly performing quality filtering suggesting that this step is not absolutely required for our strategy.
Confirmation of egl-5(fp6) allele: Sanger-based sequencing on fp6 animals was performed using the forward primer: CAAGCTTCTGCAAGGAATGCCT and the reverse primer: TTACGGTGGACACAACGGGTAT to generate an amplicon of 439bp containing the expected variant. Sequencing on both strands confirmed the presence of the variant. Genetic complementation analysis between fp6 and egl-5(n945) mutants (recessive and null) yielded no complementation. RNAi of egl-5 by the feeding method was performed as previously described (KAMATH et al. 2001) and was conducted in RNAi sensitive rrf-3(pk1426);cog-1::gfp animals.
Supporting literature cited
BEIER,D.R., 2000 Sequence-based analysis of mutagenized mice. Mamm Genome 11: 594-597.
BIGELOW, H., M.DOITSIDOU, S.SARIN and O.HOBERT, 2009 MAQGene: software to facilitate C. elegans mutant
genome sequence analysis. Nat Methods 6: 549.
BRENNER,S., 1974 The genetics of Caenorhabditis elegans. Genetics 77: 71-94.
DENVER,D.R., K.MORRIS, M.LYNCH and W.K.THOMAS, 2004 High mutation rate and predominance of insertions in the Caenorhabditis elegans nuclear genome. Nature 430: 679-682.
HILLIER,L.W., G.T.MARTH, A.R.QUINLAN, D.DOOLING, G.FEWELL et al., 2008 Whole-genome sequencing and variant discovery in C. elegans. Nat Methods 5: 183-188.
KAMATH,R.S., M.MARTINEZ-CAMPOS, P.ZIPPERLEN, A.G.FRASER and J.AHRINGER, 2001 Effectiveness of specific RNA-mediated interference through ingested double-stranded RNA in Caenorhabditis elegans. Genome Biol 2: RESEARCH0002.
LANGMEAD,B., C.TRAPNELL, M.POP and S.L.SALZBERG, 2009 Ultrafast and memory-efficient alignment of short DNA
sequences to the human genome. Genome Biol 10: R25.
SARIN, S., S. PRABHU, M. M. O'MEARA, I. PE'ER and O. HOBERT, 2008 Caenorhabditis elegans mutant allele
S. Zuryn et al.
7 SI
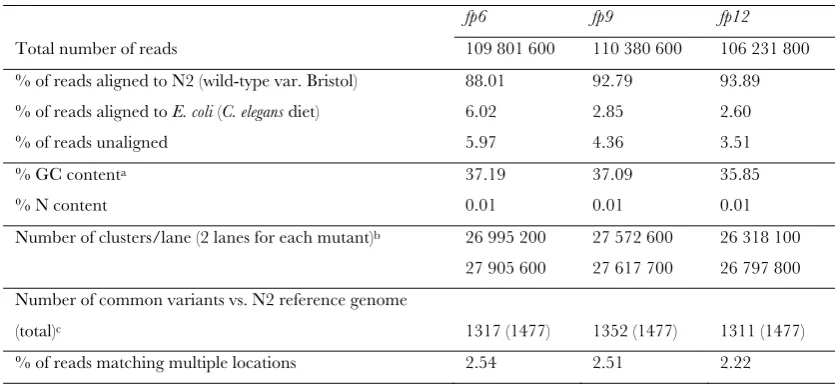
TABLE S1
Summary of WGS metrics
fp6 fp9 fp12
Total number of reads 109 801 600 110 380 600 106 231 800 % of reads aligned to N2 (wild-type var. Bristol) 88.01 92.79 93.89 % of reads aligned to E. coli (C. elegans diet) 6.02 2.85 2.60 % of reads unaligned 5.97 4.36 3.51
% GC contenta 37.19 37.09 35.85
% N content 0.01 0.01 0.01 26 995 200 27 572 600 26 318 100 Number of clusters/lane (2 lanes for each mutant)b
27 905 600 27 617 700 26 797 800 Number of common variants vs. N2 reference genome
(total)c 1317 (1477) 1352 (1477) 1311 (1477)
% of reads matching multiple locations 2.54 2.51 2.22
aN2 wild-type genome contains ~36% GC content. bNumber of clusters are shown after being purity filtered
during Illumina pipeline. cHigh quality variants (MAQgene mapping score of 63 with 0 wild-type reads) shared in at
least 2 of three mutants sequenced. We found that a total of 1477 high quality variants were identified to be common in at least 2 out of the 3 mutants. The common variants from our backcrossed mutants represent SNPs present in our starting strain (PS3662). Note that these numbers highlight how different our starting strain is in terms of variants, from the reference genome. This might be also true for many strains made in the N2 background, a fact that will be confirmed with additional sequencing of other backgrounds.
S. Zuryn et al.
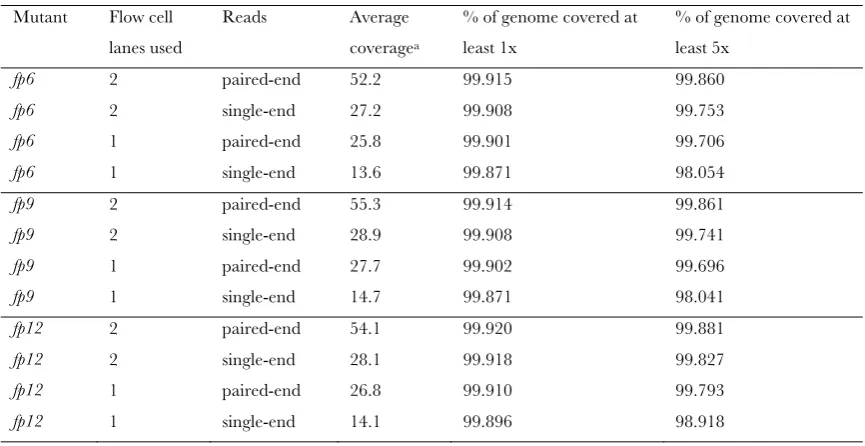
8 SITABLE S2
Sequence coverage for each mutant under different WGS conditions
Mutant Flow cell lanes used
Reads Average coveragea
% of genome covered at least 1x
% of genome covered at least 5x
fp6 2 paired-end 52.2 99.915 99.860
fp6 2 single-end 27.2 99.908 99.753
fp6 1 paired-end 25.8 99.901 99.706
fp6 1 single-end 13.6 99.871 98.054
fp9 2 paired-end 55.3 99.914 99.861
fp9 2 single-end 28.9 99.908 99.741
fp9 1 paired-end 27.7 99.902 99.696
fp9 1 single-end 14.7 99.871 98.041
fp12 2 paired-end 54.1 99.920 99.881
fp12 2 single-end 28.1 99.918 99.827
fp12 1 paired-end 26.8 99.910 99.793
S. Zuryn et al.
9 SI
TABLE S3
Candidates mutations in the fp6 linked region
Chromosome position Type Class Parent feature
5942012 G/C>A/T Missense F25B5.4
6331680 G/C>A/T 5’ UTR C56G2.4.
7816050 G/C>A/T Missense C08C3.1 (egl-5)
8487391 G/C>A/T Missense F42H10.3
8765118 G/C>A/T Missense PAR2.4
10105957 G/C>A/T Missense T16H12.8
S. Zuryn et al.
10 SITABLE S4
Comparison of sequence coveragea and number of mutants needed to perform our cloning strategy in
fp6
Flow cell lanes usedb
Reads Mutants compared fp6 linked region Number of
candidatesc
true fp6 allele identified
2 paired-end fp6, fp9, fp12 5811728-10105957Mb 6 Yes
2 single-end fp6, fp9, fp12 5811728-11638999Mb 6 Yes
1 paired-end fp6, fp9, fp12 5811728-10105957Mb 6 Yes
1 single-end fp6, fp9, fp12 3615997-10105957Mb 6 Yes
2 paired-end fp6, fp9 5811728-10105957Mb 6 Yes
2 single-end fp6, fp9 3468244-11638999Mb 6 Yes
1 paired-end fp6, fp9 3615997-11638999Mb 6 Yes
1 single-end fp6, fp9 2405323-10501170Mb 6 Yes
2 paired-end fp6, fp12 5811728-10105957Mb 6 Yes
2 single-end fp6, fp12 5811728-11638999Mb 6 Yes
1 paired-end fp6, fp12 5811728-10105957Mb 6 Yes
1 single-end fp6, fp12 3615997-10105957Mb 6 Yes