JERNIGAN, LEON STACY, JR. Factors Influencing the Distributional Patterns of
Juncus
roemerianus in Two North Carolina Salt Marshes. (Under the direction of ERNEST D. SENECA).Zonation of salt marsh vegetation as it relates to physical and edaphic factors was examined at two
Juncus
roemerianus marshes along the North Carolina coast. Other objectives were to determine leaf longevity and to compare leaf density, biomass, and regrowth of Juncus at the two marshes.OF JUNCUS ROEMERIANUS IN TWO NORTH CAROLINA SALT MARSHES
by
LEON STACY JERNIGAN,
JR.
A thesis submitted to the Graduate Faculty of North Carolina State University at Raleigh
in partial fulfillment of the requirements for the Degree of
Doctor of Philosophy DEPARTMENT OF BOTANY
RALEIGH 1990
APPROVED BY:
BIOGRAPHY
Leon S. Jernigan, Jr. was born January 19, 1953, in Dunn, North Carolina. He received his elementary and secondary education in Buies Creek, North Carolina, graduating from Buies Creek High School in 1971.
In 1975, he graduated Magna Cum Laude with the Bachelor of Science degree in biology from Campbell Univerisity at Buies Creek.
In 1975, he entered the Zoology Department at North Carolina State University at Raleigh and received his master's degree in 1977. He taught introductory biology at Campbell University and Johnston Community College (East Carolina University
-College Transfer Program) from 1977 - 1980.
The author wishes to express his sincere appreciation to Dr. Ernest D. Seneca
for his encouragement, guidance, and patience throughout this study and for critically
reviewing this manuscript. Appreciation is also extended to the other members of the
advisory committee, Drs. Udo Blum, Steve Broome, Rick Linthurst, and John Miller
for their time and for correction of this manuscript.
Special thanks is expressed to Larry Hobbs and Carlton Campbell for their
creativity and physical assistance during data collection and Bertha Crabtree of the
Soil Science Department for her assistance in laboratory analysis of the the soil
samples.
Finally, the author wishes to express his appreciation to Kay Parker for the
many hours she spent helping to keypunch data. I am especially grateful for her
TABLE OF CONTENTS
LIST OF TABLES ... .
LIST OF FIGURES ... .
INTRODUCTION AND REVIEW OF LITERATURE ... .
MATERIALS AND METHODS ... .
Description and Location of Study Sites ... .
Study Site Analysis ... . Abiotic factors ... . Biotic factors ... ..
Statistical Analyses ... ..
RESULTS ... .
Abiotic Factors ... . pH ... . Salinity ... . Water table ... . Tidal regime ... ; ... .. Redox potentials ... . Soil nutrients ... . Soil car'bon and nitrogen ... . Soil texture ... .
Biotic Factors ... . Biomass ... . Density ... . Longevity ... ,. ... .
S · pectes composItIon ... . ..
Abiotic Factors.... ... ... ... 36
Biotic Factors.... ... .... .... ... ... .... ... ... ... ... ... 44
SUMMARY AND CONCLUSIONS...
48
LITERATURE CITED... 50
LIST OF TABLES
Page Table I. Means (± I S.E.) of nutrient analysis of soil samples
from different wgetation zones at two
marshes...
18Table 2. ComparilOn of the two manbes by zone with respect to
mean
concentrations(ma-,')
±
1
S.E. of soilcarbon and
nitrogeo...
20
Table 3. ComparilOn of two
depth
cateaories by zoneaDd
locationwith respect to mean CODCeIItrations
(IDI'''~
±
1 S.E. ofsoil carbon
aDd
DitropD...
21
Table 4. ComparilOn of the two manbes with respect to soil texture
(i
±
I S.E.) witbiD amae...
22Table
S.
MeanbiolDUl
{J.m·~±
1 S.E. of J"'M'm rpcgwiapp attwo Nonh
CaroIiDa
manb . . . tabDcIuriDa
thefinI
weekof July
1984
(mitiaI)aod
19M (redippiDa)...
24
Table 6. StandiDa live
aod
deaddImitieI
(1eaYel'ID'~ a"..pdowr
aU
plots for the eotire _lICIyperiocI...
29Table 7. Species composition at the Newpon
and
Soutbpon manbesPage
Figure
1.Design of the PVC pipe wells... ...
5
Figure 2. Mean low and
hightide pH of the transect wells at the
Newport marsh...
10
Figure 3. Mean low and
hightide pH of the transect wells at the
Sou'tb.port marsh... ... 10
Figure 4. Mean low and
hightide salinities of the transect wells at
the Newport marsh... ... 11
Figure 5. Mean low and
hightide salinities of the transect wells at
the Southport marsh... ... ...
11
Figure 6. Mean low and
hightide water levels in the transect wells
relative to sediment surface at the Newport marsh... ...
13
Figure 7. Mean low and
hightide water levels in the transect wells
relative to sediment surface at the Southport marsh...
13
Figure 8. Monthly mean low and
hightides at the Newport marsh... ...
15
Figure 9. Monthly mean low and
hightides at the Southport marsh...
15
Figure 10. Mean redox potentials of the upper 10 em and lower 30 em
of sediment at four stations in the Newport marsh... ... ... ....
16
Figur~
11. Mean redox potentials of the upper 10 em and lower 30 em
of sediment at four stations in the Southport marsh... 16
Figure 12. Live and dead aboveground biomass from initial clipping
(July 1984) at Newport marsh ..
~...25
Figure 13. Live and dead aboveground biomass from reclipping
Figure 14. Live and dead aboveground biomass from initial clipping
(July 1984) at Southport marsh... ... ... 26 Figure 15. Live and dead aboveground biomass from reclipping
(July 1985) at Southport marsh... 26 Figure 16. Live leaf densities averaged over plots 1-5 for one year at
each marsh... ... ...
28
Figure 17. Mean heights of young and mature leaves from longevity
plots at the Newport marsh... ... ... ... 30 Figure 18. Mean heights of young and mature leaves from longevity
plots at the Southport marsh... ... 30 Figure 19. Mean monthly changes in the amounts of live and dead
portions of mature leaves at the Newport marsh... 31 Figure 20. Mean monthly changes in the amounts of live and dead
portions of mature leaves at the Southport marsh.. ... 31 Figure 21. Mean monthly changes in the amounts of live and dead
portions of young leaves at the Newport marsh... ... 32 Figure 22. Mean monthly changes
in
the amounts of live and deadThere are approximately 3,174,333 hectares of salt marsh in the eastern United
States (Eleuterius, 1976). Much research has been done on the role of salt marshes
in estuarine productivity (Nixon 1980), primarily on those dominated by Spartina
alternif1ora.
Juncus
roemerianus marshes have not been as well studied. Of the83,572 hectares of salt marsh in North Carolina, 40,682 to 64,334 hectares are
dominated by
L
roemerianus (Critcher 1967; Wilson 1972; Eleuterius 1976).Salt marsh vegetation is primarily dominated by a few species limited to the
following genera: Spartina,
Juncus.
Distichlis. and Salicornia (Adams 1963; Cooper1969) and occurs in usually well-defmed zones. There is considerable disagreement
in the literature regarding the environmental factors responsible for the zonation.
Factors studied have included tides, salinity, water table, soil, elevation, precipitation,
temperature, mowing, and ditching (Conard and Galligar 1929; Chapman 1938,
1940a, 1 940b, 1960; Miller and Egler 1950; Stalter 1968). Hackney and de la Cruz
(1978) concluded that salinity was not responsible for vegetational zonation in a
Mississippi tidal marsh and suggested that inundation (as a function of elevation) or
competition with other marsh species may account for zonational patterns. Other
researchers have suggested the importance of frequency and duration of tidal
York 1915; Adams 1963; Mahall and Park 1976; Sapp et al. 1976; Seneca et al. 1985). Hodson (1971) believed depth of inundation rather than duration of flooding prevented invasion oflower elevations by Juncus. The importance of differential soil drainage in explaining vegetational zonation in salt marshes has been well documented (Nichols 1920; Penfound and O'Neal 1934; Chapman 1938; Penfound and Hathaway 1938; Reed 1947; Ranwell et al. 1964; Redfield 1972). Other researchers have used soil redox potentials (a function of soil drainage) as a measure of the anaerobic state of the sediments as it affects organic matter decomposition, nutrient availability, and sulfide inhibition (DeLaune et al. 1981, 1983, 1984; Ingold and Havill 1984; Jaynes and Carpenter 1986). More recent work has concentrated on competition as the controlling factor in vegetational zonation of salt marshes (Bertness 1988). The regulatory factors affecting vegetational zonation are not yet fully understood.
The objectives of this study were: 1) to examine a variety of physical and edaphic factors that might influence the zonation which occurs between Spartina and
Description and Location of Study Sites
There is considerable variability in size of sounds, tidal influence, salinity, and substrate composition within the North Carolina estuarine system. The southern portions of the estuaries are characterized by narrow sounds, Spartina alterniflora-dominated marshes, high salinities, silty substrates, and a tidal amplitude ranging from 0.3 to 1.5 m. North of Cape Lookout there is a general trend toward wider sounds, increased proportions of Juncus roemerianus marshes, lower salinities, sandy substrates, and a shift in the importance of tidal influences from astronomic to wind tides (Adams and Quay 1958; Funderburg and Quay 1959; Williams et al. 1966; Wilson 1972; Schwartz and Chestnut 1973; Cooper 1974; Riggs and O'Conner 1974). Two study sites, a northern one and southern one, were identified to represent the general types of estuarine-marsh systems within the state. Based on field
reco~ssance, marshes of similar appearance with two zones of vegetation, ~
alterniflora and
L
roemerianus, plus an uplandfilms
taeda
zone were selected. The northern marsh study site, located along the .Newport River near Newport in Carteret County (lat. 34° 46' N., long. 76° 45' W.) was characterized by lower salinities, narrow tidal amplitude, wind-dominated tides, and a more extensivef..
taeda
zone.The southern marsh study site located along Walden Creek, a tributary of the Cape Fear River near Southport in Brunswick County (lat. 330 58' N., long.
1'1'
59' W.),was characterized by higher salinities, broad tidal amplitude, and astronomic-dominated tides.
Study Site Analysis Abiotic factors
40
em
Coupling
5 em PVC pipe
Couplings
Sediment surface
5 em PVC well screen
Cap
Figure 1. Design of the PVC pipe wells.
Fisher and Porter punch tapte level recorders were installed in estuarine waters
at each marsh site to record tidal height every half hour for 13 months.
Four redox sampling stations were randomly selected along the transects, one
each in Spartina, Spartina-Juncus transition,
Juncus,
andJuncus-finua
transition.At each station, monthly low tide redox potentials at seven depths (2, 5, 10, 15,20,
30, and 40 em) were measured using a Fisher Accumet 640 pH meter, calomel
reference probe, and five insulated copper wire probes with platinum tips.
Construction of the platinum tip probes consisted of 1 m of 8 gauge copper wire, 1
em of 18 gauge platinum wire, and several layers of heat-shrinkable insulation. Based
on preliminary observations, the probes were allowed to equilibrate for 10 to 15
minutes prior to reading. Other researchers have arrived at similar times for
equilibration (de la Cruz et ale 1989). The redox measurements were averaged over
time and probes for each of the four stations by two categories of depth, upper 10
em and lower 30 em. The upper 10-cm depth was chosen as a natural break because
it is the zone that often contains the greatest root concentration (Craft et ale 1988).
Addi~onally, a similar sampling of the redox potentials of 12 marshes (including the
two study sites) from Oregon Inlet to South Carolina was conducted within a
three-day period as a point of reference for the present study.
Fifteen soil samples, 30 em in depth and 8.5 em in diameter (10 in
Juncus
andAgriculture using their routine methods. Additional analyses to determine total Kjeldahl nitrogen, % organic matter, and texture were conducted on samples partitioned into the upper 10-cm and lower 20-cm portions. Total carbon was determined by multiplying a conversion factor (0.45) times the amount of organic matter (Nixon 1980).
Elevations of
all
sampling points (wells, plots, redox stations, and the recording gauges) were determined by standard survey methods and nearby known elevations.Biotic factors
Ten 0.5-m2 clip plots were randomly selected along the transects in the JunCUS
zone to estimate aboveground biomass. The plants were clipped at ground level at assumed peak production the flISt week in July (Seneca et al. 1976). The clippings were sorted into live and dead groupings, dried at 70° C for 72 hr, and weighed. These. same plots were reclipped 13 months later and clippings were treated the same. At each marsh a 0.25-m2 longevity plot was randomly established along the
measurements of height (to the nearest 0.5 em) of ten young leaves and ten mature leaves which were tagged using numbered bamboo stakes and nylon string. Leaves between 10 and 30 em tall were considered young leaves and leaves greater than 50 em tall with 1 em or more of dieback at the tip were considered mature leaves.
Statistical
Analyses
Abiotic Factors
The mean well water pH values (averaged over the 16 months for each well) ranged from 6.42 to 6.74 at the Newport marsh and from 5.68 to 6.78 at the Southport marsh (Figures 2 and 3). Surface water pH ranged from 5.49 to 7.50 at the Newport marsh and from 5.66 to 7.64 at the Southport marsh. Differences in mean well water pH between high and low tide measurements were less than 0.1 pH unit at each marsh (6.56 low, 6.59 high at Newport; 6.36 low, 6.41 high at Southport). The pH difference between the Spartina and Juncus zones was approximately 0.1 pH unit at each marsh (6.47 Spartina. 6.57 Juncus at Newport; 6.58 Spartina. 6.44 Juncus at Southport). No significant pH differences existed between the marsh sites.
Salinity
.No significant differences in mean well water salinities (averaged over the 16 months for each well) were detected between high and low tide readings at either marsh (Figures 4 and 5).
6.8 6.6 6.4
---a-- Low Tide
=
a. 6.2 • High Tide6.0 5.8
Spartina Juncus Pinus
5.6
0 20 40 60 80 100 120 140 160
DisUnce (m) From Op_ W.ler
Figure 2. Mean low and high tide pH of the transect wells at the Newport marsh.
Standard error of the difference between low and high tide pH's
=
0.01.~ Low Tide
• High Tide
100 120 140 160
Op_ W.ter
Figure 3. Mean low and high tide pH of the transect wells at the Southport marsh.
Standard error of the difference between low and high tide pH's
=
0.02.25
"...
...
A. 20 A.
ot.;
~
...
15.~
c:
.,.
-
en..
105 0
0
Spartina Juncus
20 40 60 80 100 120
DisUnce (m) From Op_ W.ler
Low Tide
High Tide
Pinus
140 160
Figure 4. Mean low and high tide salinities of the transect wells over 16 months
at the Newport marsh. Standard etTOl" of the difference between
low and high tide salinities
=
0.13.30 25
"...
...
20
A. A.
ot.;
~ 15
..
~ Low Tide.
~c: • High Tide
.~
-
en..
10~ c
5 :;:; ~ \1\ :::J
() ~
Q. C :::J
(I) ""')
0
0 20 40 60 80 100 120 140 160
DisUnce (m) From Op_ W.ter
Figure 5. Mean low and high tide salinities of the transect wells over 16 months
at the Southport marsh. Standard error of the difference between
steadily decreased as distance from open water increased, creating a significant
difference in mean well water salinity between the Spartina zone and the Juncus zone
(t.05
=
5.79, dJ.=
8.7), 15 + 1.1 and 8 + 0.6 parts per thousand (ppt), respectively(Figure 4). Average surface water salinities at each end of the transect parallel these
zonal means, 17
+
2.5 ppt at the Spartina end and 8+
2.2 ppt at the Juncus end. At the Southport marsh, mean well water salinity fluctuated between 15 and 23 pptalong the transect while surface water salinities averaged 20
+
1.5 ppt. No significant difference existed in mean well water salinity between the Spartina zone and the Juncus zone (Figure 5). Juncus was growing under higher average salinities at theSouthport marsh than at the Newport marsh, 19 + 0.6 and 8 + 0.6 ppt, respectively.
Water table
Sediment saturation at the two marshes was similar. The water table remained
very close to the sediment surface at all stations along the transect at each marsh site
(Figures 6 and 7). A significant difference in mean well water levels (averaged over
the 16 ~onths for each well) was detected between high and low tide measurements
at the Newport marsh, mean difference of 1.6 + 0.14 em (Figure 6). Mean well water levels were significantly higher at high tide ~ at low tide at the Southport marsh,
mean difference of 4.0
+
0.94 em (Figure 7).- - - - G - - Low Tide
,...
e
•
High Tideu
-
...
sediment surface"
•
0"
..J ~"
~..
:.
Spartina Juncus Pinus
-10
0 20 40 60 80 100 120 140 160
Distance (m) From Opea W.ter
Figure 6. Mean low and high tide water levels in the transect wells relative
to sediment surface at the Newport marsh. Standard error of
difference between low and high tide water levels = 0.14.
20
10
,...
0
E
sediment sur face
u
-
...
-10"
•
"
-20..J - - - - G - - Low Tide
~
"
-30...
..
~C 11\
>
:;:; ::J()
-40 It.. c
~ ::J
a.
..,
(I)
• High Tide
-50;-T-~~~-r~~~T-~ __ -+-r~~~~~~~~
o
20 40 60 80 100 120 140 160Distance (m) From Opea W.ter
Figure 7. Mean low and high tide water levels in the transect wells relative
to sediment surface at the Southport marsh. Standard error of
the Spartina (-3.1 ± 1.1) than in the Juocus (-0.8 ± 0.5) zone at the Newport marsh,
however, the opposite was true at the Southport marsh, Spartina (5.0 ± 2.0) versus
Juncus
(0.9 ± 1.2).Tidal repue
The tides at the Newport marsh are primarily wind-driven with a tidal
amplitude of 0.9 m. The mean high tide seldom exceeds the mean elevation of the
marsh (Figure 8), resulting in very little flushing of the Juncus zone.
The tides at the Southport marsh are primarily under astronomic influence
with a tidal amplitude of 1.3 m. The mean high tide frequently exceeds the mean
elevation of the marsh (Figure 9), resulting in periodic flushing of the Juncus zone.
Since the tidal amplitude is greater and the mean elevation of the marsh is lower at
the Southport marsh, it was flooded more frequently than the Newport marsh.
Redox potentials
The two marshes exhibited different patterns of redox potentials relative to
distance from the open water. The pattern in the Newport marsh was an increase in
redox potential between the Spartina station and the Spartina-Juncus station followed
by decreases at the Juncus and Juncus-finua stations (Figure 10). The pattern in the
80 High Tide
60
•
Low Tide,..
E 40 Mean Elevation of Marsh
~
-
...
20~
~ 0
...
II
::c -20
-
"
-40"
...
...
-60~
-80
•
•
e•
•
•
. _ e e-100
,..
E ~-
...
~ ~...
II::c
-
"
"
...
...
OCT NOV DEC JAN FEB MAR APR MA Y JUN JUL AUG SEP
"ONT"
Figure 8. Monthly mean low and high tides at the Newport marsh.
100 80 60 40 20 0 -20 -40 -60 -80 -100
Tidal height of zero = MSL.
Mean Elevation of Marsh
- - - a - High Tide
•
Low TideOCT NOV DEC JAN FEB MAR APR MAY JUN JUL AUG SEP
"ONT"
Figure 9. Monthly mean low and high tides at the Southport marsh.
::. E
100
S/J
50
0
-50
JIP
-100
-150 - - 0 - - - Upper 10 em
• Lower 30 em
-200
0 20 40 60 80 100 120
Disbnce (m) From Open W.ter
Figure 10. Mean redox potentials of the upper 10 em and lower 30 em of sediment at four stations in the Newport marsh.
100
J
50
~ Upper 10 em
0 • Lower 30 em
::. E -50
-100
-150
5
-200
0 20 40 60 . 80 100 120
Dist . . ce (m) From Open W.ter
Figure 11. Mean redox potentials of the upper 10 em and lower 30 em
of sediment at four stations in the Southport marsh.
140
11). The Southport marsh pattern was more typical of that found in other marshes
along the coast of North Carolina (Appendix, Figures AI-A12; de la Cruz et al.
1989). The data obtained from the survey of 12 marshes in three days (Appendix,
Figures AI-A12) generally show Juucus to be less reduced than Spartina. Even though the graphs of the redox potentials of the upper and lower depth categories
mirrored each other, the redox potentials of the upper 10 em were significantly higher
than those of the lower 30 em at each of the four stations within each marsh.
Soil nutrients
The nutrient analyses produced many statistically significant zonal differences,
but the one of most biological interest was the higher levels of phosphorus found in
the Spartina zone at both locations (Table 1). Although the difference was significant
only at the Newport site, NH4-N was higher in the Spartina than in the Juncus zone of both marshes. Sodium was higher in the Spartina zone than in the Juncns zone
at Ne\\1>Ort, but the opposite was true at Southport. The latter pattern also occurred
soluble salts. Both manganese and zinc were higher in the Spartina than in the Juncus zone. There was more humic mattet: (humic and fulvic acids) in the JunCUS
Table 1. Means (± 1 S. E.) of nutrient analysis of soil samples from different vegetation
zones at two marshes.
Nutrient
P mg/cdrn
~ meq/lOOcc
Ca meq/lOOcc
M. meq/ 1 OOCC
Na meq/ 1 00cc
WtlVolg/cc pH BUfer Acidity meq/lOOcc Newport Juncus (n=10)
10.5:1: 1.5 1.1:1: 0.2 4.6:1: 0.4 13.7:1: 1.7 22.0:1: 4.2 0.6:1: 0.1 5.6:1: 0.1 2.1:1: 0.2
•
•
•
S . . of Calio . . 41.3 :I: 6.3
•
meq/1OOcc
CEC meq/lOOcc 43.4 :I: 6.3
•
"
BueSaL 93.6:1: 1.4•
Ua.mg/cdrn 2.0:1: 0.3
•
Zamg/cdrn 1.5:1: 0.3
•
C. mg/cdrn 0.3:1: 0.02
•
Hame g/lOOcc 1.4:1: 0.2
•
NB4-N mg/cdrn 18.5:1: 3.5
•
Salable Salts 14.1:1:2.8
•
mmho/cm
S04-S mg/cdrn 1624.8 :I: 220.4
Spartina
(n=5)
34.0 ± 4.2 2.0:1: 0.1 5.2 :I: 0.2 17.9:1: 1.3 40.0:1: 4.0 0.6:1: 0.01 5.6 :I: 0.2
1.6:1:0.4
65.0:1: 5.6
66.6:1: 5.3 97.4:1: 0.8 7.3:1: 1.1 5.1 :I: 0.6 0.5:1: 0.04 0.4:1: 0.05 39.7:1: 2.5 21.9:1: 2.0
2125.2 :I: 94.5
• indic~ significant zonal differences at the 0.05 level
18
Southport
Juncus (n=10)
10.7:1: 2.6 2.1 :I: 0.1 7.6:1: 0.4 22.9:1: 1.0 50.5:1: 2.5 0.7:1: 0.02 5.1 :I: 0.1 3.1 ± 0.2
83.2:1: 3.8
86.3 ± 3.8 96.4:1: 0.2 12.0:1:1.4 5.3:1: 0.6 0.5:1: 0.07 0.9:1: 0.1 49.8:1: 6.0 28.8:1: 2.5
•
•
• ••
•
•
•
••
••
Spartina (n=5) 19.4±2.6 2.1 :I: 0.1 6.5 :I: 0.2 20.1 :I: 0.9 41.4 :I: 2.3 0.6 ± 0.02 5.1 :I: 0.1 2.4 :I: 0.170.1 ± 3.3
n.5:1: 3.4 96.7 ± 0.2 17.5:1: 1.9 13.5 :I: 1.5 0.9:1: 0.06 0.4 :I: 0.02 54.8:1: 4.4 20.4 :I: 1.0
The Southport marsh had significantly greater amounts of soil carbon and nitrogen than the Newport marsh, but only in the Spartina zone (Table 2). Additional marsh differences detected in the partitioned sample analysis showed the Southport marsh to have a greater C:N ratio in the lower 20-cm portions of the
Juncus
samples (23.1 + 0.7) versus the upper 10-cm portions (20.4 + 0.4) and greaternitrogen concentrations in the upper 1O-cm portions of the Spartjna samples (7.4 +
0.3) than in the lower 2O-cm portions (5.6
+
0.2 mg.g-1).No significant differences between zones were detected at either marsh with respect to soil carbon and nitrogen concentrations.
Only two significant depth differences were detected within a zone at either marsh. Soil carbon and nitrogen concentrations were greater in the upper 10 em of the Spartina zone at the Southport marsh (Table 3).
Soil texture
The Newport and Southport marshes differed in all textural categories (sand, silt, and clay) within each zone (Juncus and Spartina) with two exceptions: 1) % sand in the Juncus zone; and 2) % clay in the Spartina zone (Table 4).
Table 2. Comparison of the two marshes by zone (]uncus. Spartina) with respect to mean concentrations (mg·go1) ± 1 S.E. of
soil
carbon and nitrogen.Juncus
(n=10) Spartilla (n=5)Location
C N C:N C N C:N
Newport 146.9a* 6.8b 21.Sc 1l1.8d S.2f 21.7h
±17.2 ±0.8 ±0.3 ± 6.6 ±0.3 ±1.1
Southport 141.2a 6.3b 22.3c 138.7e 6.2g 22.4h
± S.9 ±0.2 ±0.4 ± 3.9 ±0.2 ±0.3
* Means followed by the same letter
are
not significantly different for between marsh comparisons.and location with respect to mean concentrations (mg· g.l) ± 1 S.E. of soil carbon and nitrogen.
Juncus
(n=IO) Spartina (n=5)Location
Carbon Nitrogen Carbon Nitrogen
Newport
Upper 10 em 142.3a* 6.2b 121.Sc 5.6d
±13.3 ±0.5 ± 9.9 ±0.2
Lower 20 em 151.4a 7.4b 102.lc 4.7d
±22.0 ±1.0 ± 4.4 ±0.4
Southport
Upper 10
em
146.8e 6.8f 157.4g 7.4i± 7.2 ±0.3 ± 2.5 ±0.3
Lower 20
em
135.8e 5.9f 119.9h 5.lj± 9.7 ±0.4 ± 5.3 ±0.2
Table 4. Comparison of the two marshes with respect to soil texture (I ± I S.E.) within a zone.
Juncus (n=IO) Spartjna (n=5)
Location
o/oSaDd %silt %clay %sand %si1t %clay
Newport 59a* 29b 13d 40f 40h 2lj
±4.0 ±2.7 ±1.4 ±3.2 ±2.3 ±l.O
Southport 6la 22c 17e 52g 27i 21j
±O.8 ±O.8 ±O.6 ±2.4 ±1.6 ±O.8
* Means followed by the same letter are not significantly different for between marsh comparisons.
always more sand than silt and more silt than clay within each zone at each marsh
site.
Biotic Factors
BiomMs
Aboveground biomass determinations made from clipping standing-live and
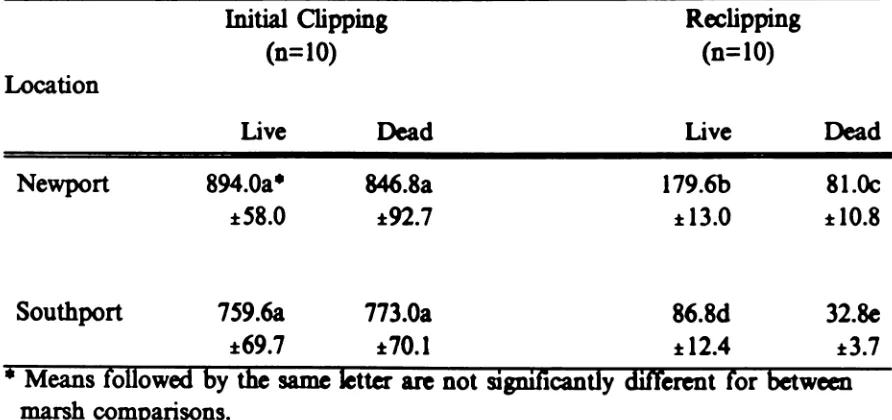
standing-dead leaves of JpnCUI did not differ significantly between the two marshes for live or dead leaves (Table 5). Biomass estimates obtained from reclipping 13
months later however were significantly greater for the Newport site.
There was no significant difTemwe in initial live and dead leaves at either
manh (Table S and Figures 12 and 14). Averaging over the transect canceled
individual plot
difTereDCeI.
The reclipping data, however, showed a significantly greater amount of live leaves over dead leaves at each marsh (Table S and Figures13 and IS).
Initial biomass estimates were significantly greater than the reclip estimates for live and dead leaves at each marsh (Table 5).
Other species invaded some of the clip plots after initial clipping. At
Southport, Spartjna invaded 4 of the 10 plots and although not included in the reclip
Table 5.
Location
Newport
Southport
Mean biomass (g.m-i :t 1 S.E. of aboveground live and dead
Juucusroemerianus at two North Carolina
marsh sitestaken during the
firstweek of
July1984
(initial)and 1985 (reclipping).
Initial
Clipping
Redipping
(n=10)
(n=10)
Live
Dead
Live
Dead
894.0a·
846.8a
179.6b
81.Oc
:t58.0
:t92.7
:t 13.0
:t 10.8
759.6a
773.0a
86.8d
32.8e
:t69.7
:I:70.1
:I:12.4
:t3.7
• Means followed
by
the
same letter are not
significantly
different for between
marsh comparisons.
-...
1&
.
~
....,
1;1 1;1..
& 0...
=
-,.
•
~'"
....,
1;1 11'1 It & 0...
=
1400 1200 1000 800 600 400 200 0•
Initial Live•
Ini tial Dead62.5 67.5 725 775 82.5 875 925 975 1025 1075 Dist.nce (m) From Open W.ter
Figure 12. Live and dead aboveground biomass from initial clipping (July 1984) at Newport marsh.
300
200
100
o
•
Recllpped live•
Recllpped Dead62.5 67.5 72.5 77.5 82.5 87.5 92.5 97.5 102.5 107.5 Dist.nce (m) From Open W.ter
Figure 13. Live and dead aboveground biomass from rec1ipping
1600
1400
; - 1200
,
~
1000-
III 800III
E
600 o...
m
400 200o
• Initial live
• Ini tial Dead
22.5 275 32.5 37.5 425 475 525 575 625 675 Dist . . ce (m) From Open W.ter
Figure 14. Live and dead aboveground biomass from initial clipping
(July 1984) at Southport marsh.
-c1
I
e
•~
-
III III..
e
0...
m 300 200 100o
•
Recllpped Live•
Recllpped Dead22.5 27.5 32.5 37.5 42.5 47.5 52.5 575 62.5 67.5 Dist .... ce (m) From Open W.ter
Figure 15. Live and dead aboveground biomass from redipping (July 1985) at Southport marsh.
and these species comprised only 4% of the rec1ipped biomass of this plot.
Density
Monthly leaf counts from the longevity plots revealed some differen~
between the two marshes as well as differen~ between the live and dead categories (Figure 16 and Table 6). Live leaf densities were consistently higher at Newport than
at Southport based on following plots 1-5 at each marsh for a year (Figure 16). Live
and dead leaf densities were also consistently higher at Newport than at Southport
when all plots were considered (Table 6). At Newport, the dead
leaf
densities were significantly greater than the live leaf densities; at Southport. this comparison was not significant.Lonaevity
Results of tagged young and mature leaves indicated differences in growth
(Figures 17, 18, 19, 20, 21, and 22). Data in these figures are composed of
cumulative numbers of young and mature leaves as influenced by mortality and are
intended to reflect patterns of growth in height.
~
..
...
11'1
c:
.,
Q
-rt
I
E
11'1
.,
•
"
.,
-
.,
•
...
-•
c:"
.,
E
-1000
800
600
400
200
0
•
Newport•
SouthportJAN FEB MAR APR MA Y JUN JUL AUG SEP OCT NOV DEC
MONTH
Figure 16. Live leaf densities averaged over plots 1-5 for one year
at each marsh.
Location
Newport
Southport
averaged over
all
plots for the entire study period.Live (n=130)
664&.
±18.S
S8Se
±14.2
Dead (n=13)
lOS6b
±96.0
Sl6c
tS2.3• Means followed by the same letter are not significantly different for between or within
manh
comparisons.140 120
..--'
•
•
•
~
..."
• •
"-.
•
e
•
•
~ 100 ow
..
..
CJI80
...
1/ ~ Young Leaves=
•
Mature Leaves-= 60
"
1/J:
40 20
S 0 N 0 J F M A M J J A S 0 N
"OMTH
Figure 17. Mean heights of young and mature leaves from longevity plots at the Newport marsh.
140 120
•
.
.-.
..."
....-
.
•
•
e
~•
~ 100 ow
..
~
CJI
80 Young Leaves
....
1/=
Mature Leaves-= 60
"
1/J:
40 20
S 0 N 0 J F M A M J J A S 0 N
"OMTH
Figure 18. Mean heights of young and mature leaves from longevity plots at the Southport marsh.
30
~ ~ Live
E 20
u ow
It 10
""
c: 0"
~ Uc: -10
"
It -20:z:
-30 -400 N D J F M A M J J A S 0 N
"ONT"
Figure 19. Mean monthly changes in the amounts of live and dead portions
of mature leaves at the Newport marsh.
40
30 - - - 0 - - Live
~
E 20
•
Deadu
ow
It 10
""
c:
"
0~
U
c: -10
"
It
:z:
-20 -30 -400 N D J F M A M J J A S 0 N
"ONT"
Figure 20. Mean monthly changes in amounts of live and dead portions
20 15
1"'\
10
e
~'oJ
5
•
'"
c: 0..
~ u -5 c:..
•
-10 E-15 -20
0 N 0 J F M A M J J A 5 0 N
"GNTH
Figure 21. Mean monthly change in the amounts of and live and dead portions of young leaves at the Newport marsh.
20 15
1"'\
e
~ 10'oJ
•
5'"
c:
--
0~
.U
c: -5
..
•
E -10 -15 -20
0 N 0 J F M A M J J A 5 0
"GNTH
Figure 22. Mean monthly changes in amounts of live and dead portions of young leaves at the Southport marsh.
32
material in a mature leaf began to occur in July (Figures 19 and 20). The maximum
height of mature leaves at the Newport marsh was greater than that at the Southport marsh, 125 em and 118 em, respectively.
Tagged young leaves exhibited a significant increase in height beginning in
March and tapering off in July (Figures 17 and 18). The maximwn height (100 em)
achieved by young leaves was the same at both marshes. Growth (positive mean
changes in amount of green) ceased in July and the rate of dieback increased (Figures
21 and 22). In addition to dieback occurring after cessation of growth, it was also
observed to oocur during periods of growth. For example, leaves which had not
reached maturity exhibited increases in growth and dieback during the same month
(Figures 21 and 22).
Leaves were initiated throughout the year and the time of initiation appeared
to influence a leafs longevity. Leaves initiated after the period of rapid growth
(March to July) do not mature and reach maximwn height as fast as leaves initiated
just before this period. Some of the young leaves tagged at the beginning of the
study were still alive after 12 to 16 months. Based on growth rates observed during
the study, the average age of a young leaf at the time of initial tagging was estimated
data for young leaves and mature leaves, a leafs longevity was estimated to be 21 to
27
months(1.75
to2.25
years).Species composition
Although no effort was made to quantify the importance of other species
present in the Spartina,
Juncus,
andfinu.s
zones, several times during the field study observations regarding the presence of other species along the transects were notedpresence.
Newport Zones· Southport Zones·
Species S J P S J P
Arundinaria &iiantea X
As1cI
subulatus X XBaccharis haJirnjfoIia X
Borrichia frutescens X
Distichljs spjcata X X
lkx
opaca Xlkx
yomitoria X XJuncus roemeriaous X X X X X
I,irnoniurn carolinjanurn X X X
Myrica cerifera X X X X
Persea
borbonia XfiJw
1acda
X X XQuercus vir~njana X X X
Sa1icomia europaea X
Sci.rpus robustus X
Spartina alterniflora X X X
Spartjna patens X X
DISCUSSION
Abiotic factors
The data presented indicate that Juncus can and does tolerate a wide range of
physical and edaphic conditions, many of which are related to soil drainage as a
function of elevation with respect to the tides. These differences in tidal range and
regime encountered at the two study sites produced dramatic differences in some of
the physical and edaphic factors.
The marshes were very similar in the range of soil pH values (6.4 to 6.7 at
Newport and 5.7 to 6.8 at Southport) obtained during the study. The differen~ in
pH (0.1 unit) detected between high and low tide measurements and between the
Spartina and JunCUS zones at each manh is so small that it is unlikely to be a major
factor affecting the zonation of Juncus or Sparlina. Hackney and de la Cruz (1978)
reported a slightly broader pH range (5.3 to 7.S) for a Mississippi marsh, but found no relationship between pH and community type. Ungar (1970) states that soil pH
appears to have little effect on plant distribution in certain halophytes.
Soil salinity has received more attention than any other factor considered to influence plant zonation in salt manhes (Mahall and Park 1976). Even though
neither of the marsh study sites showed a significant difference between high and low
tide soil salinities, tidal influence played a significant role in detennining salinities at
Juncus
zones, while these two zones were seldom flooded at the Newport site. Soilsalinities at the Newport site were more strongly influenced by groundwater from the
fiJws
zone. Researchers differ in their generalizations with respect to salinity gradients as one moves away from the seaward edge of the marsh. Some report anincrease to a maximum at or just above MHW and then a gradual
decrease
(Kurz and Wagner 1957) while others report only a gradual decline (Ganong 1903;Penfound and Hathaway 1938; Reed 1947). My results suggest that soil salinity
gradients are site specific. Since the Juncus and Sparlina zones at Southport were
regularly flooded by the tides, soil salinities varied between 15 and 23 ppt and no
significant differences between the zones were
detected.
Juncus is able to survivethese salinities by transporting excess chloride to the growing leaves resulting in
their
progressive dieback (Hodson 1971). Similar fmdings were reported by Adams (1963)
and Shiflet (1963). At Newport, the strong influence of groundwater from the
fiJws
zone and the lack of regular tidal inundation are probable explanations for the
significantly lower soil salinities
detected
in the JunCUS zone.Livingston (1987) points out that field data taken at monthly intervals serve
as good indicators of general annual trendS, however, high variability factors (e.g.
salinities from day to day as reported by Mahall and Park (1976).
On the average, the water table remained very close to the sediment surface all along the transect at each marsh. Since high tide seldom flooded the marsh at Newport, the small difference detected between high and low tides may be due to measurement error. The Southport marsh, however, had a significantly higher water table at high tide due to the regular and frequent flooding associated with the high tides. The depth to the water table at the Southport site was more variable in the Spartina zone than in the Juncus zone because of the rapid drainage that occurs in the Spartina along the tidal gut. The water table at the Newport site, on the average, was higher in the Juncus than the Spartina due to the prevailing influence of groundwater from the landward side. Eleuterius and Eleuterius (1979) reported that exposure to dessication may be an important factor affecting zonation between Juncus and Spartina. Based on water table measurements, Juncus is no more exposed to dessication than Spartina at my study sites due to regular tidal flushing at the Southport site and a strong groundwater influence at the Newport site.
o Chapman (1940a) felt inundation was the most important factor affecting
Southport site, high tides regularly exceeded the mean elevation of the marsh and
exerted a strong influence on salinity and water tables. Another aspect associated
with this frequency of flooding relates to potential for import and export. Due to the
infrequent tidal flooding, opportunity for import and export from the Newport marsh is limited to storm tides, whereas frequent tidal flooding at the Southport site allows for regular exchange of materials. These import/export difTeren~ between the two
marshes become more apparent with respect to the biotic factors discussed later.
Redox measurements in natural systems seldom represent true redox potentials but they are reproducible and therefore useful (Stumm and Morgan 1970; Bagander
and Niemisto 1978). Howes et al. (1986) found redox potentials to be the best indicator of aboveground biomass of Spartina alterniflora. Field studies have shown
an inverse relationship between redox potential and aboveground production (Howes
et al. 1981; Mendelssohn et al. 1981). It is logical to attribute the redox pattern observed at the Newport marsh to the freshwater influence from the landward end of the· transect in the absence of strong tidal influence. Figure 10 implies that the
influence of freshwater tapers ofT as one moves seaward in the JUDcus zone. This is
further supported by the salinity and water table data (Figures 4 and 6), which show
to have lower redox potentials.
The redox pattern observed at the Southport marsh is more typical of that of other marshes along the North Carolina coast (Appendix, Figures AI-AI2). Freshwater influence from the landward end of the transect has very little influence on redox potentials due to the strong tidal influence. As one moves landward from the Spartina zone, the tidal influence on redox potentials is diminished and redox potentials increase as would be expected. The decrease in redox potentials observed along the
Juncus-fiIma
transition can be explained by the lack of vegetation and the beginnings of a drainage pattern along the forest edge creating wetter conditions. The lack of vegetation and shading that occurs along the forest edge would result in less water loss from the sediments due to decreased evapotranspiration.The upper depths of the redox profIles on the average were less reduced than the lower depths even though water table measurements show that. the sediments remain saturated throughout most of the year. The explanation for this probably lies in the distribution of plant roots. Since most of the roots oocur in the upper I 0 ~
evapotranspiration could account for the difference observed between depths. Also, transport of oxygen into the root zone via the plants is known to occur in Spartina. Howes et al. (1981) and de la Cruz et al.· (1989) found the root zone to be less reduced than the sediments below it or unvegetated sediments.
the energy ftxed in this zone is cycled in situ (Hackney 1977).
Several differences existed between the marshes with respect to soil carbon and nitrogen. The greater amounts of soil carbon and nitrogen found in the Spartina zone at the Southport marsh suggest that this zone may be older than the Spartina zone at the Newport marsh. Craft et al. (1988) found greater amounts of macro organic matter in older transplanted marshes. The greater C:N found in the lower 20-cm portions of the partitioned Juncus samples at Southport is another indication that the Southport marsh may be older than the one at Newport. The greater concentrations of nitrogen in the upper 10-cm portions of the partitioned Spartina samples at Southport are probably related to decaying roots and microbial activity.
The fact that no signiftcant zonal differences with respect to soil carbon and nitrogen were detected at either marsh reflects the similarity oftidal influence between zones at each particular marsh (i.e., regular flooding of both zones at Southport and infrequent flooding of both zones at Newport).
near the surface. Bertness (1985) reported that fiddler crabs stimulate Spartina production by facilitating soil drainage which results in higher redox potentials and increased belowground plant debris decompostion. The concentration of nitrogen has been reported to increase during decomposition of marsh vegetation due to microbial proteins and exudates (de la Cruz and Gabriel 1974; Hackney and de la Cruz 1980). Some of the textural differences detected at the two marshes are related to their different locations with respect to the ocean and the influence of nearby rivers. The Southport marsh is located in a more dynamic setting (i.e., close to oceanic influence and the Cape Fear River). On the other hand, the Newport marsh is located in a more protected setting and the Newport River is not as dynamic as the Cape Fear River. But, when textural class category nomenclature is applied to the textural data, both Juncus zones would be sandy loams and both Spartina zones would be loams.
and more silt than clay. This pattern is what would be expected since heavier
particles fall out of suspension first. Since tidal and storm flooding are of such a
temporal nature little time is available for settling out of the fmer suspended particles.
As reported by Stout (1984) the physical environment on either side of the line
between Spartina and Juncus zones is not as distinct as the communities themselves.
From the abiotic data presented in this study, what appears to be an important factor
relative to vegetational zonation at one marsh seems to be unimportant at the other.
One reason is the wide range of tolerance exhibited by both species to environmental
variables studied.
Biotic Factors
The lack of difference in aboveground biomass of JuncuS between the two
marshes indicates a similarity in productivity. Yet, reclipping data suggest that the
Newport marsh may be more productive. Leaf densities (live and dead) were also
greater at Newport. These greater leaf densities are probably a response to the lower
salinities and lack of regular tidal flushing. The difference in dead leaf densities
between the two marshes is related to the frequency of flushing associated with the
different tidal regimes. The Newport marSh is not flooded as often and would be
expected to have more standing dead leaves, since removal via tides is infrequent.
event (e.g. storm) breaks them and removes them from the marsh. The greater
amount of live leaves versus dead leaves in the reclippings from both marshes and the
variety of heights suggest that the leaves live longer than 13 months and are initiated throughout the year. Biomass from initial clippings were significantly greater than
reclippings, indicating that the biomass present at a given time represents more than
one year's growth.
Even though Juncus was observed to grow year round, as reported by other
researchers (Eleuterius 1974; Williams and Murdock 1972), the greatest period of
growth occurred between March and July. Both young and mature leaves exhibited
increased growth at this time, however, the response in mature leaves was small.
From July to the end of the year, young and mature leaves underwent a similar
period of rapid dieback. Dieback begins at the tip of the leaf and progresses
downward. Dieback was not solely limited to this time period and was even observed
to occur during periods of growth. Since measurements were taken at monthly
intervals, it is uncertain whether dieback and growth were simultaneous.
Leaflongevity appears to be related to the time of initiation. Leaves initiated
before the period of rapid growth (March 'to July) mature and reach a maximum
growth. Post July temperatures can be extreme and often associated with droughts, resulting in higher salinities which reduce production.
The results of this study were used to estimate a leafs longevity at approximately 21 to 27 months. Eleuterius and Caldwell (1981) estimated leaf longevity at 14 to 16 months, while shoot and rhizome longevity were estimated at approximately 3 years (Eleuterius 1975). This longevity coupled with the ability of a leaf to remain standing long after death, suggests that Juncus marshes contribute only sporadically to the energy budget of the estuary. In a study of southern Florida estuaries, Heald (1969) concluded that
Juncus
contributed very little to overall estuarine productivity. The rate of decomposition is the limiting step in the detrital pathway and Juncus decomposes more slowly than Spartina (McKee 1977).Reimold et al. (1973) found
Juncus
detritus production in Georgia fell between that of tall and short forms of Spartina. BecauseJuncus
normally grows above regular tidal influence, high levels of deadJuncus
biomass remain on the marsh, decompose, and are incorporated into soil organic matter in place (Williams and Murdock 1968;Stout i984).
represented by only a few plants. Three of these species (Spartina alterniflora.
As1CI
subulatus. and Distichlis spicata) invaded the Juncus clip plots. The only significant
invader of the clip plots was the
Sa
altemiflora which comprised an amountequivalent to 17 to 75% of the rec1ipped biomass of some of the plots at Southport.
The plots that were most heavily invaded were the ones in depressions or near tidal
guts suggesting that Spartina was able to out compete the JunCUS in the wetter, more
saline sites once an opening was created by some form of disturbance. Whether or
not Spartina can maintain this advantage or be replaced by Juncus remains to be
SUMMARY AND CONCLUSIONS
Zonation of salt marsh vegetation as it relates to physical and edaphic factors was examined at two
Juncus
roemerianus marshes along the North Carolina coast. Additional aspects of the study included determination of leaf longevity and a comparison of leaf density, biomass, and regrowth of Juncus at the two marshes. Results imply that Juncus can tolerate wide fluctuations in many of the physical and edaphic factors, several of which are related to soil drainage.Soil pH and salinity do not appear to be major factors affecting vegetational zonation. Soil pH differences were small and zonal salinity differences at the two marshes were contradictory.
Tidal and groundwater influence were considered important with respect to their effect on sediment saturation. Tides were the driving force behind sediment saturation at Southport, but groundwater from the
fimls
zone was more important at NeWport.Generally, Juncus sediments were less reduced than Spartina sediments. These redox potential differences are a reflection of sediment saturation resulting from tidal frequency and duration of inundation. Also, the root zones in both vegetational zones were less reduced than the greater depths. Spartina is known to be capable of
wetland plants than presently known.
The most important abiotic factor appears to be sediment saturation, as a function of elevation with respect to tides and groundwater. Different degrees of sediment saturation account for many of the differences detected in the other abiotic factors.
Juncus
leaves were initiated throughout the year, but, the peak growth period occurs between March and July. Although time of leaf initiation affects growth and longevity, longevity was estimated to be 21-27 months. Leaflongevity, coupled with the characteristic of leaves remaining standing long after death, limit the export of organic matter fromJuncus
marshes, especially those marshes with infrequent tidal flushing.LITERATURE CITED
Adams, D. A. 1963. Factors influencing vascular plant zonation in North Carolina salt marshes. Ecology 44(3):445-456.
Adams, D. A. and T. L. Quay. 1958. Ecology of the Clapper Rail in southeastern North Carolina. J. of Wildl. Mgt. 22:149-156.
Bagander, L. E. and L. Niemisto. 1978. An evaluation of the use of redox measurements for characterizing recent sediments. Estuarine Coastal Mar.
Sci.
6:127-l34.Barr, A. J., J. H. Goodnight, J. P. Sall, J. T. Helwig. 1982. A User's Guide to SAS 82. Sparks Press, Raleigh, North Carolina.
Bertness, M.
D.
1985. Fiddler crab regulation of Spartina alterniflora production of a New England salt marsh. Ecology 66(3): 1042-1055._ _ _ _ _ . 1988. Peat accumulation and the success of marsh plants. Ecology 69(3):703-713.
Chapman, V. J. 1938. Studies in salt marsh ecology: Sections I to III. Jour. Eco1. 26:144-179.
1940a. Studies in salt marsh ecology: Sections . VI and VII.
Comparisons with marshes on the east coast of North America. Jour. Eco1. 28(1): 118-151.
_ _ _ _ _ . 1940b. Succession on the New England salt marshes. Ecology 21(2):279-282.
_ _ _ _ _ . 1960. Salt Marshes and Salt Deserts of the World. The University Press. Aberdeen. 392 pps.
E. A. McMahon (eds.), Coastal ecological systems of the United States, Vol. ll.
The Conservation Foundation, Washington, D.C.
_ _ _ _ _ . 1974.Salt marshes, p. 55-98. In H. T. Odum, B. J. Copeland, and E. A. McMahon (eds.), Coastal ecological systems of the United States, Vol. ll. The Conservation Foundation, Washington, D.C.
Craft, C.B., S. W. Broome, and E. D. Seneca. 1988. Nitrogen, phosphorus, and organic carbon pools in natural and transplanted marsh soils. Estuaries 11 :272-280.
Critcher, T. S. 1967. The wildlife values of North Carolina's estuarine lands and waters. N. C. Wildlife Res. Comm. 4 pps.
DeLaune, R. D., C. N. Reddy, and W. H. Patrick, Jr. 1981. Organic matter decomposition in soil as influenced by pH and redox conditions. Soil BioI. Biochem. 13:533-534.
DeLaune, R. D., C. J. Smith, and W. H. Patrick, Jr. 1983. Relationship of marsh elevation, redox potential, and sulfide to Spartina alterniflora productivity. Soil
Sci.
Soc.Am.
J. 47:930-935.DeLaune, R. D., C. J. Smith, and M. D. Tolley. 1984. The effect of sediment redox potential on nitrogen uptake, anaerobic root respiration, and growth of Spartina alterniflora Loisel. Aquatic Botany 18:223-230.
de la Cruz, A. A. and B. C. Gabriel. 1974. Caloric, elemental and nutritive changes in decomposing
Juncus
roemerianus leaves. Ecology 55:882-886.de la
Cruz,
A. A., C. T. Hackney, and N. Bhardwaj. 1989. Temporal and spatial pateros of redox potential (Eh) in three tidal marsh communities. Wetlands 9:181-190.Eleuterius, L. N. 1974. The autecology of JUncus roemerianus. Ph.D. Dissertation, Miss. St. Univ., Mississippi State, 221 pps.
· 1976. The distribution of Juncus roemerianus in the salt marshes of
-North America. Chesapeake Science 17(4):289-292.
Eleuterius, L. N. and J. D. Caldwell. 1981. Growth kinetics and longevity of the salt marsh rush Juncus roemerianus. Gulf Res. Rept. 7(1):27-34.
Eleuterius, L. N. and C. K. Eleuterius. 1979. Tide levels and salt marsh zonation. Bulletin of Marine Science 29(3):394-400.
Fenchel, T. 1969. The ecology of marine microbenthos. Ophelia 6:1-182.
Funderburg, J. B., Jr. and T. L. Quay. 1959. Summer maritime birds of southeastern North Carolina. J. Elisha Mitchell Sci. Soc. 75:13-18.
Ganong, W. F. 1903. The vegetation of the Bay of Fundy salt and diked marshes. Botan. Gaz. 36:161-455.
Hackney, C. T. 1977. Energy flus in a tidal creek draining an irregularly glooded Juncus marsh. Ph.D. Dissertation. Mississippi State Univ., Mississippi State, MS.
Hackney, C. T. and A. A. de la Cruz. 1978. Changes in interstitial water salinity of a Mississippi tidal marsh. Estuaries 1(3):185-188.
_ _ _ _ _ .1980. In situ decomposition of roots and rhizomes of two tidal marsh plants. Ecology 61:226-231.
_ _ _ _ _ . 1982. The structure and function of brackish marshes in the north central Gulf of Mexico: a ten-year case study. Pages 89-107 in B. Gopal, R. E. Turner, R. G. Wetzel, and D. F. Whigham, eds. Wetlands ecology and management. Natl. Inst. Ecol. inti. Sci. Publ. Jaipur, India.
Hartman, J. M. 1988. Recolonization of small disturbance patches in a New England salt marsh. Am. J. Bot. 75(11):1625-1631.
Heald, R. J. 1969. The production of orgaiuc detritus in a south Florida estuary. Ph.D. Dissertation. Univ. of Miami. 110 pps.
potentials in a salt marsh: spatial patterns and interactions with primary production. Limnol. Oceanogr. 26:350-360.
Howes, B. L., J. W. H. Dacey, and D. D. Goehringer. 1986. Factors controlling the growth form ofSpartina alterniflora: feedbacks between aboveground production, sediment oxidation, nitrogen and salinity. Ecology 74:881-898.
Ingold, A. and D. C. Havill. 1984. The influence of sulphide on the distribution of higher plants in salt marshes. J. Ecology 72: 1 043-1 054.
Jaynes, M. L. and S. R. Carpenter. 1986. Effects of vascular and nonvascular macrophytes on sediment redox and solute dynamics. Ecology 67:875-882. Johnson, D. S. and H. H. York. 1915. The Relation of Plants to Tide-Levels.
Carnegie Inst. of Washington, Washington, D. C. Publ. No. 206.
Kurz, H. and K. Wagner. 1957. Tidal Marshes of the Gulf and Atlantic Coasts of Northern Florida and Charleston, S. C. Tallahassee. Florida State University Study 24:1-168.
Livingston, R. J. 1987. Field sampling in esturaries: the relationship of scale to variability. Estuaries 10(3): 194-207.
Mahall, B. E. and R. B. Park. 1976. The ecotone between Spartina foliosa Trin. and Salicornja viriinica L. in salt marshes of northern San Francisco Bay. III. Soil aeration and tidal immersion. J. Eco1. 64(3):811-819.
McKee, K. L. 1977. The decomposition of Spartina aIterniflora and Juncus rot;merianus. M.S. Thesis. North Carolina State University, Raleigh. 105 pps. Mendelssohn, I. A. 1978. Eco-physiological aspects of the height forms of Spartina
alterniflora in North Carolina: Nitrogen nutrition and soil waterlogging. Ph.D. Dissertation. North Carolina State Uni~ersity, Raleigh, N.C. 142 pp.
Miller, W. R. and F. E. Egler. 1950. Vegetation of the Wequetequock-Pawcatuck tidal marshes, Connecticut. Eco1. Monogr. 20: 143-172.
Nichols, G. E. 1920. The vegetation of Connecticut. VII. The plant associations of depositing areas along the coast. Bull. Torrey Bot. Club. 47:511-548.
Nixon, S. W. 1980. Between coastal marshes and coastal waters - a review of twenty years of speculation and research on the role of salt marshes in estuarine productivity and water chemistry. pps. 437-525 in Estuarine and Wetland Processes with Emphasis on Modeling. Peter Hamilton and Keith B. MacDonald, eds. Plenum Publishing Corp. New York.
Penfound, W. T. and M. E. O'Neal. 1934. The vegetation of Cat Island, Mississippi. Ecology 15:1-16.
Penfound, W. T. and E. S. Hathaway. 1938. Plant communities in the marshlands of southeastern Louisiana. Eco1. Monogr. 8:1-56.
Ranwell, D. S., E. C. F. Bird, J. C. E. Hubbars, and R. E. Stebbings. 1964. Spartina salt marshes in Southern England. V. Tidal Submergence and Chlorinity in Poole Harbour. J. Eco1. 52:627-641.
Redfield, A. C. 1972. Development of a New England salt marsh. Eco1. Monogr. 42:201-237.
Reed, J. F. 1947. The relationship of the Spartinetum dabrae near Beaufort, North Carolina, to certain edaphic factors. Am. MidI. Natur. 38: 605-614.
Reimold, R. J., J. L. Gallagher, R. A. Linthurst, and W. J. Pfeiffer. 1973. Detritus
pr~duction in coastal Georgia. Pages 217-228 in L. E. Cronin, ed. Estuarine Research, Vol. I. Acad. Press, New York.
Riggs, S. R. and M. P. O'Conner. 1974. Relict sediment deposits in a major transgressive coastal system. N. C. Sea Grant Publ. UNC-SG-74-04. Raleigh,
N. C. .