2
Swiss Federal Nuclear Safety Inspectorate (ENSI), Brugg, Switzerland
3
Stangenberg und Partner Ingenieur-GmbH (SPI), Consulting Engineers, Bochum, Germany
4
Basler & Hofmann AG (B&H), Consulting Engineers, Zürich, Switzerland
ABSTRACT
This paper focuses on outcomes of our collaborative work as consultants of the Swiss Federal Nuclear Inspectorate (ENSI) that participated in KARISMA benchmark project organized by IAEA. Structural, soil, and soil-structure-interaction (SSI) models of a reactor building at the Kashiwazaki-Kariwa Nuclear Power Station were developed, and the SSI modeling results were compared to actual signals recorded during the Niigataken-Chuetsu-Oki Earthquake (NCOE). Using the SASSI (System for Analysis of Soil-Structure Interaction) sub-structuring method, a standard-practice approach for SSI analysis, reasonable floor response spectra (FRS) were predicted. Using variations of the same models, non-linear behavior of the site and the reactor building were analyzed separately with increasingly amplified NCOE input signals (up to six times the original signal). Using the SASSI modeling approach, the dynamic stiffness and damping of the site were found to be relatively insensitive to high excitation in the low frequency range (<20 Hz). This lack of sensitivity may be partly due to the fact that the model does not capture extreme non-linear soil behavior, e.g. liquefaction, which would likely occur at such high excitation levels. Non-linear pushover analysis predicted that the reactor building should maintain global stability until excitation exceeds six times the provided NCOE accelerations.
INTRODUCTION
In 2008 the International Atomic Energy Association (IAEA) launched a benchmark project entitled KARISMA (KAshiwazaki-Kariwa Research Initiative for Seismic Margin Assessment). This project was created in response to the Niigataken-Chuetsu-Oki Earthquake (NCOE), which occurred on July 16, 2007, off the coast of Japan. The earthquake affected the Tokyo Electric Power Company (TEPCO) Tokyo Kashiwazaki-Kariwa Nuclear Power Station located just 16 km from the epicenter. As consultants of the Swiss Federal Nuclear Inspectorate (ENSI), we conducted soil-structure-interaction (SSI) analysis to predict the seismic response of one of the reactor buildings under NCOE excitation. Figure 1 shows a schematic of the modeled scenario; a stiff, rectangular structure deeply embedded in soft soil.
PREDICTION MODELS
Figure 1. Kashiwazaki-Kariwa Nuclear Power Plant Reactor Building Modeling Scenario.
Reactor Building Fixed-Base Analysis
Fixed-base analyses of the reactor building were performed in order to verify the accuracy of the SOFiSTiK and SAP2000 finite element (FE) models. Using the same information provided for the reactor buildings, independent models were developed as shown in Figure 2. Table 1 shows a comparison of the predominant Eigen modes of the B&H/ENSI 3D FE model (shown below) and the SPI preliminary stick model (not shown). Slight variation is due to the fact that the SPI stick model had point masses and limited degrees of freedom. Also, there is variation due to incomplete information provided for the reactor building, e.g. the location and thickness of auxiliary walls. Modeling teams had to make independent assumptions when information could not be provided.
Figure 2. Reactor Building FE Models (Left: SOFiSTiK FE Model by SPI, Right: Section View of SAP2000 FE Model by B&H/ENSI).
2 0.19 0.19 5.24 5.33 0.0% 0.8% 57.6 36.8% 0.0% 1.3%
3 - 0.17 - 5.76 - 0.4% - 15.7% - 2.8%
4 0.07 0.09 13.85 10.59 0.0% 0.8% 0.0% 0.1% 69.9% 7.2%
Table 1. Comparison of First Significant Eigen Modes.
* A modal analysis was not conducted for the SPI fixed 3D FE model; SPI values are taken from the modal analysis of a reactor building stick model
Ground Motions and Site Response
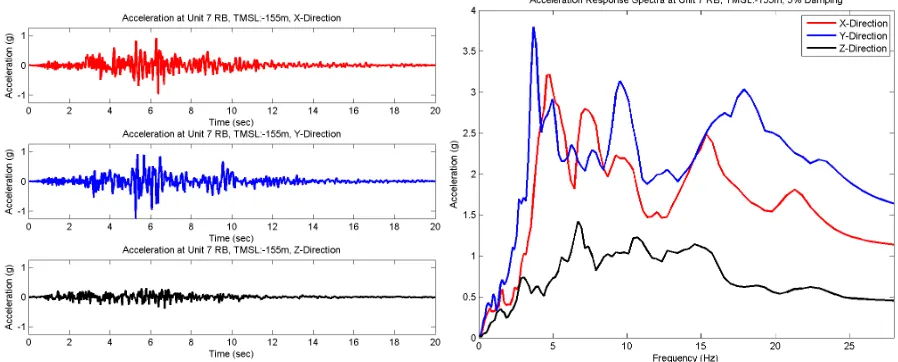
The assumed soil profile consists of a deep stratum of sand, clay, and soft rock. Figure 1 shows the low-strain shear wave velocity profile provided by the benchmark organizers. One-dimensional site response analyses were performed using the motions shown below in order to develop strain-compatible shear moduli and damping ratios. These motions, provided by the KARISMA organizers, were calculated from recorded signals and specified at the defined outcrop of engineering bedrock (OEB). The OEB is 155 m below the Tokyo mean sea level (TMSL) and 167 m below grade.
Figure 3. Acceleration Time Histories and Acceleration Response Spectra (ARS) (5% damping) of Input Motions.
SSI Parameters
Figure 4. ACS SASSI Quarter Symmetry Models (Left: Rigid Foundation, Right: Excavated Soil).
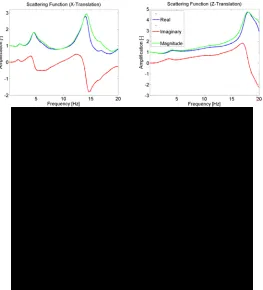
Scattering functions and foundation impedances were then generated in post processing by applying rigid-body constraints within the embedded foundation region. Figure 4 shows the foundation impedance functions (assuming a rigid foundation) normalized and plotted against dimensionless frequency aO = ω Vs / r, where Vs is the average shear wave velocity (Vs = 500 m/s) and r is half of the
respective foundation dimension (r = 27 m, 28.5 m).
Figure 6. Example Scattering Functions.
Best-Estimate SSI Analysis
1 10 Frequency [Hz] 0.1
1
S
a
[
g
]
Reference Analysis Best Estimate Anal
Measured
1 Frequency [Hz] 10
0.1 1
S
a
[
g
]
Reference Analysis Best Estimate Anal
Measured
Figure 7. FRS comparison at point FP2, 11.5 meters above grade (Left: X-direction, Right: Y-direction).
NON-LINEAR SOIL AND STRUCTURAL BEHAVIOR UNDER INCREASING EXCITATION
The SSI analysis method used in the first part of this study, SASSI, is a sub-structuring method that assumes linear-elastic behavior. The method does account for some soil non-linearity with strain-dependent shear modulus and damping curves, but it is still a linear calculation. In order to analyze non-linear soil and structure behavior under extreme seismic excitation, the soil and structure were analyzed independently.
Sensitivity of SSI Parameters to Increasing Excitation
A study was conducted using ACS SASSI to examine the variation of strain-dependent soil properties, impedance functions, and scattering functions under increasing seismic excitation. The input NCOE signals were again specified at the OEB, and incrementally amplified to generate four excitation levels, 1xNCOE, 2xNCOE, 4xNCOE, and 6xNCOE. For each excitation level, one-dimensional site response analyses were performed to develop strain-compatible shear modulus and damping ratios, as shown in Figure 8.
Figure 9. Soil Profiles and Impedance Functions for Varying Seismic Excitation (Y-direction similar).
Pushover and Non-linear Dynamic Analyses
A pushover analysis was conducted by SPI using a modified non-linear SOFiSTiK FE model. In this model, the primary reinforced concrete elements, i.e. the main shear walls, pool walls, reinforced concrete containment vessel (RCCV), and auxiliary shear walls were modeled as non-linear shear elements. These elements are consistent with rebar detailing and constitutive material laws provided by the KARISMA benchmark. All other members, i.e. floors, basemat, beams, columns, and steel roof structure) were modeled as linear-elastic. The horizontal load was applied separately in both principle directions as a uniformly distributed acceleration from the bottom of the basemat to the top of the roof. Pushover analyses were conducted for both a fixed-base model and a model considering flexibility of the underlying and surrounding soil. For the latter model, a collection of springs were chosen in accordance with the impedance functions derived for the various seismic excitations (examples shown in Figure 9) and applied over all basemat node points. Identical spring sets were used for the lowest excitation levels (1xNCOE, 2xNCOE, 4xNCOE), and a softer set of springs was used for the 6xNCOE excitation level to account for higher soil strains.
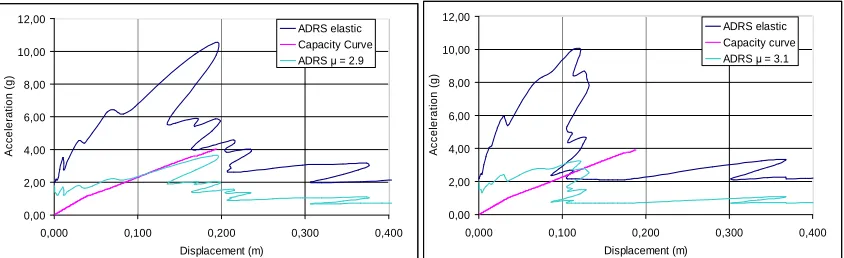
Figure 11 shows the capacity curve of the reactor building, in both X and Y directions, using a flexible boundary to account for SSI. The original force-displacement pushover curve was transformed into an acceleration-displacement response spectrum (ADRS) by simplifying the structure as an equivalent single-degree-of-freedom system. The capacity curve relates displacement of the reactor building 11.5 meters above grade to the acceleration at the basemat. The ductility demand for 6xNCOE was found through an iterative process to be 3.1 in the X-direction and 2.9 in the Y-direction. In Figure 11, the capacity curve is plotted against the elastic and inelastic demand curves, which are based on the 6xNCOE motion applied at the OEB. The results show that reactor building, at a level of 11.5 meters above grade, displaces 11.9 cm in the X-direction and 10.4 cm in the Y-direction during 6xNCOE excitation. Accordingly, the resultant shear force at the basemat is predicted to be 3,922 MN in the X-direction and 3,622 MN in the Y-X-direction.
0,00 2,00 4,00 6,00 8,00 10,00 12,00
0,000 0,100 0,200 0,300 0,400
Displacement (m) A c c e le ra ti o n ( g ) ADRS elastic Capacity Curve ADRS µ = 2.9
0,00 2,00 4,00 6,00 8,00 10,00 12,00
0,000 0,100 0,200 0,300 0,400
Displacement (m) A c c e le ra ti o n ( g ) ADRS elastic Capacity curve ADRS µ = 3.1
Figure 11. Reactor Building Performance Under 6xNCOE Excitation at TMSL -155 m (Left: X-direction, Right: Y-direction).
7.7 6.9 6.3 5.1 4.8 4.3 4.1 3.4 3.3 3.1 3.0 2 .7 2.5 2.4 2.4 2.4 2.2 2.2 2.2 2.2 2.2 2.1 2.0 1.8 1.8 1.6 1.4 1.4 1.4 1.4 1.3 1.2 1.2 1.1 1.1 1.0 1.0 0.9 0.9 0.8 0.8 0.8 0.8 0.8 0.8
0.7 0.7 0.5
0.5 0.5 0.4 0.4 0.4 0.4 0.3 0.3 0.3 0.2 0.2 0.2 0.2 0.2 0.1 0.1 13.0 12.4 8.5 8.3 7.5 7.1 6.9 6.1 5.0 5.0 4.1 3.3 3.2 3.1 3.0 3.0 2.8 2.8 2.7 2.7 2.7 2.2 2.2 2.1 2.0 1.8 1.8 1.8 1.6 1.5 1.5 1.5 1.3 1.3 1.0 0.9 0.9 0.8 0.8 0.7 0.6 0.5 0 .3 -0.3 0.3 0.2 0.2 0.1 0.1 0.1 0.1 0.1 0.0 0.0 0.0
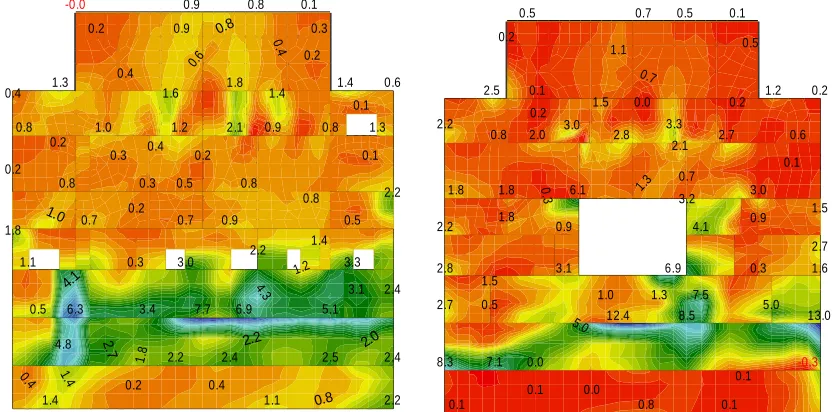
Figure 12. Two Example Exterior Walls Showing Maximum Steel Reinforcement Strain in ‰ under 6xNCOE Excitation at TMSL -155 m.
A High Confidence of Low Probability of Failure (HCLPF) value was derived, and also suggests global stability under extreme seismic excitation. For this calculation, the failure criterion was conservatively assumed to be a story drift limit exceeding 0.006 (based on an ASCE/SEI 43-05). The HCLPF value was defined as the peak ground acceleration (PGA) at OEB. Based on results of the non-linear time history analysis, a HCLPF value of 2.2g was estimated, which is about three times the maximum NCOE excitation.
SUMMARY AND CONCLUSIONS
REFERENCES
American Society of Civil Engineers (ASCE), (2005). “Seismic Design Criteria for Structures, Systems and Components in Nulcear Facilties,” ASCE/SEI 43-05, 2005.
International Atomic Energy Agency, (2012). "(Draft) Guidance Document Task 1: K-K Unit 7 R/B Structure SUBTASK 1.1: Construction and validation of soil and structure models", IAEA-EBP-SS-WA2-KARISMA-SP-002, Rev 05 02.15.2012.
Johnson, J.J. et al., (2010). “A Hybrid Method to Develop SSI Parameters for Rigid Embedded Foundations of Arbitrary Shape,” Proceedings of the ASME 2010 Pressure Vessels & Piping Division / K-PVP Conference, PVP2010-25350, Bellevue, Washington.
SOFTWARE
Computers and Structures Inc., SAP2000, Advance Release v. 14.2.4. (B&H/ENSI) Ghiocel Predictive Technologies Inc., ACS SASSI, Version 2.3 (B&H/ENSI) SASSI 2000, 2006 Version (SPI)