University of Windsor University of Windsor
Scholarship at UWindsor
Scholarship at UWindsor
Electronic Theses and Dissertations Theses, Dissertations, and Major Papers
10-1-2017
Thermal Modeling and Optimization of Lithium-Ion Batteries for
Thermal Modeling and Optimization of Lithium-Ion Batteries for
Electric Vehicles
Electric Vehicles
Maryam Ghalkhani University of Windsor
Follow this and additional works at: https://scholar.uwindsor.ca/etd
Recommended Citation Recommended Citation
Ghalkhani, Maryam, "Thermal Modeling and Optimization of Lithium-Ion Batteries for Electric Vehicles" (2017). Electronic Theses and Dissertations. 7260.
https://scholar.uwindsor.ca/etd/7260
This online database contains the full-text of PhD dissertations and Masters’ theses of University of Windsor students from 1954 forward. These documents are made available for personal study and research purposes only, in accordance with the Canadian Copyright Act and the Creative Commons license—CC BY-NC-ND (Attribution, Non-Commercial, No Derivative Works). Under this license, works must always be attributed to the copyright holder (original author), cannot be used for any commercial purposes, and may not be altered. Any other use would require the permission of the copyright holder. Students may inquire about withdrawing their dissertation and/or thesis from this database. For additional inquiries, please contact the repository administrator via email
Thermal Modeling and Optimization of Lithium-Ion Batteries for Electric Vehicles
by
Maryam Ghalkhani
A Dissertation
Submitted to the Faculty of Graduate Studies
through the Department of Electrical and Computer Engineering
in Partial Fulfillment of the Requirements for
the Degree of Doctor of Philosophy
at the University of Windsor
Windsor, Ontario, Canada
2017
Thermal Modeling and Optimization of Lithium-Ion Batteries for Electric Vehicles
by
Maryam Ghalkhani
APPROVED BY:
_____________________________________________
C. Wang, External Examiner
Wayne State University
______________________________________________
A. Fartaj
Department of Mechanical, Automotive and Materials Engineering
______________________________________________
M. Ahmadi
Department of Electrical and Computer Engineering
______________________________________________
R. Rashidzadeh
Department of Electrical and Computer Engineering
______________________________________________
M. Saif, Advisor
Department of Electrical and Computer Engineering
______________________________________________
G-A. Nazri, Co-Advisor
Department of Electrical and Computer Engineering
III
DECLARATION OF CO- AUTHORSHIP/PREVIOUS PUBLICATION
I. Co-Authorship Declaration
I at this moment declare that this thesis incorporates material that is the result of joint research.
This thesis contains the outcome of an investigation undertaken by me under the supervision
of Dr. Mehrdad Saif and Dr. Gholam-Abbas Nazri. The collaboration is covered in Chapters
3, 4 and 5 of the thesis. The measurements presented in chapter 3 were the results of
collaboration with Dr. Narayan Kar andmysupervisors Dr. Mehrdad Saif and Dr.
Gholam-Abbas Nazri. The mathematical models and simulation results presented in chapter 4, and 5
were the outcome of the research undertaken in collaboration with my lab colleague Farid
Bahiraei and my supervisors. In all cases, the key ideas, first contributions, experimental
measurements, simulation, data analysis, and interpretation, were performed by the author of
this thesis, and the input of co-authors was primarily through the provision of valuable
suggestions and help in the comprehensive analysis of the experimental results submitted for
publication.
I am aware of the University of Windsor Senate Policy on Authorship, and I certify that I have
correctly acknowledged the contribution of other researchers to my thesis,
and have permission from each of the co-author(s) to include the above material(s) in my
thesis. I certify that, with the above qualification, this thesis, and the research
IV
II. Declaration of Previous Publication
This thesis includes original papers that have been previously published/submitted
for publication in peer-reviewed conferences and journals, as follows:
Thesis Chapter Publication title/full citation Publication status
Chapter 3
M. Ghalkhani, G-A. Nazri, NC. Kar and M.Saif, Heat response of prismatic Li-ion cells, ITEC 2014
Published
Chapter 4
M. Ghalkhani, F. Bahiraei, G-A. Nazri and M.Saif, Experimental and Numerical Investigation of Electrochemical–Thermal Behavior of a Prismatic Lithium-Ion Battery, MRS 2016
M. Ghalkhani, F. Bahiraei, G-A. Nazri and M.Saif, Electrochemical–Thermal Model of Pouch-type Lithium-ion Batteries, Electrochimica Acta - Journal of Elsevier, 2017
Published
Published
Chapter 5
M. Ghalkhani, F. Bahiraei, G-A. Nazri and M.Saif, Modeling and Experimental Analysis of Lithium-ion Battery Key Parameters, Electrochimica Acta - Journal of Elsevier, 2017
V I certify that the above material describes work completed during my registration
as a graduate student at the University of Windsor.
I declare that, to the best of my knowledge, my thesis does not infringe upon anyone’s
copyright nor does it violate any proprietary rights and that any ideas, techniques, quotations,
or any other material from the work of other people included in my thesis, published or
otherwise, are fully acknowledged in accordance with the standard referencing practices.
Furthermore, to the extent that I have included copyrighted material that surpasses the bounds
of fair dealing within the meaning of the Canada Copyright Act, I certify that I have obtained
written permission from the copyright owner(s) to include such material(s) in my thesis. I
declare that this is an actual copy of my thesis, including any final revisions, as approved by
my thesis committee and the Graduate Studies office and that this thesis has not been
VI
ABSTRACT
This dissertation contributes to the modeling and optimization of Lithium-ion battery’s
thermal management for electrified vehicles (EVs). EVs in automotive technology is one of
the principal solutions to today’s environmental concerns such as air pollution and greenhouse
impacts.
Light duty and heavy duty EVs can decrease the amount of the pollution efficiently.
EV’s receive their power from installed rechargeable batteries in the car. These batteries are
not just utilized to power the car but used for the functioning of lights, wipers and other
electrical accessories. The Lithium-ion batteries (LIBs) have attracted a lot of research interest
in recent years, due to their high potential as compared to the conventional aqueous based
batteries, high gravimetric and volumetric energy density, and high power capability.
However, Li-ion batteries suffer from high self-heating, particularly during high power
applications and fast charging, which confines their lifetime and cause safety, reliability and
environmental concerns. Therefore, the first part of this study consists of the experimental
investigation of the charge-discharge behavior and heat generation rate of lithium ion cells at
different C-rates to monitor and record the thermal behavior of the cell. A further concern
regarding LIBs is strongly dependent on the quality and efficiency of battery thermal
management system. Hence, this is extremely important to identify a reliable and accurate
battery management system (BMS). Here in the second part, we show that thermal
management and the reliability of Li-ion batteries can be drastically improved using
VII Furthermore, a LIB is a compact system including high energy materials which may
undergo thermal runaway and explode the battery if overcharged due to the decomposition of
battery materials within the electrolyte and electrodes that generate flammable gaseous
species. The application of this kind of technology needs many laboratory experiments and
simulations to identify the fundamental thermal characteristics of the system before passing
it to the real use. An accurate battery model proposes a method to simulate the complex
situations of the system without performing time consuming actual tests, thus a reliable
scheme to identify the source of heat generation and required parameters to optimize the cell
performance is necessary.
For this reason, the latest phase of this research covers the development and comparison
of a model based on adjustable design parameters to predict and optimize battery
performances. This kind of model provides a relationship with the accuracy and simplicity to
VIII
DEDICATION
To my parents and sibling who always encouraged for higher studies and remembered me in
their prayers.
To my family and friends who provided emotional support throughout the period
of this research.
To all my teachers and mentors, who trusted me with my abilities, guided me and
IX
ACKNOWLEDGMENTS
First of all, I would like to thank Almighty God for His blessing, mercy upon me and His
support to complete this thesis. I would like to offer my heartiest gratitude to my supervisors
Dr. Mehrdad Saif and Dr. Gholam-Abbas Nazri for their invaluable advice, guidance, and
support on my research, without which, I could not have achieved this precious degree. I am
incredibly grateful to them for their academic, moral and emotional support. It has been a
great honor to learn from them and work with them. I have received persistent inspiration,
great advocacy, valuable suggestion, and compassionate attitude from them throughout my
research. I would also like to thank Dr. Majid Ahmadi, Dr. Rashid Rashidzadeh and Dr. Amir
Fartaj for serving on my committee, and helping me with their valuable suggestions and
contributions for the improvement of this work. I would like to thank Farid Bahiraei my
fellow graduate student and colleague of Battery Research Lab at University of Windsor for
sharing his thoughts and ideas and having a wonderful time throughout this research. I would
also like to acknowledge the support I have received from many teachers and staff members
of Department of Electrical and Computer Engineering, especially to Andria Ballo for her
administrative advice and support throughout the period of my research. I would like to thank
my friends who helped me academically or socially during my study at the University of
Windsor. Moreover, I would like to thank my parents for their consistent support and
X
TABLE OF CONTENT
Declaration of Co- Authorship/Previous Publication ...III
Abstract ... VI
Dedication ... VIII
Acknowledgments ... IX
List of tables ... XIV
List of figures ... XV
List of abbreviations ... XIX
Nomenclature ... XX
Chapter 1 ...1
Introduction and Literature Review ...1
1.1 Background ...1
1.2 Challenges in LIBs ...3
1.3 Motivation for This Dissertation ...5
1.4 Dissertation Objectives ...6
1.5 Dissertation Layout ...7
1.6 References ...9
Chapter 2 ...11
COMSOL Overview ...11
2.1 Introduction ...11
2.2 Materials ...12
2.3 The Geometry Node ...13
XI
2.5 The ODE and DAE Interfaces ...15
2.6 The Heat Transfer in Solids Interface ...17
2.7 Meshing...18
2.8 Study ...19
2.9 References ...20
Chapter 3 ...21
Heat Response of Prismatic Li-ion Cells ...21
3.1 Summary ...21
3.2 Introduction ...21
3.3 Geometry and operating conditions ...23
3.4 Experimental setup and results ...26
3.5 Conclusion ...31
3.6 Reference ...32
Chapter 4 ...33
Electrochemical–Thermal Model of Pouch-type Lithium-ion Batteries ...33
4.1 Summary ...33
4.2 Introduction ...34
4.3 Experimental Study ...38
4.3.1 Experimental setup...38
4.3.2 Experimental results...42
4.4 Model development ...47
4.4.1 Electrical model ...48
4.4.2 Thermal model ...52
XII
4.4.4 3D electrochemical –thermal model ...61
4.5 Conclusion ...72
4.6 Acknowledgments...73
4.7 Reference ...73
Chapter 5 ...77
Modeling and Experimental Analysis of Lithium-ion Battery Key Parameters ...77
5.1 Summary ...77
5.2 Introduction ...78
5.3 Experimental ...81
5.4 Model description ...86
5.5 Mathematical modeling ...89
5.5.1 Electrochemical Kinetic at the interface ...91
5.5.2 Charge conservation...91
5.5.3 Electron transport in the solid phase and lithium ion transport in the electrolyte phase...93
5.5.4 Mass conservation ...93
5.5.5 Energy balance ...94
5.5.6 Estimation of Battery State of Charge (SOC) ...96
5.6 Numerical method ...98
5.7 Results and discussion ...100
5.8 Conclusions ...125
5.9 Acknowledgement ...126
5.10 References ...127
Chapter 6 ...132
XIII 6.1 Summary of thesis...132
6.2 Suggested Future Work...133
XIV
LIST OF TABLES
Table 3.1. Physical properties of materials [9]. ... 27
Table 4.1. Specifications of the commercial LiNiCoAlO2. ... 39
Table 4.2. Model parameter in different regions. ... 42
Table 5.1. Characteristics of the LP6745135-10C-type LIB. ... 82
XV
LIST OF FIGURES
Figure 1.1. Several battery technologies comparison regarding volumetric and gravimetric
energy density [1]. ... 2
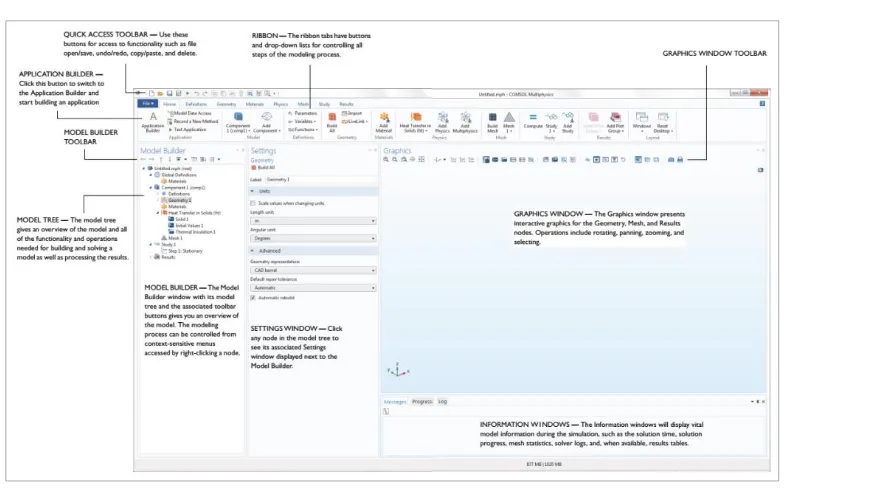
Figure 2.1. Screenshot from COMSOL desktop. ... 11
Figure 2.2. Add material, the batteries & fuel cells material library, and settings windows. 12 Figure 2.3. The geometry setting view. ... 14
Figure 2.4. The Lithium-ion battery node interface. ... 15
Figure 5.5. The ODE and DAE Interfaces windows. ... 16
Figure 2.6. The Heat Transfer in Solids Interface. ... 17
Figure 2.7. Adding, Editing, and Building Meshing Sequences. ... 18
Figure 2.8. Study configuration. ... 20
Figure 3.1. Multi-folded-layer structure of a prismatic cell [7]. ... 24
Figure 3.2. Two parallel Li-ion cells (GMB 654765). ... 26
Figure 3.3. Charge and discharge voltage profile for two parallel cells (C/2-rate). ... 27
Figure 3.4. Temperature behavior of the battery pack with two parallel cells (C/2 rate), graphs indicate thermal response of thermocouple at 1) close to the tab, 2) at the center, and 3) at the bottom of the cell. ... 28
Figure 3.5. Charge and discharge voltage profile of a single cell (C/2-rate) during first three charge and discharge cycles. ... 29
Figure 3.6. Temperature & voltage behavior of a single cell vs Time at C-rate. ... 30
Figure 3.7. Temperature & Voltage vs Time at C/2 rate for a single cells. ... 30
Figure 4.1. The stacked structure of the actual experimental battery with the pouch case. .. 40
Figure 4.2. The experimental setup with the measuring T-type thermocouples and voltage sensors attached to the batteries surface and tabs, respectively. ... 41
XVI (T2, orange lines), center (T3, red lines) and at the bottom of the battery (T4, yellow lines). ... 44
Figure 4.4. Current and voltage profiles versus time during charge and discharge containing a short rest period of 5 minutes at 0.8 C-rate. ... 45
Figure 4.5. Experimental data on the variation of battery voltage versus capacity for different discharge conditions in C-rate. ... 46
Figure 4.6. Schematic of a unit cell of the battery including positive and negative porous electrodes, a porous separator, and current collectors during charge and discharge process. 49
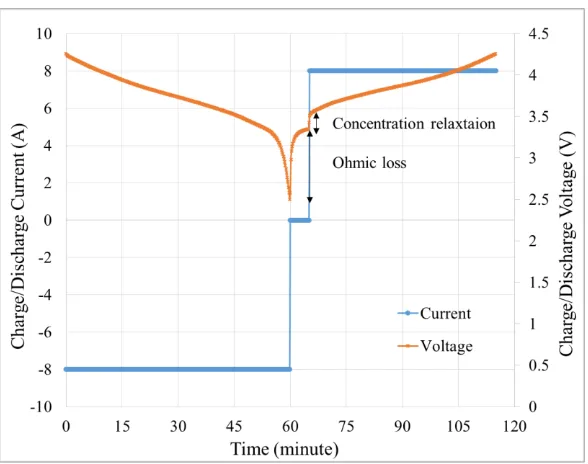
Figure 4.7. Charge/Discharge current and voltage at 0.8C as a function of time. ... 55
Figure 4.8. a) Comparison of over potential and electrolyte potential at the beginning and end of discharge. b) Electrolyte concentration outline at different times. ... 57
Figure 4.9. Local current density distribution within the battery during the discharge at various times. ... 58
Figure 4.10. Concentration distribution of lithium in the solid particle. ... 59
Figure 4.11. Comparison of simulation results to experimental during the discharge constant current at 0.5 and 0.8 C-rates. a) Variation of battery open circuit voltage versus time. b) Average surface temperature profiles of the battery. Symbols correspond to measured values and lines represent the calculated values. ... 62
Figure 4.12. a) Temporal evaluation of ohmic heat and entropic heat at the end of discharge process. b) The total heat generated within the battery during charge/discharge process. .... 64
Figure 4.13. a) Schematic of a single cell unit assembly. b) Geometry of the computational domain (electrode-separator stack) of a pouch-type 3D LIB consisting of 18 double layers cells. ... 65
Figure 4.14. a) The electrode current density vector within the battery (red streamlines) is shown the current enter into the negative tab and exit to positive tab during the discharge process (t=55 min). b) The electrode current density magnitude within the battery is shown using contours. ... 66
Figure 4.15. Electric potential distribution on the positive current collector during the discharge process at 0.8C: a) after 10 seconds, b) after 30 minutes, and c) after 55 minutes. ... 67
XVII and bottom of the battery) are shown to validate the time dependent temperature results obtained from the 3D model. ... 69
Figure 4.17. 3D model performance validation: a) calculated average surface temperature profile of the battery at 0.8C constant current is compared to experimental temperature measurement, b) calculated OCV voltage response of the battery during constant-current di discharge process at 0.8C rate validated by experimental OCV measurement. ... 71
Figure 5.1. a) The stacked structure of the original experimental battery with the pouch case. The cell is constructed from 40 double side coated plates making 20 cells connected in Parallel. b) Simplified schematic layout of a prismatic cell. ... 83
Figure 5.2. a) XRD analysis of anode and the cathode. b) XRD Reference for layered oxide cathode. ... 84
Figure 5.3. a) Current and voltage profiles versus time during charge and discharge containing a rest period of 30 minute at different C-rates. b) Characteristics of the cell voltage variation during discharge period and rest period. ... 85
Figure 5.4. a) Schematic of a unit cell of the battery including positive and negative porous electrodes, a porous separator, and current collectors during charge and discharge process. b) The electrical equivalent circuit of a cell including open-circuit-voltage, cell ohmic resistance Rint and Rp and Cp of the RC-circuit. ... 87
Figure 5.5. Comparison of simulation and experimental measured Cell voltage at various rates. The thin solid lines are displaying the simulation results, and the thicker connected markers are showing the experimental data; a) without film resistance, and b) with film resistance. ... 102
Figure 5.6. Comparison of measured OCV against time with simulation results at 0.5C and 1C rates during the discharge process. ... 104
Figure 5.7. a) Estimated total polarization (voltage difference) against time at different current rates. b) Calculated changing the trend of internal resistance at various current rates. c) Comparison of the experimental and simulated average cell temperature during different discharge rates. d) Effect of current rate on internal resistance and mean temperature evolution. ... 107
Figure 5.8. Electrolyte lithium concentration profile at 4C discharge rate: a) across the cell, b) at the positive electrode, c) at the negative electrode. c) Solid lithium concentration across the cell at 4C discharge rate. ... 110
XVIII Figure 5.10. Influence of various current value on total polarization and energy efficiency evolutions. ... 113
Figure 5.11. Effect of various initial SOC at 4C rate on: a) Discharge voltage and open circuit voltage characteristics, b) Total polarization, c) Internal resistance, and d) Energy efficiency... 116
Figure 5.12. a) Averaged internal resistance and polarization value at various SOC. b) Battery charge acceptance indicating the slope of recharge currents at different SOC levels. ... 117
Figure 5.13. Effect of different particle size value of the positive electrode material at SOC of 100%: a) polarization and b) Internal resistance evolutions. Effect of different porosity value of the positive electrode at various SOC on: c) polarization and d) internal resistance evolutions. The dashed lines are the original value from the experimental cell. ... 120
Figure 5.14. Variation of polarization and resistance as a function of: a) porosity and b) particle size. ... 122
XIX
LIST OF ABBREVIATIONS
Battery management system : BMS
Battery thermal management system : BTMS
Current collector : CC
Depth of discharge : DOD
Electrified vehicles : EVs
Electrochemical-thermal : ECT
Finite Elements Method : FEM
Hybrid electric vehicles : HEVs
Infrared Camera Incorporation : ICI
Lithium-ion batteries : LIBs
One-dimensional : 1D
Phase change material : PCM
State of charge : SOC
State of health : SOH
Three-dimensional : 3D
XX
NOMENCLATURE
A : battery surface area (m2)
𝑎𝑣 : active specific surface
𝑎𝑣,𝑑𝑙 : double layer area (m-1)
Bi : Biot number
𝐶𝑑𝑙 : electrical double layer capacitance (F.m2)
𝑐𝑠 : lithium concentration on the surface (mol.m-3)
𝑐𝑠,𝑎𝑣𝑔 : average species concentration (mol.m-3)
𝑐𝑠,𝑎𝑣𝑔,𝑐𝑦𝑐𝑙 : average cyclable lithium concentration (mol.m-3)
𝑐𝑠,𝑚𝑎𝑥 : maximum lithium concentration (mol.m-3)
𝑐𝑠,𝑠𝑢𝑟𝑓 : surface species concentration (mol.m-3)
𝑐𝑠,𝑠𝑢𝑟𝑓,𝑐𝑦𝑐𝑙 : cyclable surface species concentration (mol.m-3)
𝑐𝑙 : electrolyte salt concentration (mol.m-3)
𝑐𝑙,𝑟𝑒𝑓 : electrolyte reference concentration (mol.m-3)
𝐶𝑝 : heat capacity of the battery (J.kg-1 .K-1)
𝐶𝑅 : reduced species expression (mol.m-3)
𝐶𝑂 : oxidized species expression (mol.m-3)
𝐷𝑠 : Intercalation diffusivity (m2.s)
𝐷𝑙,𝑒𝑓𝑓 : effective electrolyte salt diffusivity (m2.s-1 )
𝐸 : specific energy (Wh.kg-1)
𝐸𝑒𝑞 : open circuit potential (V)
F : Faraday’s constant (C.mol-1)
∆𝐺 : Gibbs energy change (J.K-1 mol-1 )
h : convection heat transfer coefficient (W.m-2K-1)
ℎ𝑡𝑎𝑏 : tab’s height (mm)
𝑖𝑙 : electrolyte ionic current density (A.m-2)
𝑖𝑠 : electrical current density (A.m-2)
XXI
𝑖0 : exchange current density (A.m-2)
𝑖𝑡𝑜𝑡𝑎𝑙 : total interface current density (A.m-2)
𝑖𝑣,𝑡𝑜𝑡𝑎𝑙 : total electrode reaction current density (A.m-3)
𝑖𝑣,𝑚 : electrode reaction current density (A.m-3)
𝑖𝑑𝑙 : double layer current density (A.m-2)
𝑖𝑣,𝑑𝑙 : double layer current source (A.m-3)
K : ionic conductivity (S.m-1)
𝑘 : thermal conductivity (W.m-1.k-1)
𝑘𝑎 : anodic rate constant (m.s-1)
𝑘𝑐 : cathodic rate constant (m.s-1)
𝐾𝑇,𝑥 : thermal conductivity in the x direction (W.m-1.K-1)
𝐾𝑇,𝑦 : thermal conductivity in the y direction (W.m-1.K-1)
𝐾𝑇,𝑖 : thermal conductivity of different layers (W.m-1.K-1)
𝑙𝑐 : characteristic length (cell volume/surface area)
𝑀 : battery mass (kg)
n : the charge number pertaining to the reaction
𝑁𝑙 : flux of lithium ions
𝑃 : specific power (W.kg-1)
𝑞̇𝑒𝑛𝑡𝑟𝑜𝑝𝑦 : volumetric heat generation (𝑊. 𝑐𝑚−3)
𝑄𝑝𝑜𝑙 : polarization heat generation (𝑊. 𝑐𝑚−3)
𝑄𝑜ℎ𝑚 : ohmic heat generation (𝑊. 𝑐𝑚−3)
𝑄𝑟𝑒𝑎 : reaction heat generation (𝑊. 𝑐𝑚−3)
𝑞̇𝑒𝑛𝑡𝑟𝑜𝑝𝑦 : volumetric heat generation (𝑊. 𝑐𝑚−3)
R : gas constant, (J.mol-2 K-1)
𝑅𝑖𝑛𝑡 : internal resistance (mΩ)
𝑅𝑓𝑖𝑙𝑚 : film resistance (Ω.m2)
𝑟𝑝 : particle size (m)
𝑓± : average molar activity coefficient
XXII
𝑡 : time (s)
𝑡+ : transference number of lithium ions
T : cell temperature (K)
𝑇𝑎 : ambient temperature (K)
𝑉 : potential of each electrode (V)
𝑉𝑐𝑒𝑙𝑙 : voltage of Li-ion battery (V)
𝑉𝑜𝑐 : open circuit voltage (V)
𝑊𝑜𝑢𝑡 : energy output (J)
𝑊𝑖𝑛 : energy input (J)
𝑤𝑡𝑎𝑏 : tab’s width (mm)
Greek letters:
𝛼𝑎 : anodic charge transfer coefficient
𝛼𝑐 : cathodic charge transfer coefficient
𝜀𝑠 : electrode volume fraction
𝜀𝑙 : electrolyte volume fraction
𝜌 : density of the battery (kg.m3)
𝜌𝑖 : density of the different layers of the cell(kg.m3)
∅𝑠 : solid phase potential (V)
∆∅𝑠,𝑓𝑖𝑙𝑚 : solid phase film potential (V)
∅𝑙 : electrolyte phase potential (V)
γ : Bruggeman tortuosity exponent
𝜎𝑠 : electrical conductivity (S.m-1)
𝜎𝑠𝑒𝑓𝑓 : effective conductivities of the solid phase (S.m-1)
𝜎𝑙𝑒𝑓𝑓 : effective conductivity of the electrolyte phase (S.m-1)
η : local surface overpotential (V)
𝜂𝑒 : energy efficiency
1
CHAPTER 1
INTRODUCTION AND LITERATURE REVIEW
1.1 Background
Throughout the past few centuries, we have been dependent on fossil fuels to power our
industries, and transportation. The limited fossil fuel resources, and environmental issues
associated with the release greenhouse gases, as well as complexity of socio-political aspects
of fossil fuels, have forced the nations to search for a sustainable, affordable alternative energy
sources, and non-zero emission technologies.
Developing electric vehicles could decrease the amount of carbon dioxide in the
atmosphere since they can operate on clean and environmentally friendly energy sources.
Consequently, replacing the combustion engine powered by fossil fuel with the electric
vehicular technology provides a feasible solution to improve the global warming problem,
limits the emission of toxic hydrocarbons and its by-products in the atmosphere.
Considering the current transportation system based on combustion engine with very low
efficiency as one of the most polluting technology, the electric vehicles that run on energy
storage device such as battery may provide a practical solution as they are conceptually simple
and sound.
Lithium-ion batteries are one of the most promising technology since these systems have
2 system with long lifespan as compared with other battery technologies. Additionally, LIBs are
offering further advantages such as capability of rapid charging, and very low self-discharge.
Therefore, these traits are quickly developing LIBs as the preferred rechargeable battery and
maintain the dynamism of EVs [5-8].
One major advantage of lithium battery is that the lithium is the most lightweight metal
in the periodic table, as illustrated in Figure 1.1 and it has very high electrochemical potential
which can produce the greatest specific energy per weight. Hence, LIBs have properties of
high energy and power density against other types of batteries, and are well-suited for
automotive applications [5, 6, 9, 10].
3 The existing LIBs are in multiple forms such as coin, cylindrical, and prismatic types.
Prismatic LIBs have high potential power output and high packing factor than the other types.
Furthermore, the battery electrochemical materials in prismatic types are made in parallel
layers. Their large surface area offers an advantage in thermal management because of
minimum temperature gradient in the thickness of the battery which makes them well-suited
to particular automotive applications.
1.2 Challenges in LIBs
The strategy for electrifying vehicles with high power batteries is one of the most significant
challenges that call for the development of LIB technology. Since a lithium-ion battery is a
compressed energy storage device that contains high energy materials, it may generate high
heat during overcharge and at high power applications causing thermal runaway that leads to
cell explosion [11].
The active materials in the lithium ion battery are the negative electrodes that contains
carbonaceous material in most of the commercial lithium cells, and the positive electrode that
contains mixed transition metal oxides or metal phosphates and silicates.
Many studies have been devoted in discussing the performance of LIB's using different
cathode material. The common positive electrode material in lithium-ion batteries could be
Lithium manganese oxide LiMn2O4 (LMO), Lithium iron phosphate LiFePO4 (LFP), Lithium
cobalt oxide, LiCoO2 (LCO), Lithium nickel-cobalt-manganese oxide LiNiMnCOO2 (NCM),
4 The lithium ion battery materials are not highly conductive, and may induced Ohmic
losses, particularly at high current drainage. The ohmic drops in the matrix of active material
phases, contact resistances between the current collector and the porous active material, and
transport limitations of lithium ions in the electrode and electrolyte phases, causes restriction
of the power capability of the lithium iron [21].
The Lithium cobalt oxide has been used in the first Sony cells, and due to the high cost
of lithium cobalt oxide, a lower cost nickel oxide based cathode has been introduced. However,
due to instability of pure lithium nickel oxide, the mixed oxides cathode such as NCA has been
developed as a practical candidate for commercial cells used for EVs applications [20]. Since
the primary source of heat generation in the Li-NCA cells is the lithium transport in cathode,
the performance of the cathode electrode has to be improved by improving its electronic
conductivity. The thermal caracteristics of lithium batteries with different combinations of
anode and cathode have been reported. However, Newman introduced the first LIB thermal
modeling for the development of a battery thermal management system [13, 22].
The internal cell resistance is a dynamic [parameter and is influenced by several
parameters such as the state of charge (SOC), the cell initial temperature, and the current rate
of charge or discharge. The internal resistance is resulting from an electric current through an
ohmic resistive components of the electrode or the electrolyte which is significantly affect the
battery performance during the charge-discharge process [23]. Park was found the cell
component variables particularly the cathode thickness has the greatest impact on the charging
5
1.3 Motivation for This Dissertation
Although, the LIB is one of the technologies of choice for EV development in the coming
years; the battery-powered vehicles just could not satisfy the high energy/high power demand
and most EVs are limited in range. In addition, use of lithium ion battery for high power
application, such as vehicle start up, acceleration and hill climbing is challenging, due to its
issues with battery safety, durability, and cycle life.
The EV’s performance is essentially depending on the battery power/energy ratio. The
rechargeable lithium-ion batteries are still the most attractive proposition to be used in
high-performance EV’s as compared to other types of batteries, yet its operation restricted within
the safe and reliable operating temperature and voltage windows. The performance of the LIBs
diminishes in higher temperatures quickly, and its power capability is very limited at low
temperatures (<10C). The heat generation due to Joule heating inside the battery pack is much
greater at higher currents. Therefore, a dedicated battery thermal management system (BTMS)
is required to maintain the battery temperature within the desirable range to achieve the optimal
vehicle performance. This research is motivated by the idea to improve a fundamental
understanding of heat generation inside a battery and its effect on the battery operation, and
assign a proper temperature control, and cell design optimization using
electrochemical-thermal simulation.
To accomplish this aim, a series of modeling studies are developed to predict the transient
distribution of electro-thermal behavior of the battery at different operating conditions. The
6 amount of heat generation at the cell level. Accordingly, the model can be extended to a
module/pack level to compose a computationally effective multi-physics BTMS.
1.4 Dissertation Objectives
Thermal concerns of the electric vehicles are all associated with the battery performance.
Hence, a strong battery thermal models are required to predict the fundamental heat transfer
and heat distribution in the cell, cell performance characteristics in a wide temperature range,
to design an efficient thermal management system for variety of charge/discharge conditions.
The final mathematical model for BTMS design should be computationally affordable to be
applied for the development of cell, module and the battery pack.
The main objective of this dissertation is to describe and simulate the thermal response
of the prismatic LIB under real operating conditions at the various current rates to achieve an
optimal cell design.
More specifically, these purposes involve the following steps:
To develop experiment protocols to collect the data required for generating the
multi-physics models that can predict the battery performances.
To develop an in-depth perception of heat distribution of temperature and current
density profiles across the Li-ion batteries under various current loads.
To develop the interaction between the electrochemical and thermal behavior of Li-ion
7 To develop a computationally dynamic modeling approach from full numerical to
analytical models to optimized cell energy and power delivery that can be implemented
in BTMS design.
To provide experimental data base required for the modeling and validation of to
validate the proposed models, a battery testing procedure was used in the battery
laboratory of the University of Windsor.
The main components of the battery test-set are:
A battery cycler (MACCOR model 4300) for charge/discharge of the battery.
A small chamber to maintain the cell temperature within desirable range.
An Infrared Camera Incorporation (ICI) P9000 to capture real-time thermal images.
T-type thermocouples placed in different locations to measure the surface
temperature.
1.5 Dissertation Layout
This thesis provides a study of modeling and optimization of Lithium-ion battery’s thermal
management for EVs as follow:
The first chapter is introducing the research importance and the multiple objective
8 The capability and functionality of the COMSOL Multiphysics software to solve the
equations using the Finite Elements Method (FEM) have been introduced in the second
chapter.
A series of experimental studies have been performed to evaluate the battery performance
and its heat distribution rate at various current rates in chapter 3.
In chapter 4, the electrochemical-thermal characteristics of a battery have been studied
using a one-dimensional multiphysics model. The model has been extended to a
three-dimensional layer structure of the pouch-type cell to fully understand the distribution of
temperature and current density across the LIBs.
Chapter 5 discusses different prediction of the polarization and corresponding internal
resistance of the lithium-ion cell to predict cell energy and power delivery. The introduced
method presents the opportunity to obtain an optimal cell operation specifications.
Chapter 6 concludes this dissertation with a comprehensive review of the contributions
9
1.6 References
[1] J.-M. Tarascon, M. Armand, Issues and challenges facing rechargeable lithium batteries Nature, 414 (2001) 359-367.
[2] R. Heng, Z.M. Razlan, Review of the most recent literature on lithium-ion polymer battery for electric car, Int. J. Emerg. Technol. Adv. Eng, 5 (2015).
[3] M.R. Khan, M.J. Swierczynski, S.K. Kær, Towards an Ultimate Battery Thermal Management System: A Review, Batteries, 3 (2017) 9.
[4] E. Gümüşsu, Thermal Modeling of Lithium Ion Batteries, Fen Bilimleri Enstitüsü, 2017.
[5] D. Bernardi, E. Pawlikowski, J. Newman, A general energy balance for battery systems, Journal of the electrochemical society, 132 (1985) 5-12.
[6] T.M. Bandhauer, S. Garimella, T.F. Fuller, A critical review of thermal issues in lithium-ion batteries, Journal of the Electrochemical Society, 158 (2011) R1-R25.
[7] T.M. Bandhauer, S. Garimella, T.F. Fuller, Temperature-dependent electrochemical heat generation in a commercial lithium-ion battery, Journal of Power Sources, 247 (2014) 618-628.
[8] T. Stuart, F. Fang, X. Wang, C. Ashtiani, A. Pesaran, A modular battery management system for HEVs, SAE Technical Paper, 2002.
[9] Y. Chen, J.W. Evans, Heat Transfer Phenomena in Lithium/Polymer‐Electrolyte Batteries for Electric Vehicle Application, Journal of the Electrochemical Society, 140 (1993) 1833-1838.
[10] G.G. Botte, V.R. Subramanian, R.E. White, Mathematical modeling of secondary lithium batteries, Electrochimica Acta, 45 (2000) 2595-2609.
[11] K. Kumaresan, G. Sikha, R.E. White, Thermal model for a Li-ion cell, Journal of the Electrochemical Society, 155 (2008) A164-A171.
[12] G.-H. Kim, A. Pesaran, R. Spotnitz, A three-dimensional thermal abuse model for lithium-ion cells, Journal of Power Sources, 170 (2007) 476-489.
10 [14] N. Sato, Thermal behavior analysis of lithium-ion batteries for electric and hybrid
vehicles, Journal of power sources, 99 (2001) 70-77.
[15] H.-K. Kim, T.-Y. Seong, J.-H. Lim, W.I. Cho, Y.S. Yoon, Electrochemical and structural properties of radio frequency sputtered cobalt oxide electrodes for thin-film supercapacitors, Journal of power sources, 102 (2001) 167-171.
[16] A. Bernardes, D.C.R. Espinosa, J.S. Tenório, Recycling of batteries: a review of current processes and technologies, Journal of Power Sources, 130 (2004) 291-298.
[17] J. Chen, C. Yao, S. Sheu, Y. Chiou, H. Shih, The study of carbon half-cell voltage in lithium-ion secondary batteries, Journal of power sources, 68 (1997) 242-244.
[18] V. Srinivasan, J. Newman, Discharge model for the lithium iron-phosphate electrode, Journal of the Electrochemical Society, 151 (2004) A1517-A1529.
[19] L. Rao, J. Newman, Heat‐generation rate and general energy balance for insertion battery systems, Journal of the Electrochemical Society, 144 (1997) 2697-2704.
[20] S. Zhang, K. Xu, T. Jow, The low temperature performance of Li-ion batteries, Journal of Power Sources, 115 (2003) 137-140.
11
CHAPTER 2
COMSOL OVERVIEW
2.1 Introduction
The COMSOL Multiphysics 5.2a has been used to solve the equations using the Finite Elements Method (FEM). The screenshot reported in Figure 2.1 is what you will see when you
first start modeling in COMSOL Multiphysics using the Model Builder. The COMSOL Desktop® user interface provides a complete and integrated environment for physics modeling
and simulation as well as application design, providing with the tools necessary to build a
user-friendly interface for the models.
12
2.2 Materials
The Materials ( ) node under Global Definitions stores the material properties for all physics and all domains in a Component node. Any material involves many physical properties
including values or functions (for temperature-dependent material properties, for example) to
explain the material. The material properties were organized in material property groups,
which appear as sub-nodes under the Material node in the Model Builder. The material library and the setting windows have been represented in Figure 2.2.
The materials were accessible from the Batteries and Fuel Cells Material Library, and mostly default settings have been selected. The Lithium-Ion Battery connecting accounts for:
Electronic conduction in the electrodes.
13
Ionic charge transport in the electrodes and electrolyte/separator.
Material transport in the electrolyte, providing the foundation of the impacts of
concentration on ionic conductivity and concentration overpotential.
Material transport inside the spherical particles that form the electrodes.
Butler-Volmer electrode kinetics using experimentally measured discharge curves
for the equilibrium potential.
For the SOCs of the electrodes, both “Coulomb” and “at load” were defined in the
Lithium-Ion Battery interface. The “Coulomb” in contrast to “at load” omits the impact of any polarization in the battery. An Event interface has also been used to restrict the operation of the battery within the upper and lower cut-off voltages.
2.3 The Geometry Node
To define and create the geometry sequence a Geometry node ( ) utilized for the model component. The Geometry node also contains some general settings for the geometry such as
14
2.4 The Lithium-ion battery interface
The Lithium-Ion Battery (Li-Ion) interface ( ), situated under the
Electrochemistry>Battery Interfaces branch ( ) when adding a physics interface to compute the potential and current distributions in a lithium-ion battery. Multiple intercalating
electrode materials can be used, and voltage losses due to solid-electrolyte-interface (SEI)
layers are also included. The physics interface was based on the works of Newman et. al.
Ohm’s law was used to describe the charge transport in the electrodes, whereas concentrated
electrolyte theory for a quiescent aprotic (1:2) electrolyte has been used to describe charge and
mass transport in the electrolyte phase. An extra dimension was included in the porous
15 Fick’s law. Figure 2.4 shows the Lithium-ion battery node interface. Using the Initial Cell
Charge Distribution global node can define the initial cell voltage or cell state-of-charge (SOC)
of a battery cell. When used together with a Current Distribution Initialization study step, the
node will solve for the intercalated concentrations in the Porous Electrode nodes to comply
with the given initial conditions. The node also offers the possibility to balance the electrodes
by calculating the electrode phase volume fractions. The node only has an effect on the original
equations solved for when used in a Current Distribution Initialization study step. SOC and
porosity variables will be defined for all research levels.
2.5 The ODE and DAE Interfaces
The Global ODEs and DAEs (ordinary differential equations and
16 a physics interface, was used to add global space-independent equations that can represent
additional states.
The Global ODEs and DAEs interface have a Global Equations node that is designed for implementing this type of external equation. Such equations are often tightly coupled to a
model in a physical domain. The Global Equations node is also available for any of the physics
interfaces as shown in Figure 2.5.
17
2.6 The Heat Transfer in Solids Interface
The Heat Transfer in Solids ( ) interface has been used to model heat transfer in solids by conduction, convection, and radiation. A Solid model is active by default on all domains. All
functionality for including other domain types, such as a fluid domain, is also available as
presented in Figure 2.6.
The temperature equation defined in solid domains corresponds to the differential form
of the Fourier’s law that may contain additional contributions like heat sources. When this
version of the physics interface was added, these default nodes were added to the Model Builder: Solid, Thermal Insulation (the default boundary condition), and Initial Values. Then, from the Physics toolbar, add other nodes that implement, for example, boundary conditions and sources. To select physics features from the context menu can also right-click
Heat Transfer in Solids.
18
2.7 Meshing
Through adding a new Component to the Model Builder, a meshing sequence is added by
default in a Mesh node ( ). It is possible to add more meshing sequences to the Component by right-clicking the Component node and selecting Mesh. When a Component has more than one meshing sequence, they are collected under a Meshes node as shown in Figure 2.7. A mesh can be created by building a meshing sequence, which contains some meshing operations as
nodes in the sequence. For the default physics-controlled meshes, the software sets up the
meshing sequences automatically. Due to high nonlinearity of the governing equations, the
performance and accuracy of the calculation strongly depend on the mesh and solver. A free
quadrilateral mesh was used at the boundaries along with the swept method, and several mesh
densities were tested to ensure the mesh independency of the solutions of this research model.
19
2.8 Study
A Study node ( ) holds all the nodes that define how to solve a model. These nodes are divided into three broad categories:
Study steps, which determine overall settings suitable for a particular study type. The
study steps added are based on the chosen study types.
Solver Configurations, which contain the solvers and related configurations for dependent
variables to solve for, intermediate storage of solutions, and specific solver settings.
Job Configurations, which provide all jobs defined for a study (distributed parametric
jobs, batch jobs, and cluster computing).
A Parametric Sweep ( ) study has been used as illustrated in Figure 2.8 to find the solution to a sequence of stationary or time-dependent problems that arise when you vary some
parameters of interest. The parametric sweep can include multiple independent parameters
directly for a full multi-parameter sweep (solve for the first value of the first parameter
combined with all values of the second parameter. Then the second value of the first parameter
combined with all values of the second parameter, and so on, or could use a specified
combination of parameter values). Also, could add more than one Parametric Sweep node to
create nested parametric sweeps. The program then treats the parametric sweeps as a “nested
for-loop” and indicates the nested structure using indentations of the Parametric Sweep nodes’
names. To save the memory and time, the equations coupled by utilizing the segregated
approach. For each time step, the maximum relative tolerance for all variables has been
20 computations executed on a workstation of 64-bit Intel® Xeon® Processor 3.40E GHz
including 32GB random access memory.
2.9 References
21
CHAPTER 3
HEAT RESPONSE OF PRISMATIC LI-ION CELLS
This work was presented and published in IEEE Transportation Electrification Conference and Expo
(ITEC), 2014 IEEE, US, 24 July 2014.
3.1 Summary
The experimental studies of the charge-discharge behavior and heat generation rate of lithium
ion cells at different C-rates are conducted in this paper. We are extending this process to
monitor and control the thermal behavior of Li-ion batteries by using phase change material
(PCM) as a passive thermal management method to absorb and conduct heat to and from
lithium-ion battery modules.
3.2 Introduction
Electrification of vehicles may have a significant role in reducing consumption of fossil fuels
by up to 75% [1] and change the nature of automobile market. The performance of electric
vehicles strongly depends on the fulfillment of the battery pack. In general, temperature affects
several aspects of a battery performance including the operation of the electrochemical
reactions inside a battery, rates of charging and discharging, energy density and power
capability, cycle life and shelf life, battery safety and reliability, and battery cycle cost. The
22 battery on board of an electric vehicle. It is noteworthy to mention that in addition to the battery
chemistry, these concerns are strongly depended on the quality and efficiency of battery
management system. A lithium-ion battery is a compact energy storage device containing high
energy materials and may undergo thermal runaway and explode if overcharged, due to the
decomposition of cell components (electrolyte and electrodes) that generate flammable and
toxic gaseous species [2]. Also, heating the battery outside a normal range (10-45 ºC) may
accelerate the battery aging and severe capacity fading during charge-discharge cycles. In a
consumer market, only a few accidents due to battery problem may derail the research and
development efforts on hybrid and electric vehicle systems.
In this research effort, we address the thermal behavior of the lithium battery and predict
the possibility of using only phase change materials as a passive thermal control for the entire
battery pack. Further, this work may provide a guideline for the development of next
generation of PCM formulation capable of managing different hybrid and electric vehicles.
This work also may result in generating the specification of different PCM for batteries with
the different form factor and different power to energy ratios of the various electric-based
vehicles, such as mild hybrid, extended range plug-in hybrid, and fully electric vehicles.
The phase change materials are capable of absorbing/transferring heat from/into the
battery pack and maintaining an optimal temperature for efficient operation of battery cells.
The majority of current phase change materials are dealing with solidliquid phase
transformation. However, other combinations such as solidsolid in the combination of
various solidliquid formulations and the combination of multiple of PCMs are the subjects
23 simulation may provide a framework for the new formulation of PCM systems. The use of
such a passive thermal control may significantly reduce the overall cost of the battery pack for
electrified transportation.
Phase change composite material can be used to decrease cell-to-cell temperature
uniformity for various driving cycles. The addition of current PCM material may add a
significant thermal resistance barrier between the cell surfaces that prevent heat transfer from
cell-to-cell [3]. However, the heat transfer from inside to outside the battery pack also may be
reduced. In our future design, we will create PCM with a different formulation to serve as the
thermal barrier and facilitate the heat rejection to the exterior of the battery for waste heat
rejection.
While the thermal management of Li-ion batteries is essential to improve battery
performance [4], it may significantly widen the safety margin of electrified vehicles.
3.3 Geometry and operating conditions
To investigation and design of a thermal management system for any battery thermal modeling
is a vital tool. A Combination of thermal modeling and electrochemical modeling of the cell
yield a complete analysis, capable predict the thermal and electrochemical effects of the cell.
Newman and coworkers were started the first modeling of lithium-ion batteries [5,6].
Usually, the prismatic cells contain a jelly roll or a pile of electrodes as shown in Figure
24 The 1,800 mAh prismatic Li-ion battery (GMB 654765) considered in this study. The
common cathode/anode materials of a Li-ion battery are LiCoO2/C. Table 3.1 presented the
geometry details and properties of the GMB 654765.
The electrochemical reactions during the charge/discharge can be expressed as,
At positive electrode:
𝐿𝑖0.5𝐶𝑜𝑂2+ 𝑥𝐿𝑖++ 𝑥𝑒− ↔ 𝐿𝑖0.5+𝑥 + 𝐶𝑜𝑂2 (1)
At negative electrode:
𝐿𝑖𝐶6 ↔ 𝑖1−2𝑥𝐶6+ 2𝑥𝐿𝑖++ 2𝑥𝑒− (2)
Overal reaction:
2𝐿𝑖0.5𝐶𝑜𝑂2+ 𝐿𝑖𝐶6↔ 2𝐿𝑖0.5+𝑥𝐶𝑜𝑂2+ 𝑖1−2𝑥𝐶6 (3)
25 where through the discharge cycle the reversible reaction move from left to right and
during the charge cycle the reverse reaction takes place [8].
The generated heat caused by entropy change can be defined from [9],
𝑞̇𝑒𝑛𝑡𝑟𝑜𝑝𝑦 = −𝑖𝑇𝜕𝑉0
𝜕𝑇 = −𝑇∆𝑠
𝑖
𝑛𝐹 (4)
∆𝑠 = −𝜕∆𝐺
𝜕𝑇 = −𝑛𝐹
𝜕𝑉0
𝜕𝑇 (5)
where the Gibbs energy change is:
∆𝐺 = −𝑛𝐹𝑉° (6)
According to the process of (3) during the charge/discharge means the battery generates
heat that can be described as Equation (7) affected by the current flow across the cell [9].
𝑞̇ = 𝑖(𝑉0− 𝑉 − 𝑇𝜕𝑉0
𝜕𝑇) (7)
By considering the battery as a unit, the rate of energy change equation would be in the
following form:
𝑚𝐶𝑝𝜕𝑇
𝜕𝑡 = 𝑞̇ − ℎ𝐴(𝑇 − 𝑇𝑎) (8)
where 𝑚 = 𝜌𝑉 is the battery mass, 𝐶𝑝 is the battery heat capacity, ℎ is the convection
heat transfer coefficient that allows combining the effect of different cooling rates at different
stages of heat treatment, 𝐴 is the battery surface area and 𝑇𝑎is the ambient temperature. By
26 𝑚𝐶𝑝𝜕𝑇
𝜕𝑡 = 𝑖(𝑉
0− 𝑉 − 𝑇𝜕𝑉0
𝜕𝑇) − ℎ𝐴(𝑇 − 𝑇𝑎) (9)
3.4 Experimental setup and results
We test 1,800 mAh prismatic Li-ion cells using commercial battery cycler (MACCOR) at
different C-rates. These batteries will be utilized as the building block for construction of
module and packs in our initial simulation models.
We have tested two classes of flat prismatic lithium-ion cells at C/4, C/2, and C-rates for a
single cell and battery containing two parallel cells. Also, the tests were performed at various
temperatures for different C-rate. To measure and record the temperature behavior of the
27 various sections of the battery pack (#1 close to the tab, #2 in the center, #3 close to the bottom
of the cell) as shown in Figure 3.2.
Figure 3.3 shows the typical charge-discharge voltage profile for a battery pack at I=0.9
Ah between 2.5-4.7 V.
Table 3.1. Physical properties of materials [9].
Thickness (µm)
Height (mm)
Density (k.gm-3)
Thermal conductivity W.(m K)-1
Specific heat J.(kg K)-1
Electrical conductivity (x106, S.m-1)
LiCoO2 92 53 2291.62 1.85 1.1728 0.0001
LiC6 87 53 5031.67 5 0.7 0.0001
Al 10 55 2700 200 0.87 38
Co 10 57 9000 380 0.381 60
Separator 22 59 1200 1 0.7 1.0 –
Figure 3.3. Charge and discharge voltage profile for two parallel cells (C/2-rate).
0 1 2 3 4 5 6
0 100 200 300 400 500 600
28 Figure 3.4 indicates the sensitivity of the setup even at this low rate (C/2) and modulation
of temperature in the cell.
The heat generation close to the tab is higher than the temperature from other sections of
the cell as expected. This well-understood phenomenon is a great test for our set-up for future
work, higher rates, and higher Ah cells. Figure 3.5 shows the thermal behavior of a single cell
at a C/2 rate of a charge and discharge cycle. This preliminary test has shown the heat
generation inside the single cell, illustrated in Figure 3.6.
29 At this stage, we are confident on the performance and monitoring of the hardware for
testing cells. A much higher resolution is expected when cells are being tested at higher rates,
particularly for larger Ah cells.
Figure 3.6 illustrated a single cell at C-rate during charge the temperature rise close to
the tab was 7 oC, and during the discharge, the maximum temperature rise was 12 oC. The heat
dissipation in this condition is only by natural air convection via the spaces between the cells
and the battery container. The temperature rise at the center and close to the bottom of the cell
during charge/discharge respectively was around 6 oC, 7.5 oC, and 3 oC, 4 oC. The maximum
temperature was found above the center of the battery in this package.
30 Figure 3.6. Temperature & voltage behavior of a single cell vs Time at C-rate.
31 Figure 3.7 presented the temperature behavior of a single cell at the C/2 rate. During the
discharge time, the heat rise close to the tab of the cell was 6 oC, at the center 5.5 oC and close
to the bottom it was around 4 oC.
Concerning Figure 3.8 the temperature rise at C-rate is more significant compared to C/2
and C/4 rates. Therfore, the higher current magnitudes contribute to higher the Joule heating.
3.5 Conclusion
The thermal behavior of prismatic Li-ion batteries during charge/discharge cycles was
experimentally investigated. Firstly, a module consists of two parallel cells at C and C/2 rates
was examined. The temperature rises during the charge and discharge cycles were measured
to be roughly 6 ºC and 7 ºC, respectively. The results indicated that accumulation of the
temperature in regions close to the tab is higher than that in the center and close to the bottom
of the module. Therefore, uniform temperature module, which is widely used in the literature,
is not a realistic assumption. The thermal response of a single cell at C, C/2 and C/4 rates is
considered in the second step. The results revealed that the highest temperature occurs at
C-rate. The maximum temperature increment in the charge cycle was an about 7 ºC while; it was
12 ºC during the discharge cycle. The experimental data reported in the present study can be
utilized for designing high-performance thermal management systems for Li-ion battery
32
3.6 Reference
[1] D. Claus, "Materials and processing for lithium-ion batteries," J. of Miner. Metals Mater. Soc., vol. 60, pp. 43–48, 2008.
[2] T. Stuart, F. Fang, X. P. Wang, C. Ashtiani, and A. Pesaran, “A modular battery management system for HEVs,” Future Car Congress, doi: 10.4271/2002-01-1918, 2002.
[3] T. M. Bandhauer, Electrochemical-Thermal Modeling and Microscale Phase Change for Passive Internal Thermal Management of Lithium Ion Batteries, A dissertation presented to the academic faculty, Georgia Institute of Technology, USA, December 2011.
[4] S. Al-Hallaj, R. Kizilel, A. Lateef, R. Sabbah, M. Farid, and J. R. Selman, “Passive Thermal Management Using Phase Change Material (PCM) for EV and HEV Li-ion Batteries “, 7-9 Sept. 2005, Print ISBN:0-7803-9280-9.
[5] Doyle, Marc, Fuller, Thomas, Newman, John, “Modeling of galvanostatic charge and discharge of the lithium/ polymer/insertion cell”, J. Electrochem. Soc., 140 (6) (1993), pp. 1526–1533.
[6] L. Rao, J. Newman,” Heat-generation rate and general energy balance for insertion battery systems”, Volume 144, Issue 8, August 1997, Pages 2697-2704.
[7] Kim Yeow, Ho Teng, Marina Thelliez,” Eugene Tan3D Thermal Analysis of Li-ion Battery Cells with Various Geometries and Cooling Conditions Using Abaqus”, 2012 SIMULIA Community Conference.
[8] Williford R, Viswanathan V, Zhang J-G. Effects of entropy changes in anodes and cathodes on the thermal behavior of lithium-ion batteries. J Power Sources 2009;189:101–7.
[9] Dong Hyup Jeon , Seung Man Baek,” Thermal modeling of cylindrical lithium ion battery during discharge cycle”, Energy Conversion and Management 52 (2011) 2973– 2981.
33
CHAPTER 4
ELECTROCHEMICAL–THERMAL
MODEL
OF
POUCH-TYPE
LITHIUM-ION BATTERIES
This work has been published in Electrochemical–Thermal Behavior of a Prismatic Lithium-Ion
Battery, MRS conference 2016 and Electrochimica Acta - Journal – Elsevier, 2017
4.1 Summary
In this paper, a 3D (three-dimensional) layer structure of a pouch-type cell is modeled to
understand the distribution of temperature and current density across the pouch type
Lithium-Ion Battery (LIB). The electrochemical-thermal characteristics are studied, using 1D
(one-dimensional) multiphysics model, and simulation results are validated with experimental
results. Three-dimensional (3D) modeling of the battery gives the most efficient estimation of
energy density, temperature response, overall heat generation and distribution inside the
battery. One such 3D electro-thermal model was developed in this work, and the results
obtained by the 3D model were validated by using experimental results obtained from LIBs.
Temperature profiles of LIB obtained from 3D modeling indicated that the most heat is
accumulated around the positive tab of the battery due to non-uniform current distribution and
local internal resistance. The presented model can be used as a fast, yet accurate tool, to
optimize the cell design for a particular application and for developing battery thermal
34
4.2 Introduction
Electrification of vehicles may have a significant role in reducing consumption of gasoline to
one-fourth of today’s use. Lithium-ion batteries can provide a credible rechargeable storage
technology for the electrification of the drivetrain and to provide permanent storage solutions
to facilitate the efficiency of renewable energy sources [25].
Among the available battery technologies, LIB is expected to be the energy storage of
choice for EVs and hybrid electric vehicles (HEVs) due to their high energy density and long
lifecycle. On the other hand, LIB contains high energy materials and due to the decomposition
of battery components, particularly that of the cathode and electrolytes, and increased
reactivity of the anode when fully lithiated, may undergo thermal runaway if overcharged.
These decomposition reactions may result in inflammable and toxic gasses [11]. Also, heating
the battery outside a normal range (10-45 °C) may limit the energy and power of the battery,
and accelerate the battery aging causing severe loss of capacity during charge-discharge cycles.
While the thermal management of LIB is essential to improve battery performance [26], it may
and significantly extend the safety margin of hybrid and electric vehicles.
In general, the temperature has a significant impact on the chemical and electrochemical
reactions inside a battery, charging and discharging rates, energy density and power
capabilities, safety and reliability, and cycle lifetime of lithium-ion batteries.
It is crucial to extend the service life, safety, and reliability of the battery on board of an
![Figure 1.1. Several battery technologies comparison regarding volumetric and gravimetric energy density [1]](https://thumb-us.123doks.com/thumbv2/123dok_us/1371832.1169911/25.612.141.487.359.637/figure-battery-technologies-comparison-regarding-volumetric-gravimetric-density.webp)