University of Windsor University of Windsor
Scholarship at UWindsor
Scholarship at UWindsor
Electronic Theses and Dissertations Theses, Dissertations, and Major Papers
2011
Paleomagnetism and Rock Magnetism of "SEDEX" Zn-Pb-Cu Ores
Paleomagnetism and Rock Magnetism of "SEDEX" Zn-Pb-Cu Ores
in Black Shales in Australia and Yukon and of Fluorite Veins in
in Black Shales in Australia and Yukon and of Fluorite Veins in
Granite in Newfoundland.
Granite in Newfoundland.
Kazuo Kawasaki
University of Windsor
Follow this and additional works at: https://scholar.uwindsor.ca/etd
Recommended Citation Recommended Citation
Kawasaki, Kazuo, "Paleomagnetism and Rock Magnetism of "SEDEX" Zn-Pb-Cu Ores in Black Shales in Australia and Yukon and of Fluorite Veins in Granite in Newfoundland." (2011). Electronic Theses and Dissertations. 445.
https://scholar.uwindsor.ca/etd/445
This online database contains the full-text of PhD dissertations and Masters’ theses of University of Windsor students from 1954 forward. These documents are made available for personal study and research purposes only, in accordance with the Canadian Copyright Act and the Creative Commons license—CC BY-NC-ND (Attribution, Non-Commercial, No Derivative Works). Under this license, works must always be attributed to the copyright holder (original author), cannot be used for any commercial purposes, and may not be altered. Any other use would require the permission of the copyright holder. Students may inquire about withdrawing their dissertation and/or thesis from this database. For additional inquiries, please contact the repository administrator via email
Paleomagnetism and Rock Magnetism of "SEDEX" Zn-Pb-Cu Ores in Black Shales
in Australia and Yukon and of Fluorite Veins in Granite in Newfoundland.
By
Kazuo Kawasaki
A Dissertation
Submitted to the Faculty of Graduate Studies
through the Department of Earth and Environmental Sciences
in Partial Fulfillment of the Requirements for
the Degree of Doctor of Philosophy at the
University of Windsor
Windsor, Ontario, Canada
2010
iii
Declaration of Co-Authorship/Previous Publication
I. Co-Authorship Declaration
I hereby declare that this thesis incorporates material that is result of joint research, as
follows:
This thesis incorporates the outcome of joint research undertaken in collaboration with
Toby Dawborn under the supervision of Emeritus Professor David Symons. The
collaboration is covered in Chapter 3 of the thesis. In all cases, the key ideas, primary
contributions, experimental designs, data analysis and interpretation, were performed by
the author, and the contribution of co-authors was primarily the field works.
I am aware of the University of Windsor Senate Policy on Authorship and I certify that I
have properly acknowledged the contribution of other researchers to my thesis, and have
obtained written permission from each of the co-author(s) to include the above material(s)
in my thesis.
I certify that, with the above qualification, this thesis, and the research to which it refers,
iv
II. Declaration of Previous Publications
This thesis includes four original papers that have been previously published/will be
submitted for publication in peer reviewed journals, as follows:
Thesis Chapter Publication title/full citation Publication status
Chapter 2 Kawasaki, K., Symons, D.T.A., 2008.
Paleomagnetism of Fluorite Veins in the
Devonian St. Lawrence Granite, Newfoundland,
Canada. Canadian Journal of Earth Sciences,
45, 969-980.
Published
Chapter 3 Kawasaki, K., Symons, D.T.A., Dawborn, T.,
2010. Paleomagnetism of the world-class
Century Zn-Pb-Ag deposits, Australia. Journal
of Geochemical Exploration, 106, 137-145.
Published
Chapter 4 Kawasaki, K., Symons, D.T.A. Paleomagnetism
of the Mount Isa Zn-Pb-Cu-Ag and George
Fisher Zn-Pb-Ag deposits, Australia; Submitted
to Australian Journal of Earth Sciences, 28 Jun.
2010
Submitted
Chapter 5 Kawasaki, K., Symons, D.T.A. Paleomagnetism
of the Howards Pass Zn-Pb deposits, Yukon,
Canada; To be submitted.
To be submitted
v
certify that the above material describes work completed during my registration as
graduate student at the University of Windsor.
I declare that, to the best of my knowledge, my thesis does not infringe upon anyone's
copyright nor violate any proprietary rights and that any ideas, techniques, quotations, or
any other material from the work of other people included in my thesis, published or
otherwise, are fully acknowledged in accordance with the standard referencing practices.
I declare that this is a true copy of my thesis, including any final revisions, as approved
by my thesis committee and the Graduate Studies office, and that this thesis has not been
vi
Abstract
The paleomagnetic age dating technique is used to study the genesis of a fluorite
and four “sedimentary exhalative (SEDEX)” deposits which are hard to date by
conventional radiometric methods because they lack suitable minerals, which causes
controversy about their ore genesis. Paleomagnetic analysis of 359 specimens from the
Devonian St. Lawrence Granite and fluorite veins in Newfoundland shows that the granite
and fluorite veins are coeval and retain a primary remanence carried by pyrrhotite and/or
magnetite. The difference between the measured and expected paleopoles is attributed to
postemplacement counterclockwise rotation of ~17° of the area about a vertical axis
during the Late Devonian Acadian Orogeny. Paleomagnetic analysis of 333 specimens
from the Century Zn-Pb-Ag deposit in Australia isolates a stable characteristic remanent
magnetization (ChRM) for ore sites only that resides mainly in single (SD) or
pseudosingle domain (PSD) titanomagnetite and pyrrhotite. A positive fold test shows that
the ore’s ChRM predates D2 deformation in the Mesoproterozoic Isan Orogeny. The
paleomagnetic age of 1558±4 Ma supports a late diagenetic replacement model for ore
genesis. Paleomagnetic and rock magnetic analyses of 333 specimens from the Mount Isa
Zn-Pb-Cu-Ag and George Fisher Zn-Pb-Ag deposits in Australia isolate a stable ChRM
vii
shows that the ChRM postdates the ~1510 Ma D3 deformation in the Isan Orogeny. Thus
the ~1505 Ma paleomagnetic age provides a minimum age for the ores and an age for the
greenschist metamorphism during the orogeny. Paleomagnetic and rock magnetic
analyses of 339 specimens from six mineralized panels in the Howards Pass Zn-Pb
deposits in Yukon isolate a stable ChRM that mainly resides in SD or PSD pyrrhotite and
titanomagnetite. The paleopole falls on Middle Jurassic portion of the North American
apparent polar wander path (APWP) or corrected APWP for the Intermontane terranes,
giving ~170 Ma and ~162 Ma, respectively. The results indicate that the Selwyn Basin
had undergone ~35° clockwise rotation with ~10° northward translation between Middle
viii
Dedication
To my parents, Nobuo and Satoko Kawasaki, my spouse, Shiho Kawasaki, and our
ix
Acknowledgements
I gratefully thank my supervisor, Dr. David T.A. Symons, for his helpful
comments, guidance and thoughtful discussions. Dealing with him, I have improved my
understanding of paleomagnetism applied to hydrothermal deposits throughout my
master’s and doctoral studies. He has been extremely supportive, patient and showed me
how a researcher should be.
This research was funded through the Natural Sciences and Engineering
Research Council of Canada Discovery Grants to Dr. Symons, and University of Windsor
International Graduate Student and International Doctoral Tuition Scholarships.
I gratefully thank: Norman Wilson for his help in sample collecting in
Newfoundland; Zinifex Century mine (OZ Minerals Limited) for allowing access to the
Century deposit and sample collecting help; Xstrata Plc. for allowing access to the Mount
Isa and George Fisher deposits, and Eamonn Dare of Xstrata Copper and Rob Willis of
Xstrata Zinc and other staff members for their help in organizing sample collecting and
shipping; Selwyn Resources Ltd. for allowing access to the Howards Pass deposits, David
Legault for his help in organizing sample collecting, and other staff members of Selwyn
Resources Ltd. for their help in collecting samples.
x
and Mount Isa manuscript and giving me helpful comments and suggestions.
I would like to acknowledge all faculty and staff members in the department for
their support and guidance. I greatly thank Dr. Maria Cioppa for her constant help and
support throughout my studies. I also thank Drs. Iain Samson, William Baylis and Currie
Palmer for their help and guidance in successful completion of this thesis. Special thanks
to Ms. Sharon Horne, Dr. Denis Tetreault, and Ms. Melissa Price.
I would like to extend my gratitude also to my family for their continuous
support during my studies. My deepest gratitude to my beloved wife who supports me all
the time and shares this lifetime experience with me, and my profound love to our
adorable daughter Fua.
I would like to thank all my friends and colleagues who contributed to my
pleasant life in Windsor: Shanmugam Johari Pannalal, Birendra Sapkota, Ayca Yurtseven,
Juan Carlos Ordonez-Calderon, Neslon Campos-Alvarex, Yasser Abd El Rahman, Robert
xi
TABLE OF CONTENTS
DECLARATION OF CO-SUTHORSHIP / PREVIOUS PUBLICATIONS………III
ABSTRACT………..VI
DEDICATION...………..…VIII
ACKNOWLEDGEMENTS………...IX
LIST OF TABLES………...XVI
LIST OF FIGURES………...XVII
LIST OF ABBREVIATIONS & SYMBOLS………XXII
CHAPTER 1……….1
GENERAL INTRODUCTION 1.1 Background………1
1.2 Project Objective………2
1.3 Fluorite Deposit in the St. Lawrence Granite……….3
1.4 Sediment-hosted Zinc-Lead Deposits………....5
1.4.1 Century Zn-Pb-Ag Deposits……….6
1.4.2 Mount Isa Zn-Pb-Cu-Ag and George Fisher Zn-Pb-Ag Deposits………….7
1.4.3 Howards Pass Zn-Pb Deposits………..…9
1.5 Methodology and Principles……….11
1.5.1 Principle………...11
1.5.2 Equipment………...12
1.5.3 Sampling……….13
1.5.4 Demagnetization……….14
xii
1.5.6 Statistical Analysis………..15
1.5.7 Field Tests………18
1.5.8 Ore Concentrate………..19
1.6 References………20
CHAPTER 2………...35
PALEOMAGNETISM OF FLUORITE VEINS IN THE DEVONIAN ST. LAWRENCE GRANITE, NEWFOUNDLAND, CANADA 2.1 Introduction………..……35
2.2 Geology………36
2.3 Methods and Results………39
2.3.1 Sampling and Initial Measurements………39
2.3.2 Demagnetization……….….40
2.3.3 Contact Test……….42
2.4 Discussion………44
2.5 Conclusions………..51
2.6 Acknowledgements………..52
2.7 References………52
CHAPTER 3………...70
PALEOMAGNETISM OF THE WORLD-CLASS CENTURY ZN-PB-AG DEPOSITS, AUSTRALIA 3.1 Introduction………..70
xiii
3.3 Methods and Results………74
3.3.1 Sampling and Initial Measurements………74
3.3.2 Demagnetization………..75
3.3.3 Fold Test………..78
3.3.4 SIRM Acquisition Test………....79
3.3.5 Ore Concentrate………...81
3.4 Discussion………82
3.5 Conclusions………..85
3.6 Acknowledgements………..86
3.7 References………86
CHAPTER 4……….105
PALEOMAGNETISM OF THE MOUNT ISA ZN-PB-CU-AG AND GEORGE FISHER ZN-PB-AG DEPOSITS, AUSTRALIA 4.1 Introduction………105
4.2 Geology………..106
4.2.1 Regional Geology………..106
4.2.2 George Fisher………108
4.2.3 Mount Isa………...108
4.2.4 Radiometric Ages and Ore Genesis………...110
4.3 Methods and Results………...111
4.3.1 Sampling and Initial Measurements………..111
4.3.2 Demagnetization………111
xiv
4.3.4 Tilt Test………..114
4.3.5 SIRM Acquisition Test………..115
4.3.6 Ore Concentrate……….116
4.4 Discussion………...117
4.5 Conclusions………120
4.6 Acknowledgements………121
4.7 References………..122
CHAPTER 5……….141
PALEOMAGNETISM OF THE HOWARDS PASS ZN-PB DEPOSITS, YUKON, CANADA 5.1 Introduction………141
5.2 Geology………..143
5.2.1 Stratigraphy………...143
5.2.2 Regional deformation………144
5.2.3 Regional tectonics……….145
5.2.4 Ore genesis………147
5.3 Methods and Results………..148
5.3.1 Sampling and Initial Measurements………..148
5.3.2 Demagnetization………149
5.3.3 Tilt Test………..155
5.3.4 SIRM Acquisition Test………..156
5.4 Discussion………..157
xv
5.4.2 Apparent Polar Wander Path……….157
5.4.3 Regional Deformation and Metamorphism………...164
5.5 Conclusions………168
5.6 Acknowledgements………169
5.7 References………..170
CHAPTER 6……….191
SUMMARY 6.1 Fluorite Deposit in the St. Lawrence Granite……….191
6.2 Century Zn-Pb- Ag deposit……….192
6.3 Mount Isa Zn-Pb-Cu-Ag and George Fisher Zn-Pb-Ag deposits………...193
6.4 Howards Pass Zn-Pb deposits………194
6.5 Future Work………196
6.6 References………..199
xvi
LIST OF TABLES
Table 2.1. Site mean characteristic remanent magnetization directions (St. Lawrence)…60
Table 2.2. Carboniferous paleomagnetic poles from the northern Appalachians and
cratonic North America (St. Lawrence)………..61
Table 3.1. Site mean characteristic remanent magnetization directions (Century)…...92
Table 4.1. Site mean characteristic remanent magnetization directions (Mount Isa)…...127
Table 5.1. Site mean inclinations and drill core information (Howards Pass)………….178
xvii
LIST OF FIGURES
Figure 1.1 Geological map of the St. Lawrence area……….27
Figure 1.2 Locality map showing the location of the Howards Pass deposits…………...28
Figure 1.3 Location map for the Century, Mount Isa and George Fisher deposits………29
Figure 1.4 Geocentric axial dipole model………..…30
Figure 1.5 2G Enterprises 755R DC-SQUID superconducting rock magnetometer…….31
Figure 1.6 The fold test………..32
Figure 1.7 The paleomagnetic conglomerate test………...33
Figure 1.8 The baked contact test………...34
Figure 2.1. Major tectonic elements of Atlantic Canada………62
Figure 2.2. Geological map of the St. Lawrence area and geological setting of the fluorite veins at St. Lawrence……….63
Figure 2.3. Thermal step demagnetization from St. Lawrence area………..64
Figure 2.4. Vector directional density contour plots for thermal step demagnetization data from the fluorite veins………65
Figure 2.5. Unit mean characteristic remanent magnetization (ChRM) directions on the lower hemisphere of an equal-area stereonet……….66
xviii
area……….67
Figure 2.7. Pole position for the combined population of fluorite vein and granite site
mean directions on the apparent polar wander path (APWP) for North America….68
Figure 2.8. Carboniferous paleomagnetic poles from the northern Appalachians and St.
Lawrence Granite and fluorite vein………69
Figure 3.1. Location map for the Century mine and other major Zn-Pb-Ag SEDEX mines
in the Mt. Isa - McArthur basin of northern Australia………93
Figure 3.2. The Lawn Hill Formation stratigraphy, Century area………..94
Figure 3.3. Simplified geology of Lawn Hill region, showing the location of the Century
Zn-Pb-Ag deposit………...95
Figure 3.4. Sampling site locations in the Century ore deposit……….…96
Figure 3.5. Thermal step demagnetization from the Century deposit………97
Figure 3.6. Thermal and then alternating field (AF) step demagnetization of example
specimens of mineralization from the Century deposit……….98
Figure 3.7. Stereocontour plots for mineralized specimens from the north block on an
equal-area projections for thermal and then AF step demagnetization data………..99
Figure 3.8. A stereonet showing the site mean ChRM directions for the host rocks, the
xix
Figure 3.9. Fold test for the 13 mineralized zone sites from the Century deposit……...101
Figure 3.10. Saturation isothermal remanent magnetization intensity for example
specimens from the Century deposit………....102
Figure 3.11. Thermomagnetic heating curves for mine concentrates and tailings from
Century deposit………103
Figure 3.12. Pole position for the tilt-corrected unit mean ChRM direction of the
mineralized zones on the APWP for northern Australia………..104
Figure 4.1. Location map for the major black-shale-hosted Zn-Pb-Ag “SEDEX” mines in
the Mt. Isa - McArthur basin of northern Australia……….128
Figure 4.2. Simplified regional geology of the Mount Isa district………...129
Figure 4.3. A schematic stratigraphy of the Mount Isa basin………...130
Figure 4.4. Geologic cross sections of the George Fisher South mineralization and Mount
Isa mineralization……….131
Figure 4.5. Thermal step demagnetization and thermal and then alternating field step
demagnetization from the George Fisher and Mount Isa deposits………...132
Figure 4.6. Stereocontour plots for underground Mount Isa Cu mine specimens………134
Figure 4.7. A stereonet showing the in situ unit mean characteristic remanent
xx
Figure 4.8. Fold test for the 18 sites from Mount Isa district………..136
Figure 4.9. Saturation isothermal remanent magnetization (SIRM) intensity for example
specimens from Mount Isa district………...137
Figure 4.10. Thermomagnetic heating curves for Cu concentrate and tailings…………138
Figure 4.11. SIRM acquisition curves for Cu concentrate and tailings………139
Figure 4.12. a) Pole position for the unit mean ChRM direction on the younger part of the
apparent polar wander path (APWP) for northern Australia………140
Figure 5.1. Morphogeological belts of the northern Canadian Cordillera with "SEDEX"
Zn-Pb deposits and stratiform barite deposits………..180
Figure 5.2. Simplified regional geology of the Howards Pass district……….181
Figure 5.3. A schematic stratigraphy for the Howards Pass deposits………...182
Figure 5.4. Thermal step demagnetization, alternating field (AF) and then thermal step
demagnetization, AF step demagnetization, thermal and then AF step
demagnetization of example specimens from the Howards Pass deposits……...183
Figure 5.5. An equal-angle stereonet shows the intersecting core-magnetization-angle
method used in ChRM orientations………185
Figure 5.6. An equal-area stereonet showing the mineralized panel mean characteristic
xxi
the Howards Pass deposits………..186
Figure 5.7. Fold test for the 6 ore panels from the Howards Pass deposits………187
Figure 5.8. Saturation isothermal remanent magnetization (SIRM) intensity for example
specimens from the Howards Pass deposits………188
Figure 5.9. Pole position for the unit mean ChRM direction on the North American
APWP and corrected APWP for Intermontane Belt (IMB) terranes………..189
xxii
LIST OF ABBREVIATIONS & SYMBOLS
AF Alternating field
APWP Apparent polar wander path
ARM Anhysteretic remanent magnetization
CaF2 Fluorspar
CAI Colour alteration index
CD Clastic-dominated
ChRM Characteristic remanent magnetization
CMA Core-magnetization-angle
D Declination
DC Direct current
GAD Geocentric axial dipole
I Inclination
IGRF International geomagnetic reference field
IMB Intermontane Belt
IRM Isothermal remanent magnetization
k Precision parameter of Fisher (1953)
xxiii
MMVFTB Magnetic measurements variable field translation balance
MVT Mississippi Valley-type
N Number of sites
NRM Natural remanent magnetization
PSD Pseudosingle domain
SEDEX Sedimentary exhalative
SD Single domain
SIRM Saturation isothermal remanent magnetization
SQUID Superconducting quantum interference device
Th Thermal
Tp Peak homogenization temperature
VRM Viscous remanent magnetization
α95 Radius of cone of 95% confidence
δp Semi-axis for the oval of 95% confidence along the great-circle path
from site to pole
δm Semi-axis for the oval of 95% confidence perpendicular to that
great-circle path from site to pole
1
CHAPTER 1
General Introduction
1.1 Background
Paleomagnetism is the study of the Earth’s geomagnetic field preserved in rock
magnetizations through time and it has broad applications to many disciplines within the
Earth Sciences. The paleomagnetic age dating method has been applied to date ore
forming events of world-class economic deposits (e.g. Ueno and Tonouchi 1987; Symons
et al. 1993; Evans et al. 2001), although the early attempts at dating carbonate-hosted
Zn-Pb deposits (e.g. Beales et al. 1974) and black shale-hosted Zn-Pb deposits (e.g.
Jowett et al. 1987) using paleomagnetism were unsuccessful due to the lack of both a
well-defined apparent polar wander path (APWP) and sufficiently sensitive measuring
equipment. With the recent availability of sensitive cryogenic magnetometers and
well-defined APWPs, the paleomagnetic technique has proven routinely successful at
dating carbonate-hosted Mississippi Valley-type (MVT) Pb-Zn-F deposits (e.g. Leach et
al. 2001), which share many similar geologic characteristics with shale-hosted Zn-Pb-Ag
“sedimentary exhalative (SEDEX)” deposits (Leach et al. 2005b). Nonetheless the
2
of a fluorite deposit (Symons 1994) and twice before on “SEDEX” deposits (Lewchuk et
al. 2004; Symons 2007).
1.2 Project objective
Establishing the timing of ore mineralization in a deposit or district is the single
most critical piece of information that can guide the isolation of a correct genetic model
for an ore deposit type and for the exploration for similar undiscovered ore deposits
(Leach et al. 2001). Dating of fluorite and black-shale “SEDEX” ores has been seriously
hampered by the lack of suitable minerals in them for conventional radiometric age dating
methods. Without direct dates for the timing of ore mineralization, many genetic models
may be postulated with each constrained by different equivocal geological and
geochemical observations. This research project aims to provide reliable age dates for the
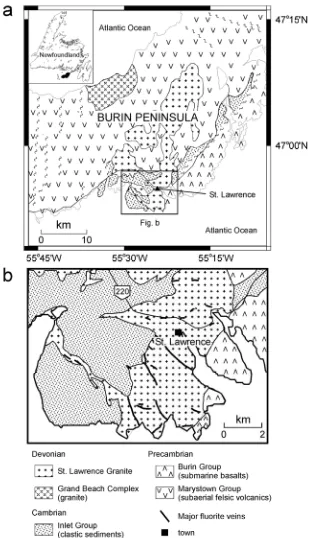
previously mined fluorite veins in the St. Lawrence Granite, Newfoundland (Fig. 1.1ab),
the black-shale Zn-Pb mineralization of the Howards Pass deposits in Yukon (Fig. 1.2),
and the Century Zn-Pb-Ag, Mount Isa Zn-Pb-Cu-Ag and George Fisher Zn-Pb-Ag
deposits in Australia (Fig. 1.3). Knowing these ages will not only allow testing of the
currently postulated genetic models for these mineralization types, but may also help to
3
1.3 Fluorite Deposit in the St. Lawrence Granite
Fluorite, commercially known as fluorspar (CaF2), has important uses in the
chemical, metallurgical and ceramic industries. Fluorite deposits are found in a range of
geologic settings and are formed by varied processes under different physicochemical
conditions. These deposits are mostly of two lithologic types: 1) those in sedimentary
rocks, dominantly carbonates; and 2) those found as veins in, or associated with,
dominantly alkaline-peralkaline igneous rocks that are akin to magmatic-hydrothermal
vein-type deposits (Strong et al. 1984).
Economically significant fluorite deposits in Canada are confined largely to
Newfoundland, Nova Scotia, Ontario and British Columbia. The fluorite at St. Lawrence,
Newfoundland, was discovered in 1843 (Collings and Andrews 1988), and more than
forty individual fluorite veins are known in the area (Fig. 1.1b). Most of these veins are
hosted by the St. Lawrence Granite and its outliers (Howse et al. 1983). The fluorite veins
constitute a major high-grade resource by world standards and are the premier known
fluorspar resource in Canada. During 44 years of operation until closure in 1978, the St.
Lawrence fluorspar mines produced >4.2 million tonnes (Mt) of ore. However, the
4
mineralization at a grade of 35% CaF2 (Howse et al. 1983; Collings and Andrews 1988).
There are two recognized groups of veins: a) high-grade veins that averaged ≤1 m in
width and contain ~95% CaF2; and, b) low-grade veins that averaged ~7 m in width and
contain ~70% CaF2 with 10 to 15% SiO2. Quartz (SiO2) is the most abundant gangue
mineral and sulphides, such as sphalerite and galena, are commonly associated with the
veins.
Van Alstine (1948) concluded that the fluorite came from the same magma
chamber as the granite, and that the ore fluids were released by late-stage differentiation,
forming fluorite veins along faults and shears as the granite cooled and contracted.
Similarly, Williamson (1956) concluded that the primary control on fluorite was the
fracture pattern developed due to the stress system produced by cooling of the granite.
Based on fluid inclusion, rare earth element and isotopic data, Strong et al. (1984) and
Collins and Strong (1988) presented genetic models in which fluorite deposition occurred
as a result of increasing pH caused by boiling of the magmatic fluid or the mixing of
cooled magmatic fluids with highly saline connate waters. Bell and Blenkinsop (1975)
reported a 4-point Rb/Sr whole rock isochron age of 315±10 Ma. Conversely, Irving and
Strong (1985) reported a 10-point Rb-Sr isochron age of 360±5 Ma. Kerr et al. (1993)
5
the granite formed as an integral part of Appalachian-cycle magmatism.
1.4 Sediment-hosted zinc-lead deposits
Sediment-hosted Zn-Pb deposits contain >50% of the world’s Zn and Pb reserves
in two broad subtypes, ie MVT and “SEDEX”. MVT deposits are the larger family of
carbonate-hosted deposits that are epigenetic and consist mainly of sphalerite, galena,
pyrite, dolomite and calcite. Sub-types of MVT deposits include the carbonate-hosted F
(±Ba, ±Zn, ±Pb) deposits and Irish-type deposits that are stratabound,
structurally-controlled, carbonate-hosted Pb-Zn deposits (Paradis et al. 2007)
“SEDEX” Zn-Pb deposits are a diverse group of ore deposits hosted by a wide
variety of carbonate and siliciclastic rocks that have no obvious associated magmatic
activity (Leach et al. 2005b). These deposits are mainly limited to two groups in terms of
age: a) a Proterozoic group, including the large deposits in the Mt.Isa-McArthur basin of
Australia (Large et al. 2005); and, b) a Phanerozoic group, including the large deposits in
the Selwyn Basin, Canada (Leach et al. 2005a). “SEDEX” deposits have traditionally
been considered to have formed by the precipitation of sulphide from warm fluids
discharged into seawater through fractures in the seafloor (Goodfellow et al. 1993; Leach
6
deposits are classified as vent-proximal or vent-distal based on the relative position of
these stratiform ores to the discordant feeder pipe, more than 80% of “SEDEX” deposits
are vent-distal (Sangster 2002). The vent-distal deposits are stratiform, concordant with
enclosing strata, and display well-developed internal layering. Many distal deposits, such
as George Fisher, Mount Isa, Century and Howards Pass, are regarded as typical distal
“SEDEX” deposits (Sangster 2002), although not all of them have necessarily formed by
sedimentary-exhalative processes (Large et al. 2005). Radiometric age dating of Zn-Pb
mineralization in these black-shale deposits has proven unsuccessful due to their colloidal
to ultrafine grain size.
1.4.1 Century Zn-Pb- Ag deposit
The Paleo- to Mesoproterozoic (Gradstein and Ogg 2004)) Mt. Isa-McArthur
basin of the North Australian craton contains four world-class black-shale-hosted
base-metal deposits (Mount Isa, George Fisher, Century and HYC) (Fig. 1.3). All four
deposits are generally classified as “SEDEX” deposits although they have not necessarily
formed by sedimentary-exhalative processes (Large et al. 2005). The Century Zn-Pb-Ag
deposit in the northwestern Queensland, Australia, is located on the Lawn Hill platform,
7
of 10.2% Zn, 1.5% Pb and 36 g/t Ag (Waltho and Andrews 1993; Broadbent et al. 1998).
The stratiform mineralization occurs in fine parallel lamellae in ~1595 Ma siderite-rich
siltstones and black shales of the upper Lawn Hill Formation in the Proterozoic
McNamara Group. The McNamara Group was deformed by the 1595-1500 Ma Isan
orogeny, which comprises three main deformation stages, D1, D2 and D3 (Blake et al.
1990; O’Dea et al. 1997; Broadbent et al. 1998).
Sulphide mineralization is concentrated dominantly in the black to dark gray
shale beds, and weakly observed in the siltstone facies. Sphalerite is the most common
sulphide with minor pyrite and galena (Broadbent et al. 1998). The shale and siltstone are
composed of fine-grained detrital quartz, illite and carbonaceous matter. Galena from the
deposit has given a Pb/Pb model age of ~1575 Ma. Broadbent et al. (1998) proposed that
the Century deposit was formed 800 to 3000 m below the basin floor during basin
inversion by late syndiagenetic replacement of organic-rich siltstone layers by fluids
emanating from the nearby Termite Range fault. However, there are other genetic models
such as the primary SEDEX model of McGoldrick and Large (1998) and the secondary
“fluid expulsion by far-field orogenic events model” of Oliver (1986).
8
The Mount Isa Zn-Pb-Cu-Ag and George Fisher Zn-Pb-Ag deposits in
northwestern Queensland, Australia, occur along a 25 km strike length of the ~1655 Ma
Urquhart Shale Formation in the Mount Isa Group (Page and Sweet 1998; Page et al.
2000). The Mount Isa Group is a 4.5-6.0 km thick sequence of carbonaceous and
dolomitic siltstones, mudstones and shales that exhibit greenschist facies metamorphism
(Large et al. 2005). The Mount Isa and George Fisher deposits contain 150 Mt of ore with
grades of 7% Zn, 6% Pb and 150 g/t Ag, and 108 Mt of ore with grades of 11.5% Zn,
5.4% Pb, 93 g/t Ag, respectively (Large et al. 2005). The Mount Isa deposit is also
comprised of a world-class sedimentary-rock-hosted Cu deposit, containing 225 Mt at
3.3% Cu (Perkins 1990) and subeconomic gold (<100 ppb) (McGoldrick 1986; Wilde et
al. 2006).
Lead model ages for both the Mount Isa and George Fisher Zn-Pb-Ag deposits
are ~1655 Ma (Sun et al. 1994), and an Ar-Ar biotite age has given ~1523 Ma age for Cu
mineralization in the Mount Isa deposit (Perkins et al. 1999). The Zn-Pb-Ag orebodies
occur as a series of stratabound sheets, whereas the Cu-Au orebodies occur in large
nonconformable breccia-hosted zones in a silica-dolomite alteration envelope. The
genesis of the stratiform Zn-Pb-Ag deposits in the Mount Isa district has been
9
emplacement of the Cu-Au and Zn-Pb-Ag ores. There are three alternative models: 1) the
Zn-Pb-Ag lenses formed during sedimentation (synsedimentary) whereas the Cu ores
formed much later during the Isan orogeny by syntectonic replacement (e.g., Chapman
2004); 2) Cu-Au and Zn-Pb-Ag mineralization are cogenetic and syntectonic during the
Isan orogeny (e.g. Perkins 1997); and 3) both Cu-Au and Zn-Pb-Ag ores formed early
during sedimentation and diagenesis in the upper tens of meters of sediment both on and
just below the sea floor (e.g. Smith 2000).
1.4.3 Howards Pass Zn-Pb deposits
The Selwyn Basin is an elongate Paleozoic marine basin represented mostly by
black shales and cherts, and it is one of the most potentially productive basins for
Zn-Pb-Ag “SEDEX” deposits in the world (Goodfellow and Lydon 2007). Within the
Selwyn Basin, there are three districts containing Zn-Pb-Ag deposits: 1) the Anvil District
in Late Cambrian strata; 2) the Howards Pass District in Early Silurian strata; and, 3) the
MacMillan Pass and Gataga Districts in Late Devonian strata (Goodfellow 2007). The
Howards Pass district is located in the Selwyn Mountains astride the Yukon-Northwest
Territories border and consists of the XY, XY Nose, XY West, Anniv Central, Anniv West,
10
deposits (Selwyn Resources Ltd. 2010). These Zn-Pb deposits occur in the “zinc corridor”,
a local second-order basin that is oriented northwest-southeast and extends for ~35 km
(Goodfellow 2004) that contains 115 Mt of ore with grades of 5.4% Zn and 2.1% Pb
(Goodfellow 2007). The Howards Pass Zn-Pb deposits are sheet-like stratiform sulphide
bodies that range up to 50m thick that extend for ~30 kilometers along strike. The
deposits are hosted in a sequence of Silurian calcareous chert, mudstone and limestone
with sphalerite, galena and pyrite as the major sulphide minerals (Goodfellow and
Jonasson 1986).
The Howards Pass deposits are currently thought to have formed from Zn- and
Pb- rich fluids that were discharged episodically into a stable, starved marine basin during
a period of restricted seawater circulation with resultant sulphidic, anoxic bottom waters
(Goodfellow and Jonasson 1986). Although the laminated sulphides are interpreted as
synsedimentary evidence, these features could be result of sub-seafloor hydrothermal
replacement (Leach et al. 2005b). Faults extend to depth up which mineralizing fluids
could have traveled and mineralized favorable horizons by replacement at depth. In
addition, bedded barite mineralization is found in both much younger and older Paleozoic
strata in the adjacent area (Dawson and Orchard 1982), indicating either a much younger
11
1.5 Methodology and Principles
Paleomagnetic methods used in this research include conventional paleomagnetic
techniques described in paleomagnetic text books (e.g. Tarling 1983; Butler 1992; Tauxe
1998; McElhinny and McFadden 2000). A brief description of the paleomagnetic methods
used for each research project has been given in their respective chapters, and brief
general descriptions of the theory of the paleomagnetic methods follow, mostly
paraphrased from these paleomagnetic texts.
1.5.1 Principle
The geocentric axial dipole (GAD) is a basic concept utilized throughout
discussions of paleomagnetic data and applications. In the GAD model, the Earth’s
magnetic field is considered to be produced by a single magnetic dipole at the centre of
the Earth that is aligned with the rotation axis, ie the geomagnetic and geographic axis
coincide, and therefore the magnetic field lines always point North (Fig. 1.4). A GAD
would produce lines of inclination that vary from -90° at the south magnetic pole to +90°
at the north magnetic pole with 0° at the equator. If the Earth’s field were a GAD field,
12
that when averaged over some 10000 years, the Earth’s magnetic field for the past few
million years has conformed to the GAD model, so that paleomagnetic results can be
applied to the study of geomagnetic field on a geological time scale. The inclination of
the magnetic field (I) is directly related to the paleolatitude (λ) for a field produced by
GAD with the equation [tan I = 2 tan λ]. This relationship between I and λ is often called
“the dipole formula” and is essential to understanding many paleogeographic and tectonic
applications, including dating ore deposits, when using paleomagnetism.
1.5.2 Equipment
A very sensitive cryogenic magnetometer operating inside a
magnetically-shielded room with an ambient magnetic field of ≤0.2% of the Earth's
magnetic field intensity is essential for the paleomagnetic dating of ore mineralization.
The Windsor paleomagnetic laboratory currently operates an automated 2G Enterprises
755R DC-SQUID superconducting rock magnetometer that is among the world’s most
sensitive (~2 × 10⁻⁶ A/m) and efficient magnetometers (Fig. 1.5). Because this
magnetometer completes a measurement cycle in 50 seconds, or about five times faster
than most DC-SQUID magnetometers, large collections of specimens can be tested. This
13
magnetization (ChRM) directions averaged, the smaller the age errors are likely to be
(Symons et al. 1996).
Room-temperature low-field magnetic susceptibility (χ) is measured with an
AGICO kappabridge KLY3-S susceptibility meter. The determination of susceptibility is
useful because it provides an estimate of the total magnetic content of a specimen.
1.5.3 Sampling
Collection of samples from suitable rock exposures is carried out by gathering
oriented samples using either a sun compass and/or Brunton compass. Samples are
collected either by drilling cores from an outcrop using a portable rock drill or by hand
sampling of blocks. Typically ~5 to 7 drilled-cores or ~3 to 4 hand-sampled blocks are
collected at a site and sampling is done at ~25 to 30 sites in the target geologic unit. The
drilled-cores are sliced in the laboratory into 10 to 15 cylindrical specimens, each 2.4 cm
diameter and ~2.20 cm long, per site. The block samples are drilled perpendicular to
bedding and then sliced into a comparable number of cylindrical specimens also. The
prepared specimens are stored for several weeks to several months in the
magnetically-shielded room with an ambient magnetic field of ~100 γ to allow their
14
substantially decay. All subsequent magnetic measurements are done without removing
the specimens from the shielded room.
1.5.4 Demagnetization
The natural remanent magnetization (NRM) is the magnetization in a rock
sample before any laboratory treatment and it is typically composed of more than one
magnetic remanence component. Partial step demagnetization techniques, ie alternating
field (AF) and thermal, are used to magnetically clean the NRM of its unstable and
unwanted VRM so that its ChRM component(s) can be isolated. When a rock specimen is
placed in an AF demagnetizer, the magnetic moments of grains (crystals) dispersed
throughout the specimen with coercivities of less than the peak value of the applied field
are weakly remagnetized in random directions as the intensity of the AF is reduced slowly
and uniformly to zero in the absence of a direct field, ie in a field-free space, leaving only
the more stable magnetization components with higher coercivities. The Windsor
Paleomagnetic Laboratory hosts a Sapphire Instruments (SI-4) AF demagnetizer with a
peak field of ~180 mT for AF demagnetization.
Thermal demagnetization involves heating a specimen to successively higher
15
and then cooling to room temperature after each incremental step in a zero magnetic field.
The progressive randomization of the lower unblocking temperature magnetizations
leaves the residual higher temperature components present in the specimen’s NRM.
Thermal demagnetization at Windsor is performed using a Magnetic Measurements
MMTD-80 thermal demagnetizer.
1.5.5 Mineral Magnetics
The magnetic mineral carriers of the stable ChRM components and their
effective grain size in a specimen are studied using saturation isothermal remanent
magnetization (SIRM) tests. SIRM analyses are done using a Sapphire Instruments (SI-6)
pulse magnetizer on a representative suite of lithologic specimens from the target unit.
The specimens are pulse magnetized in direct current (DC) fields in steps up to 900 mT
and then AF step demagnetizing in fields up to 140 mT. A method of plotting the SIRM
data for analysis has been discussed in detail by Symons and Cioppa (2000).
.
1.5.6 Statistical Analysis
The ChRM directions of the specimens are determined using a combination of
16
remagnetization circle analysis (Bailey and Halls 1984) and vector directional density
contour plots (Kamb 1959). Zijderveld diagrams, also called orthogonal projections, are a
set of two projections of the vectors, one on the horizontal plane and one on a vertical
plane. Principal component analysis is a quantitative technique for defining the ChRM
direction by determining the least-squares best-fit line through the scattered directions of
the decaying remanence vectors. When a specimen that contains more than one remanent
component is progressively demagnetized, the resultant direction of magnetization moves
along a great circle during the preferential demagnetization of lower coercivity or lower
blocking temperature component towards the stable ChRM direction. Remagnetization
circle analysis is useful when the ChRM is not obtained due to overlap in the stability
spectra of two components. When more than one great circle is available from different
specimens, then the great circles converge to estimate the ChRM direction.
The ChRM directions for each specimen, determined using partial step
demagnetization, are averaged to obtain the site mean direction, and then they are
averaged in turn to get the mean ChRM direction for the target geologic unit. Once the
ChRM direction(s) in each specimen is (are) determined, the site and unit mean directions
are calculated using Fisher (1953) or Bingham (1974) statistics. Fisher statistics requires
17
elongate distributions. In the case of specimens from unoriented drill cores, only
inclination data are available. Several approaches to analyse inclination-only data have
been addressed by Briden and Ward (1966), Kono (1980) and McFadden and Reid (1982).
The approach of Briden and Ward (1966) is not suited for computational ease. Conversely,
the approach of McFadden and Reid (1982) can be written into a computer program and
is a maximum likelihood estimate for true inclination, which less biased than that of Kono
(1980).
The unit mean ChRM direction and its dispersion are then used to calculate the
paleopole using the dipole equation, and the paleopole is compared to the APWP for the
plate or terrane carrying the unit to obtain the age. The APWP is based on numerous rock
units with known radiometric, paleontological and stratigraphic ages so that time can be
scaled along its length. The error limits on the age of the ChRM are derived from the
minimum and maximum ages scribed by either the 1σ or 2σ oval of confidence about the
pole. The well-defined APWP for North America is ranged between Eocene and
Ordovician although this path includes a mid-Cretaceous standstill which coincides with
Cretaceous Normal Superchron. Idnurm (2000) reported an APWP for northern Australia
18
1.5.7 Field tests
Laboratory step demagnetization experiments reveal the constituent magnetic
components of the NRM and ChRM directions. Blocking temperature and/or coercivity
spectra indicate whether or not the ferromagnetic grains carrying a ChRM are capable of
retaining a primary or secondary ChRM. Field tests of paleomagnetic remanence stability
can also provide crucial information about the timing of ChRM acquisition. Common
field tests of paleomagnetic remanence stability include the fold test (or bedding-tilt test)
(Fig. 1.6), conglomerate test (Fig. 1.7) and baked contact test (Fig. 1.8). Fold tests are
possible where oriented samples can be collected from a unit at sites with an appreciable
difference in bedding attitudes ie >20°. A fold test is useful for deducing the relationship
between the timing of ChRM acquisition and folding ie postfolding, synfolding or
prefolding, based on the change in the precision parameter (k) of Fisher (1953) before,
during, and after tilt correction (McElhinny 1964; McFadden and Jones 1981). The baked
contact test is useful for determining whether or not the studied lithology has undergone
pervasive secondary overprinting. When an igneous body is intruded, it heats the contact
zone of its host rock to above the Curie temperature of its magnetic minerals. The
maximum temperature reached in the baked zone decreases away from the intrusion and
19
baked zone gradually changes from that of the intrusion to that of the host rock. Such a
condition would argue against pervasive magnetic overprinting in the host rock or in the
intrusion since its emplacement, whereas if both retain the same ChRM, then it is likely
that both units were metamorphosed at some time after intrusion.
1.5.8 Ore concentrate
It is important in paleomagnetic age dating studies of ore deposits to test, if
possible, if the ChRM is carried by the ore mineral(s) and/or ore-stage gangue minerals.
SIRM tests of ore and host rock specimens estimate magnetic mineral carriers of the
stable ChRM components in each and their effective grain size. However, a further
examination of these magnetic minerals will provide a better understanding of the
relationship between the ore minerals and ChRM. For this purpose, samples of ore
concentrate and tailings from a mine's mills are subjected to thermomagnetic analyses and
SIRM acquisition curves using a Petersen Instruments Magnetic Measurements Variable
Field Translation Balance (MMVFTB). The MMVTB with an electromagnet is used for
measurements of hysteresis loops, isothermal remanent magnetization (IRM) acquisition,
remanence coercivity, and thermomagnetic curves at temperatures between -180°C and
20
acquisition, remanence coercivity, AF demagnetization, anhysteretic remanent
magnetization (ARM) acquisition and thermomagnetic curves at temperatures between
room temperature and 800°C.
1.6 References
Beales, F.W., Carracedo, J.C., Strangway, D.W., 1974. Paleomagnetism and the Origin of
Mississippi Valley-Type Ore Deposits. Canadian Journal of Earth Sciences, 11,
211-223.
Blake, D.H., Etheridge, M.A., Page, R.W., Stewart, A.J., Williams, P.R., Wyborn, L.A.,
1990. Mount Isa Inlier: Regional geology and mineralization. Australasian Institute
of Mining and Metallurgy, 14, 915-925.
Broadbent, G.C., Myers, R.E., Wright, J.V., 1998. Geology and origin of shale-hosted
Zn-Pb-Ag mineralization at the Century Deposit, Northwest Queensland, Australia.
Economic Geology, 93, 1264-1294.
Chapman, L.H., 2004. Geology and mineralization styles of the George Fisher Zn-Pb-Ag
deposit, Mount Isa, Australia. Economic Geology, 99, 233-255.
Collins, C.J., Strong, D.F., 1988. A fluid inclusion and trace element study of fluorite
21
Canadian Institute of Mining and Metallurgy, Special Volume, 39, 291-302.
Evans, D.A.D., Gutzmer, J., Beukes, N.J., Kirschvink, J.L., 2001. Paleomagnetic
constraints on ages of mineralization in the Kalahari Manganese Field, South Africa.
Economic Geology, 96, 621-631.
Goodfellow, W.D., Lydon, J.W., Turner, R.J.W., 1993. Geology and genesis of stratiform
sediment-hosted (SEDEX) zinc-lead-silver sulphide deposits. Geological
Association of Canada, Special Paper 40, 201-251.
Goodfellow, W.D., 2004. Geology, genesis and exploration of SEDEX Deposits, with
emphasis of the Selwyn Basin, Canada. In: M. Deb, W.D. Goodfellow (eds.).
Sediment-hsoted Lead-Zinc Sulphide Deposits: Attributes and models of some major
deposits in India, Australia and Canada. Narosa Publishing House, New Delhi,
24-99.
Goodfellow, W.D., 2007. Base metal metallogeny of the Selwyn Basin, Canada. In: W.D.
Goodfellow (ed.). Mineral Deposits of Canada: A Synthesis of Major Deposit-types,
District Metallogeny, the Evolution of Geological Provinces, and Exploration
Methods. Geological Association of Canada, Special Publication 5, 555-579.
Gradstein, F.M., Ogg, J.G., 2004. Geologic Time Scale 2004 – why, how, and where next!
22
Howse, A., Dean, P., Swinden, H.S., Kean, B., Morrissey, F., 1983. Fluorspar deposits of
the St. Lawrence area, Newfoundland: geology and economic potential. Report 83-9,
Government of Newfoundland and Labrador, Department of Mines and Energy,
Mineral Development Division.
Jowett, E.C., Pearce, G.W., Rydzewski, A., 1987. A Mid-Triassic paleomagnetic age of the
Kupferschiefer mineralization in Poland, based on a revised apparent polar wander
path for Europe and Russia. Journal of Geophysical Research, 92, 581-598.
Kerr, A., Dunning, G.R., Tucker, R.D., 1993. The youngest Paleozoic plutonism of the
Newfoundland Appalachians: U-Pb ages from the St. Lawrence and Francois
granites. Canadian Journal of Earth Sciences, 30, 2328-2333.
Large, R.R., Bull, S.W., Mcgoldrick, P.J., Walters, S., Derrick, G.M., Carr, G.R., 2005.
Stratiform and strata-bound Zn-Pb-Ag deposits in Proterozoic sedimentary basins,
Northern Australia. Economic Geology 100th Anniversary Volume, 931-963.
Leach, D. L., Bradley, D., Lewchuk, M.T., Symons, D.T.A., de Marsily, G., Brannon, J.C.,
2001. Mississippi Valley-type lead-zinc deposits through geological time;
implications from recent age-dating research. Mineralium Deposita, 36, 711 -740.
Leach, D.L., Marsh, E., Bradly, D., Gardoll, S., Huston, D. 2005a. The distribution of
23
Mineral Deposit Research: Meeting the Global Challenge Proceedings of the Eighth
Biennial SGA Meeting Beijing, 145-148.
Leach, D.L., Sangster, D.F., Kelley, K.D., Large, R.R., Garven, G., Allen, C.R., Gutzmer,
J., Walters, S., 2005b. Sediment-hosted lead-zinc deposits: A global perspective.
Economic Geology 100th Anniversary Volume, 561-607.
Lewchuk, M.T., Leach, D.L., Kelley, K.D., Symons, D.T.A., 2004. Paleomagnetism of the
Red Dog Zn-Pb massive sulfide deposit in Northern Alaska. Economic Geology, 99,
1555-1567.
McElhinny, M.W., McFadden, P.L., 2000. Paleomagnetism: continents and oceans.
Academic Press, San Diego, California, U.S.A., 386 pp.
McGoldrick, P.J., 1986. Volatile and precious metal geochemistry of the Mount Isa ores
and their host-rocks: Unpublished Ph.D. thesis, Parkville, Victoria, University of
Melbourne, 312 p.
McGoldrick, P., Large, R., 1998. Proterozoic stratiform sediment-hosted Zn-Pb-Ag
deposits. Australian Geological Survey Organisation Journal of Australian Geology
and Geophysics, 17, 189-196.
O'Dea, M.G., Lister, G.S., Betts, P.G., Pound, K.S., 1997. A shortened intraplate rift
24
16, 425-441
Oliver, J., 1986. Fluids expelled tectonically from orogenic belts: Their role in
hydrocarbon migration and other geologic phenomena. Geology, 14, 99-102.
Paradis, S., Hannigan, P., Dewing, K., 2007. Mississippi Valley-type lead-zinc deposits.
In: W.D. Goodfellow (ed.). Mineral Deposits of Canada: A Synthesis of Major
Deposit-types, District Metallogeny, the Evolution of Geological Provinces, and
Exploration Methods. Geological Association of Canada, Special Publication 5,
185-204.
Perkins, C., Heinrich, C.A., Wyborn, L.A.I., 1999. 40Ar/39Ar geochronology of copper
mineralization and regional alteration, Mount Isa, Australia. Economic Geology, 94,
23-36.
Perkins, W.G., 1990. The Mount Isa copper orebodies. Australasian Institute of Mining
and Metallurgy Monograph, 14, 935-941.
Perkins, W.G., 1997. Mount Isa lead-zinc orebodies: Replacement lodes in a zoned
syndeformational copper-lead-zinc system? Ore Geology Reviews, 12, 61-110.
Sangster, D.F., 2002. The role of dense brines in the formation of vent-distal
sedimentary-exhalative (SEDEX) lead-zinc deposits: field and laboratory evidence.
25
Smith, W.D., 2000. Genesis of the Mount Isa base metal deposit, Australasian Institute of
Mining and Metallurgy Monograph, 305, 45-56.
Strong, D.F., Fryer, B.J., Kerrich, R., 1984. Genesis of the St. Lawrence fluorspar deposits
as indicated by fluid inclusion, rare earth element, and isotopic data. Economic
Geology, 79, 1142-1158.
Sun, S.S., Page, R., Carr, G., 1994. Lead-isotope-based stratigraphic correlations and ages
of Proterozoic sediment-hosted Pb-Zn deposits in the Mount Isa Inlier. Australian
Geological Survey Organization Research Newsletter, 20, 1-2.
Symons, D.T.A., Pan, H., Sangster, D.F., Jowett, E.C., 1993. Paleomagnetism of the Pine
Point Zn-Pb deposits. Canadian Journal of Earth Sciences, 30, 1028-1036.
Symons, D.T.A., 1994. Paleomagnetism and the Late Jurassic genesis of the
Illinois-Kentucky fluorspar deposits. Economic Geology, 89, 438-449.
Symons, D.T.A., 2007. Paleomagnetism of the HYC Zn-Pb SEDEX Deposit, Australia:
Evidence of an epigenetic origin. Economic Geology, 102, 1295-1310.
Tarling, D.H., 1983. Palaeomagnetism: Principles and Applications in Geology,
Geophysics, and Archaeology. Chapman and Hall Ltd, New York, U.S.A., 379 pp.
Tauxe, L., 1998. Paleomagnetic Principles and Practice. Modern Approaches in
26
pp.
Ueno, H., Tonouchi, S., 1987. Paleomagnetic evidence for the timing of formation of the
Chichibu pyrometasomatic deposits, Japan. Economic Geology, 82, 1723-1731.
Waltho, A.E., Andrews, S.J., 1993. The Century zinc-lead deposit, Northwest Queensland.
The Australasian Institute of Mining and Metallurgy Centenary Conference
Proceedings, 41-61.
Wilde, A.R., Jones, P.A., Gessner, K., Ailleres, L., Gregory, M.J., Duncan, R.J., 2006. A
geochemical process model for the Mount Isa copper orebodies. Economic Geology,
27
Fig. 1.1 a) Geological map of the St. Lawrence area; b) Geological setting of the fluorite
28
Fig. 1.2 Locality map showing the location of the Howards Pass deposits from Norford
29
Fig. 1.3 Location map for the Century, Mount Isa and Geoge Fisher black-shale-hosted
Zn-Pb-Ag "SEDEX" deposits in the Mt. Isa - McArthur basin of northern Australia
30
Fig. 1.4 Geocentric axial dipole model. Magnetic dipole is placed at the centre of the
Earth and aligned with the rotation axis. The observed magnetic inclination, I, between
the magnetic vector and the local horizontal at any location is a function of magnetic
31
32
Fig. 1.6 The fold test. a) Directions of ChRM are shown by arrows for pre-folding
magnetization. ChRM directions are dispersed in the observed in situ orientation;
restoring bedding to horizontal results in maximum grouping of the ChRM directions; b)
Directions of ChRM for post-folding magnetization. Maximum grouping of the ChRM is
in the observed in situ orientation. ChRM directions are dispersed when bedding is
restored to horizontal restoring bedding to horizontal; and, c) Directions of ChRM for
synfolding magnetization. ChRM directions are dispersed in both the in situ orientation
and when bedding is restored to horizontal; maximum grouping of the ChRM directions
33
Fig. 1.7 a) The paleomagnetic conglomerate test. The directions of samples from the
studied lithology are shown in b) indicating that it is relatively homogeneously
remagnetized. Material from the studied lithology was incorporated into a conglomerate
bed and then remagnetized. If the conglomerate clasts are also homogeneously
magnetized as in c) then the magnetization must post-date formation of the conglomerate.
In a positive conglomerate test d), the magnetization vectors of samples from the
34
Fig. 1.8 The baked contact test. In a positive test (black arrows), zones baked by the
intrusion are remagnetized and have directions that grade from that of the host rock. In a
negative test (gray arrows), the intrusion, baked zone, and unbaked host rock show
35
CHAPTER 2
Paleomagnetism of Fluorite Veins in the Devonian St. Lawrence Granite,
Newfoundland, Canada
2.1 Introduction
Fluorite deposits are formed by various processes under different
physicochemical conditions in a range of geologic settings. Such deposits are mostly of
two lithologic types: 1) those in sedimentary rocks, dominantly carbonates; and 2) those
found as veins in, or associated with, dominantly alkaline-peralkaline igneous rocks that
are akin to magmatic-hydrothermal vein-type deposits (Strong et al. 1984). More than
forty distinct fluorite veins are known in the St. Lawrence area, Newfoundland (Figs. 2.1,
2.2ab), and most are hosted by the 374±2 Ma St. Lawrence Granite and its outliers
(Howse et al. 1983). The fluorite veins constitute a major high-grade resource by world
standards and are the premier known resource in Canada. During 44 years of operation
until closure in 1978, the St. Lawrence fluorspar mines produced >4.2 Mt of ore, and the
Director, Blue Beach and Tarefare veins alone still contain ~8.09 Mt of fluorspar
mineralization (Howse et al. 1983).
36
on geochemical arguments between the St. Lawrence Granite and fluorite veins (Teng and
Strong 1976). Irving and Strong (1985) reported paleomagnetic data for the St. Lawrence
Granite but not for the fluorite veins. They observed two remanence components, N and
H, in the granite, interpreting the N component to be the primary magnetization acquired
during cooling of the pluton and the H component to be a Kiaman overprint from low
temperature alteration that deposited hematite diffusely throughout the granite. Our study
aimed to date the fluorite veins and to establish their genetic relationship to the granite.
2.2 Geology
The St. Lawrence area is in the Avalon Terrane (Fig. 2.1), the widest and most
continuous tectonostratigraphic zone of the Appalachians (Williams 1979). The Avalon
zone consists mainly of Late Precambrian volcanic and sedimentary rocks that are
relatively unmetamorphosed and undeformed compared to coeval rocks of nearby
terranes, suggesting that the St. Lawrence Granite was intruded into a relatively stable
tectonic environment (Collins and Strong 1988). The granite batholith outcrops over an
area of ~30 km by 10 km with a number of outliers (Teng and Strong 1976) (Fig. 2.2a).
This pluton is mainly syenitic to alaskitic in composition, fine to medium grained,
37
consists of quartz, orthoclase and albite with minor amounts of riebeckite, aegirine,
biotite, fluorite, magnetite and hematite. Alkali feldspar makes up 30 to 60% of the rock,
and is generally turbid because of finely disseminated hematite (Irving and Strong 1985).
The pluton is clearly post-tectonic, intruding most stratigraphic units in the southern
Burin Peninsula and cutting all deformation features such as cleavage, folds and thrust
faults (Strong et al. 1978). Miarolitic cavities occur near the pluton’s contacts where
tuffisites (gas breccias) are common, indicating shallow emplacement (Irving and Strong
1985). Kerr et al. (1993) reported an U-Pb zircon age for the granite of 374±2 Ma, in
good agreement with a 10-point Rb-Sr isochron age of 360±5 Ma reported by Irving and
Strong (1985). Kerr et al. (1993) suggested that the granite was formed as an integral part
of Appalachian-cycle magmatism and interpreted a prior 4-point Rb/Sr whole rock
isochron age of 315±10 Ma (Bell and Blenkinsop 1975) to be disturbed and unreliable.
The St. Lawrence fluorspar deposits comprise fluorite veins that are found
mostly within the granite or its related porphyry dikes (Fig. 2.2b). The veins are open
fracture fillings that Collins and Strong (1988) believed were formed from regional stress
and contraction during cooling of the granite. The fluorite is mostly massive and coarsely
crystalline, forming veins from wall to wall. Close to the vein walls, the fluorite tends to
38
recognized: a) high-grade veins with strikes from 70° to 110° that average ≤1 m in width
with acid-grade ore averaging ~95% CaF2; and b) low-grade veins with strikes from 140°
to 160° that average ~7 m in width with grades up to ~70% CaF2. The principal gangue
minerals are quartz, calcite, sulphides and barite with minor amounts of secondary iron,
copper and manganese minerals (Howse et al. 1983). Galena and sphalerite are the most
abundant sulphides with pyrite and chalcopyrite occurring rarely.
Van Alstine (1948) concluded that the fluorite came from the same magma
chamber as the granite, and that the ore fluids were released by late-stage differentiation,
forming fluorite veins along faults and shears as the granite cooled and contracted.
Similarly, Williamson (1956) concluded that the primary control on fluorite was the
fracture pattern developed due to the stress system produced by cooling of the granite.
From fluid inclusion, rare earth element and isotopic data, Strong et al. (1984) and Collins
and Strong (1988) presented genetic models in which fluorite deposition occurred because
of either increasing pH caused by boiling of magmatic fluid or mixing of cooled
magmatic fluids with highly saline connate waters. Based on laser ablation – inductively
coupled plasma – mass spectrometry analyses, Gagnon et al. (2003) found that the
fluorite exhibits compositional trends that represent either the progressive mixing of
39
2.3 Methods and results
2.3.1 Sampling and initial measurements
Six to eight 2.54 cm diameter cores were drilled at 28 sites (Fig. 2.2b) and oriented in situ
with a solar or magnetic compass, and three oriented block samples were collected at one
additional site. The 29 sites included: 19 sites in fluorite veins, 7 sites in granite, 1 site in
a diabase dike, 1 site in the contact zone next to the dike, and 1 site in the contact zone of
the granite’s hostrock. Six to 16 core specimens, each ~2.20 cm long, were prepared for
each site in the paleomagnetic laboratory at the University of Windsor, providing 359
specimens. The specimens were stored for one month in a magnetically-shielded room
with an ambient field of ~100 γ to allow their unstable and undesirable viscous remanent
magnetization (VRM) components to substantially decay. All subsequent magnetic
measurements were done without removing the specimens from the shielded room.
Natural remanent magnetizations (NRM) were measured on a 2G Enterprises 755R
DC-SQUID magnetometer with a specimen sensitivity limit of ~2 × 10⁻⁶ A/m. The
median NRM intensity of the fluorite specimens was 5.13 × 10⁻⁴ A/m (quartiles: Q1 =
1.35 × 10⁻⁴, Q3 = 1.72 × 10⁻³) and of the granite specimens was 3.19 × 10⁻³ A/m (quartiles:
40
2.3.2Demagnetization
One typical specimen from each site was thermally (Th) demagnetized in 24
steps to 680°C using a Magnetic Measurements MMTD-80 oven with the Th steps biased
into the diagnostic unblocking temperature ranges of the common magnetic minerals, ie
goethite (80 to 140°C), pyrrhotite (260 to 340°C), magnetite (500 to 580°C), and hematite
(600 to 675°C) (Dunlop and Özdemir 1997) (Fig. 2.3). A second typical specimen from
each site was alternating field (AF) demagnetized in 13 steps to 120 mT using a Sapphire
Instruments SI-4 demagnetizer. Based on the initial results, the remaining specimens were
either Th demagnetized in 19 steps up to 680°C (Fig. 2.3) or AF demagnetized in 11 steps
up to 120 mT. All remanence directions from the fluorite and granite specimens were
plotted separately on Schmidt equal-area nets for each demagnetizing step using a
computer program based on the Kamb method (1959), which gives directional density
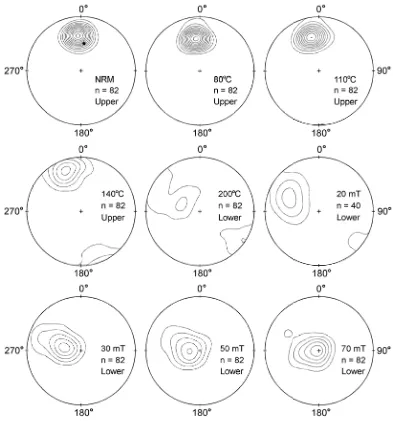
contours in 2σ increments (Fig. 2.4).
The fluorite specimens yielded two major clusters of NRM directions (Fig. 2.4a).
One cluster – the A remanence component – was directed almost vertically downward,
apparently recording the present Earth's magnetic field (average 1900-2005 is D = 334°, I
41
component – was directed shallowly downward to the south. On demagnetization, the A
component cluster migrated towards the southerly shallow B component direction in steps
up to ~280°C (e.g. Fig. 2.4bcd). Thereafter, the B component cluster was present and
relatively constant in direction until ~580°C (e.g. Fig. 2.4defgh). Above ~580°C, the B
component directions started scattering rapidly (e.g. Fig. 2.4i). These results showed that
the major remanence carriers are pyrrhotite and/or magnetite. Similar results were
observed in granite specimens. Therefore, the characteristic remanent magnetization
(ChRM) end point directions for both vein and granite specimens belong to the B
component cluster. Since the A component remains above 580°C in some specimens, its
ChRM carrier is hematite that was probably generated mostly by modern weathering.
The specimen ChRM directions were determined using principal component
(Kirschvink 1980) and remagnetization circle analysis (Bailey and Halls 1984), thereby
isolating the A and B component directions from the total population of remanence
directions. Site and unit mean directions were calculated following Fisher (1953) (Table
1). The site mean ChRM directions were dispersed but mostly in the B component
direction (Fig. 2.5). The mean direction for 15 sites in fluorite veins is declination (D) =
177.0°, inclination (I) = 15.0° (number of sites (N) = 15, radius of cone of 95%
42
paleopole at 35.4°N, 128.2°E (with semi-axes for the oval of 95% confidence of dp = 3.0°
and dm = 5.8°). Including the two sites from Irving and Strong (1985) (Redhead (H
component) and St. Lawrence village (H component) sites), the mean for 9 granite sites is
D = 176.1°, I = 15.4° (N = 9, α95 = 8.1°, k = 41.2), giving a paleopole at 35.2°N, 129.2°E
(dp = 4.3°, dm = 8.3°). The Redhead H component direction was derived from only 11
specimens from 9 samples spaced at intervals up to 1 km apart around the shoreline, and
the St. Lawrence H component from 7 specimens from 7 similarly spaced samples along
Highway 220 across the batholith (Irving and Strong 1985).
2.3.3 Contact test
A paleomagnetic baked contact test is useful for determining whether or not the
studied lithology has undergone pervasive secondary remanence overprinting. If an
igneous intrusion and its baked contact zone give a ChRM direction that differs from that
of remote host rock, then the baked contact test is positive and shows that the host rock's
ChRM was acquired before the dike was intruded (Everitt and Clegg 1962). Conversely,
if the dike, baked contact zone and hostrock give the same ChRM direction, then the test
is negative and indicates that the host rock was remagnetized at the time of intrusion or