ABSTRACT
LIVINGSTON, FREDERICK JERARD. Development of an Internet Addressable
Pneumatically Controlled Instrument for Applying Strain to Cells In-Vitro. (Under the
direction of Dr. Edward Grant.)
Mechanical stimulation of tissue cells is a popular technique used by tissue
engineering researchers to stimulate cell growth. This research requires an instrument that
applies in-vitro compression and tension to individual cells, through mechanical loading.
The mechanical load in the research reported on here is generated using a vacuum system
under computer control. The vacuum system consists of a pneumatic valve that is
proportionally controlled from a single board computer, and a pressure transducer to monitor
the waveform of the applied mechanical loading. Because the computer control is based on a
single-board computer, the mechanical loading of cells can be carried remotely using a
network environment and a dedicated IP address. The system is a good example of a smart
mechatronic system. The research and development was carried out with support from
Development of an Internet Addressable Pneumatically
Controlled Instrument for Applying Strain to Cells In-Vitro
by
Frederick Jerard Livingston
A thesis submitted to the Graduate Faculty of
North Carolina State University
In partial fulfillment of the
Requirements for the degree of
Master of Science
Electrical Engineering
Raleigh, NC
2006
Approved by:
_____________________________________
Edward Grant (Chair of Advisory Committee)
______________________________ ______________________________
BIOGRAPHY
Frederick Livingston was born March 21, 1980 in Greensboro, North Carolina to Willie and
Deborah Livingston. He received his Bachelor of Science in Computer Engineering from
North Carolina State University, Raleigh, NC in 2003, where he graduated cum laude. He
remained at North Carolina State University to study mechatronics, robotics, and control
system with the Center of Robotics and Intelligent Machines under the direction of Dr.
Edward Grant. As a graduate student, Frederick worked with Sandia National Laboratories in
the advance manufacturing engineering science. His responsibilities included the
development of meso-scale fixturing, assembly, and tooling. Frederick also worked closely
with Flexcell International to develop a new biomedical instrument using feed-back
pneumatic controls. Frederick plans to continue his educational experience and obtain a
doctor of philosophy degree. Frederick would like to combine machine learning, machine
vision, mechatronics, robotics, and control systems to develop cutting edge manufacturing
TABLE OF CONTENTS
LIST OF FIGURES...v
LIST OF TABLES... vii
LIST OF EQUATIONS ... viii
LIST OF ABBREVIATIONS ...ix
CHAPTER 1. INTRODUCTION...1
1.1 CURRENT METHODS FOR CELLS STIMULATION...1
1.1.1 FlexCentral ...6
1.1.2 FlexLink ...8
1.2 RESEARCH GOALS...9
1.3 OUTLINE OF THESIS...11
CHAPTER 2. IAPCI DESIGN ...12
2.1 SINGLE BOARD COMPUTER...13
2.2 OPERATING SYSTEM...16
2.3 PNEUMATIC VALVE...18
2.4 FEEDBACK SENSOR...19
2.5 DATA ACQUISITION...22
2.5.1 15psi Transducer with an 8 bit A/D ...22
2.5.2 5 psi Transducer with an 8 bit A/D ...24
2.5.3 30psia Transducer with an 16 bit A/D ...24
2.5.4 Digital to Analog Conversion for Valve Control ...26
2.5.5 Software Interaction with DAQ...27
2.6 POWER SUPPLY...28
2.7 EXTERNAL DEVICE CONTROL...29
2.8 WEB SERVICES...31
CHAPTER 3. USER INTERFACE...33
3.1 CONTROL CLIENT...33
3.1.1 Communication Utilities ...34
3.1.2 On Screen Keyboard ...34
3.1.3 Connection Class ...35
3.1.4 Client Class...38
3.2 REMOTE INTERFACE...46
3.2.1 Control.php ...47
3.2.2 Regimen.php...47
3.2.3 Regimen_step2.php ...48
3.2.4 Baseplate.php...50
3.2.5 Calc.jar ...51
3.2.6 WaveTemplate.jar ...52
3.2.7 Users.php ...53
3.2.8 Network.php ...54
3.2.9 Setup.php...55
CHAPTER 4. SOFTWARE CONTROL THREADS...58
4.2 DATA STORAGE...60
4.3 CONTROL THREAD...60
4.4 COMMUNICATION THREAD...60
4.5.1 Client to Server Packets ...63
4.5.2 Server to Client Packets...64
CHAPTER 5. CONTROL SYSTEM ...67
5.1 CONTROL ALGORITHM...70
5.1.1 On/Off Controller Design ...70
5.1.2 PWM Controller Design ...72
5.1.3 Proportional Bleed Off Control ...73
5.1.4 Proportional On/Off Controller Design...75
5.1.4 Control Algorithm Summary ...77
5.2 ELONGATION AND PRESSURE RELATIONSHIP...78
5.3 DIGITAL PID CONTROL SYSTEM...80
CHAPTER 6. EXPERIMENTS AND RESULTS...84
CHAPTER 7. CONCLUSION AND FUTURE RESEARCH...89
7.1 CONCLUDING REMARKS...89
7.2 FUTURE RESEARCH...89
CHAPTER 8. REFERENCES...92
CHAPTER 9. APPENDICES ...93
APPENDIX 1. USER GUIDE...94
A.1.1 Hardware Setup...94
A.1.2 Network Configuration ...94
A.1.3 Procedures...96
APPENDIX 2. PNEUMATIC CULTURE SYSTEM SOFTWARE...99
A.2.1 Modified Linux Startup Routine...99
A.2.2 Important Linux Executables...101
APPENDIX 3. PART LIST...102
APPENDIX 4. WIRING DIAGRAM...103
APPENDIX 5. CADDRAWINGS...105
A.5.1 Exterior Views ...105
A.5.2 Physical Dimensions...106
A.5.3 Cover ...107
APPENDIX 6. ASSEMBLY PLAN...113
APPENDIX 7. PNEUMATIC CULTURE SYSTEM PICTURES...119
LIST OF FIGURES
Figure 1. Longitudinal Stretch [2] ... 2
Figure 2. Compression Loading [2] ... 3
Figure 3. Out-of-Plane Loading [2] ... 4
Figure 4. In-Plane Loading [2]... 5
Figure 5. Flexcell Culture System ... 6
Figure 6. FlexLink ... 8
Figure 7. Hercules-EBX... 15
Figure 8. Proportional Valve... 18
Figure 9. Pressure Transducer... 19
Figure 10. Types of Pressure Readings... 21
Figure 11. Omega Px-139 Pressure Transducer Function ... 25
Figure 12. External Event Circuitry... 30
Figure 13. SQL Variables ... 32
Figure 14. System Hardware... 32
Figure 15. On-Screen Keyboard ... 34
Figure 16. Connection Screen... 36
Figure 17. System Control Pane ... 38
Figure 18. System Status Pane... 40
Figure 19. Plot Config Pane... 41
Figure 20. External Event Control Pane ... 43
Figure 21. Network Config Pane ... 44
Figure 22. Log Off Pane ... 45
Figure 23. control.php... 47
Figure 24. regimen.php ... 48
Figure 25. regimen_step2.php... 49
Figure 26. baseplate.php ... 50
Figure 27. calc.jar ... 51
Figure 28. WaveTemplate.jar ... 53
Figure 29. users.php... 54
Figure 30. network.php ... 55
Figure 31. setup.php... 55
Figure 32. Fx5000Server Flow Diagram ... 59
Figure 33. Network Protocol... 62
Figure 34. Communication Flow Diagram ... 66
Figure 35. System Model... 67
Figure 36. Pressure Model (on/off)... 70
Figure 37. Valve Response (On/Off Control)... 71
Figure 38. Steady State Error... 72
Figure 39. Valve Response (PWM Control)... 73
Figure 41. Bleed Off Control V2 Closed ... 74
Figure 42. Bleed Off Control V2 Open ... 74
Figure 43. Error vs. Input Valve Voltage ... 75
Figure 44. Pressure Error Relationship... 76
Figure 45. Baseplates Elongation vs. Pressure ... 79
Figure 46. Elongation Control Block Diagram... 80
Figure 47. System Responses ... 82
Figure 48. System Lag ... 84
Figure 49. Frequencies Responses for a 5% Elongation waveform using 25 mm loading post ... 85
Figure 50. Frequencies Responses for a 5% Elongation waveform using compression system ... 86
Figure 51. Frequencies Responses for a 1% Elongation waveform using 25 mm loading post ... 87
Figure 52. Frequencies Responses for a 1% Elongation waveform using compression system ... 87
Figure 53. Low amplitude responses using compression system ... 88
Figure 54. Transformed African Green Monkey Kidney Fibroblast Cells... 90
Figure 55. Network Configuration... 95
Figure 56. Creating a new regimen... 96
Figure 57. Configuring regimen ... 97
Figure 58. Pneumatic Culture System Isometric View... 105
Figure 59. Pneumatic Culture System Front Panel... 105
Figure 60. Pneumatic Culture System Rear Panel ... 106
Figure 61. Pneumatic Culture System Dimensions ... 106
Figure 62. Initial Prototype ... 119
Figure 63. Finish System View1... 120
Figure 64. Finish System View2... 121
LIST OF TABLES
Table 1. Hercules-EBX Specs... 16
Table 2. Port Connections... 18
Table 3. Port Configuration ... 19
Table 4. 15 psi Resolution Calculation ... 23
Table 5. 5 psi Transducer w/ 8 bit A/D Calculations... 24
Table 6. 30 psia Transducer w/ 16 bit A/D Calculations... 26
Table 7. Transducer Resolution Summary... 26
Table 8. Valve Spool Position Resolution Calculations using 16 bit A/D ... 27
Table 9. DAQ Control Devices... 27
Table 10. Control Algorithm Summary ... 77
LIST OF EQUATIONS
Equation 1. General Resolution ... 22
Equation 2. Resolution of 5 volt range using 8bit A/D... 23
Equation 3. 15psi Transducer Voltage vs. Pressure... 23
Equation 4. Resolution of 5 volt range using 16bit A/D... 24
Equation 5. 30 psia Transducer Voltage vs. Pressure... 25
Equation 6. Resolution of 10 volt range using 16 bit A/D... 26
Equation 7. Valve Voltage vs. Spool Position... 27
Equation 8. Ohm's Law and Power... 28
Equation 9. Pressure Equation ... 51
Equation 10. Fluid Dynamics Equations ... 69
Equation 11. Tension Control Equations ... 77
Equation 12. BFlx Loading Station (25mm): %Elongation to Pressure... 78
Equation 13. BFlx Loading Station (25mm): Pressure to %Elongation... 78
Equation 14. BFlx Loading Station (28mm): %Elongation to Pressure... 78
Equation 15. BFlx Loading Station (28mm): Pressure to % Elongation... 78
Equation 16. BFlx Loading Station (31mm): %Elongation to Pressure... 79
Equation 17. BFlx Loading Station (31mm): Pressure to %Elongation... 79
Equation 18. BFlx Cell Compression: %Elongation to Pressure... 79
Equation 19. BFlx Loading Station (28mm): Pressure to %Elongation... 79
Equation 20. FlexI Plate: %Elongation to Pressure ... 79
Equation 21. FlexI Plate: Pressure to %Elongation ... 79
Equation 22. Ideal PID Formula ... 81
LIST OF ABBREVIATIONS
• A/D = Analog to Digital Converter
• CRIM = Center of Robotics and Intelligent Machines
• CSV = Comma Separated Value
• DHCP = Dynamic Host Configuration Protocol
• DPDT = Double-Pole, Double-Throw
• EEPROM = Electronically Erasable Programmable Read-Only Memory
• ES = Embedded Systems
• GUI = Graphical User Interface
• HTTP = Hyper Text Transfer Protocol
• IAPCI = Internet Addressable Pneumatically Controlled Instruments
• I/O = Input/Output
• IT = Internet Technology
• LCD = Liquid Crystal Display
• OS = Operating System
• PC = Personal Computer
• PDA = Personal Digital Assistant
• PLC = Programmable Logic Controller
• PnP = Plug-and-Play
• PSI = Pounds per square inches
• PWM = Pulse Width Modulation
• SBC = Single Board Computer
• USB = Universal Serial Bus
Chapter 1. Introduction
Tissue cells encounter different types of stress depending on their location within in
the human body. Such stresses are important for developing and maintaining cell functions.
Bone tissue changes its form, mass, and internal structure depending on the stress applied to
it [3]. Although certain levels of stress are vital for bone tissue development, overstressing
tissue is potentially harmful. Overstressing bone cartilage can lead to cell reduction and is the
main cause for implants operations [5]. Tissue Engineers study the impact of different
stresses on cell behavior. The majority of cell straining analysis is performed outside of the
human body, and is based on mechanical stimulation. A variety of devices have been
developed for mechanical cell stimulation [1, 2, 4, 6, 7, 10]. This project involves the
development of an Internet Addressable Pneumatically Controlled Instrument (IAPCI) for
cell stimulation. This new device functions similar to commercially available devices that
apply stress to cell tissue, e.g., the Flexcell 4000. However, the technological features
possessed by this new device make it better suited for remote and distributed operation, since
this new system is based on embedded systems and state of the art information technology.
1.1 Current Methods for Cells Stimulation
In 2000, Thomas D. Brown published an article in the Journal of Biomechanics
reviewing the current techniques for mechanical stimulation of cells. According to Brown the
common methods for delivering stress includes compressive loading, longitudinal stretching,
fluid shear systems[2]. Electric motors, springs, pulley, pistons, and piezoelectric actuators
are commonly found in cell culture systems. These devices control displacement that apply
longitudinal cell loading. In Figure 1a mechanical components are attached to the ends of the
substrate to elongate the tissue cells. In Figure 1b mechanical forces are applied at particular
pressure points to flex the substrate. The flexing causes the attached tissue cells to elongate
with curvature of the substrate.
Figure 1. Longitudinal Stretch [2]
The amount and the resolution of the cell elongation depend on the material
properties of the substrate and the loading mechanism. Devices such as piezoelectric
actuators can deliver significant amounts of force with a high degree of resolution and
accuracy. A disadvantage of using these devices for cell culturing systems is that many
disadvantage of using pneumatic devices is that air is sensitive to temperature, sensitive to
entrapped air in the system, and highly compressible which makes controlling pressure
harder to achieve.
Commonly, pneumatics is used to apply compression cell loading. Compression
loading involves stimulating cells by applying a force directly over the object. In Figure 2a
compression loading was applied using hydrostatic pressure and a sealed chamber filled
partially with a liquid medium and investigated cells. As the load is applied, the pressure in
the system increases, stimulating the cells. In Figure 2b the cell experience compression
loading directly from the load. In this configuration the cells are usually seeded in a matrix
(scaffold) and a load is applied directly to the three-dimensional specimen.
Figure 2. Compression Loading [2]
apply out-of-plane cells distention. In these systems, tissue cells are attached to a flexible
membrane. As a vacuum force is applied underneath the membrane, the cells are elongated.
Using this particular technique it was discovered that the outer cells experience a larger
percentage of elongation than the inner cells. Figure 3 display examples of out-of-plane cell
loading.
Figure 3. Out-of-Plane Loading [2]
A loading post, a low friction rigid structure, was added to more recent systems to
apply a more uniform cell elongation. Figure 4 displays examples of uniform cell elongation
Figure 4. In-Plane Loading [2]
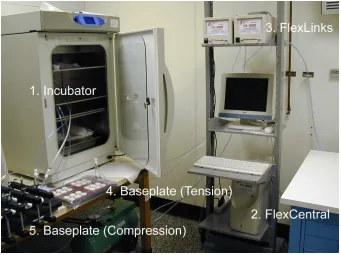
Today, the Flexcell Fx4000 system consists of the following four major components:
an incubator, FlexCentral, FlexLinks, and Baseplates. The incubator is used to ensure that
continuity of humidity and carbon dioxide levels, thereby creating the ideal environmental
Figure 5. Flexcell Culture System
1.1.1 FlexCentral
The FlexCentral is a Microsoft Windows 98 based computer that controls and
communicates between the components of the culture system (Fx-4000). The user interface
for the entire system resides in the FlexCentral. The user interface has the following features:
• It produces multi-frequency waveforms and amplitudes for the test regimens.
• It is capable of producing the following waveforms: static, sinusoidal, heart
(electronic and pressure), triangular, square wave, and custom.
• It is capable of varying the duty cycle of the triangular waveform and the square
• It is be capable of saving data, by capturing data from the screen every “x” minutes,
where “x” is specified by the user.
• It converts all data curves from vacuum or pressure sensors into percent elongation or
force. These are stored within a single text file so that they can be easily processed,
or sent, by the customer and reviewed. This file also contains all of the customer’s
regimens and other configuration data necessary for the proper functioning of the
unit.
• It allows any regimen created by a user to be simulated or run.
• It allows several FlexLinks to run at simultaneously. The user can display any graph
by selecting a radio button on the main screen.
• The main screen displays the following information:
o The number of FlexLinks connected at any given point in time, and which
FlexLink is currently operating.
o The waveform in terms of percent elongation, kPa, strain, millistrain, and
microstrain.
o A “smoothing” option that allows the user to apply a 3-point moving average
to the data from the feedback sensors.
o The X and Y coordinates of the displayed graph.
o The current user, regimen, baseplate being used, and run-time.
o The current regimen step, cycle, jump, minimum-level, maximum-level.
o The plot of the current state of a simulated or actual regimen running.
Configure baseplates.
Configure communications.
Add users to the systems.
Create and edit regimens.
State an active regimen run.
Pause a regimen run.
Resume a paused regimen run.
Stop a regimen run.
Reset the controller.
Collect and store data.
Create waveform templates.
Print the current waveform on the plot.
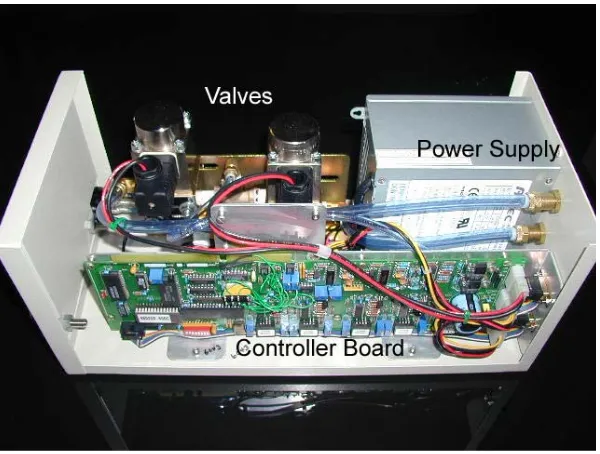
1.1.2 FlexLink
FlexLink’s communicate with the FlexCentral via an RS-422/485 communication
protocol. The main purpose of the FlexLink unit is to monitor and deliver vacuum, or
pressure, to the baseplates. Theses units are linkable; they can be organized into multiple
units that can supply pressure to multiple baseplates simultaneously. These devices consist of
the following components: Controller board, electro-mechanical control valves, power
supply, EEPROM, 8 bit A/D converter, 8 bit D/A converter, memory, 4 transducers, and
signal conditioner circuits.
1.2 Research Goals
The research goal is to develop a new generation of instruments to stimulate cells
in-vitro. This new instrument was specified to be compatible with pre-existing Flexcell
International Corporation’s compression and tension baseplates. The system was specified to
perform the same task as the Fx4000, but with more enhanced, and user friendly features.
The following is a primary list of features that were required in developing the new culture
system: Information technology-based features, e.g., IP addressable units, EEPROM replaced
with embedded microcontrollers/microprocessors, memory that is cheaper and faster, 8 bit
A/D to 16 bit A/D, 8 bit D/A to 12 bit D/A, a proportional pneumatic valve that is computer
• In addition, the new cell straining instrument has external device controls; that enable
the user to program control sequences for a vacuum pump or similar devices to turn
on and off.
• The ability to control low vacuum and positive pressure levels to achieve low-levels
and/or high-levels of strain and compression if desired.
• Auto calibration.
• Waveform frequency from 0.05 Hz upwards. The current limitation of the Fx4000 is
0.1 Hz.
• The ability for the controller to connect to any computer. The preferred
communication is Ethernet.
• A single controller box that can control up to 4 individual valve boxes, either tension
or compression.
• Multiple satellite or valve box systems. To have theses auto-numbered and named
within the software and according to the order by which they are connected to the
central processing box.
• An indicator light on each FlexLink to show whether or not it is the active FlexLink,
this is displayed on the screen.
• The capability to use power of Internet Technology (IT0 to expand the functionality
of the cell straining instrument to include auto-diagnose of the instrument over the
1.3 Outline of Thesis
The design and development of the IAPCI is described in this thesis. Chapter 2
presents an overview of the hardware and software components. This chapter provides an
overview of modern day technical components use for controlling and monitoring pneumatic
pressure. It also provides design guidelines and explanations for component selection.
Chapter 3 discusses the implementation of the user interface. It discusses methods for
communicating data over a network. These methods consist of TCP sockets, html, php, and
java applets and applications. The user interface uses theses communication methods to
provide a touch screen interface and a web browser interface to the controller.
Chapter 4 involves the development of the control software and its interaction with
the user interface. This chapter provides methods for creating real time control application
using C++, multithreads, thread priorities, and task scheduling.
The control algorithms are discussed in Chapter 5. This chapter discusses four
possible algorithms for controlling the IAPCI pressure according to information received
from the feed-back sensors. This chapter compares the pros and cons of each algorithm and
provided a detail explanation of the selected algorithm.
Chapter 6 provides experiments and results use to determine the characteristics of the
new cell culture device. Lastly, Chapter 7 presents some ideas for further improvements of
Chapter 2. IAPCI Design
The design of the new system was driven by four primary goals. These goals were
determined primarily by the need to develop a user friendly IAPCI system for a wide range
of advanced cell straining experiments. This new device was designed to: (1) perform
experiments with various input signals, (2) amplitudes, (3) frequencies, with a high-level of
accuracy, and (4) to improve user-friendliness by adopting the power of the Internet.
In order to meet such a demanding set of requirements the system was required to
possess the following specifications, including:
• Adaptable Controls.
• Robustness.
• Repeatable performance metrics.
• Provide a user-friendly control interface.
The IAPCI was designed to be a generic device for applying strain to cells. It was
specified to be capable of performing experiments from low amplitudes and frequencies to
high amplitudes and frequencies. The system was designed to control a variety of
waveforms, from step inputs through sinusoidal and custom waveforms. Therefore, the
systems required an on-board controller, a microcomputer that was capable of producing the
complex waveforms required for the tests. The microcomputer must also be able to host the
control algorithms that make up test regimes.
The system was designed to be as robust as possible; in that it is easily integrated with
designed to have sensor expandability if and when required. That is, a vision system can be
added to monitor the deflection of the baseplate unit’s if desired. Any new sensors to be
added should be “Plug-and-Play”, and it is for this reason that the USB architecture was
adopted in the original design specification. Lastly, the system design specification allowed
for easily upgradeable alterations to the control software.
The system should be capable of processing the large amounts of data generated
during the cell strain tests. The processor must gather data from sensors that will allow for
the making its display and control decisions that will ensure experimental consistency. The
processor chosen, the pc-104 card, has the capability to process data in real time, in addition
to performing any user interface functions that are required simultaneously. Plus, the system
specification requires that this data must be stored for a period of time. Again, the PC 104
card provides this capability.
Finally, the IAPCI should be as user friendly as possible. The system must be Internet
accessible, so that users have the capability of monitoring and controlling the system
remotely. The system also has the capability of remote diagnostics if and when they are
developed.
2.1 Single Board Computer
To meet the design specifications, the control devices market was explored. In
today’s market there are three main devices used for control. The main types of control
PLC’s are highly reliable special-purpose computers used in industrial monitoring
and control application. These devices are capable of producing the currents and voltages
required for controlling industrial rated equipment. Such devices typically have proprietary
programming, networking protocols, and special-purpose digital and analog input and output
(I/O) ports. Commonly, these systems do not support a graphical user interface. Typically a
second computer hosts the user interface and communicates with the PLC.
An Embedded System (ES) is similar to a personal computer (PC), but with the
additional capability to perform digital and analog I/O operations directly. Unlike a
general-purpose computer, an ES has specific requirements and performs pre-defined tasks. ES’s can
exist solely as a microcontroller, or as an entire system; such as single board computer (SBC
or PC-104 as an example). These devices are found today in many low power electronic
devices such as cell phones, personal digital assistant (PDA), toys, camera, and etc. Although
these devices are not capable of delivering high currents directly; in combination with other
interface components, such as relays and power transistors, they are adaptable for use with
industrial devices. Due to the pc-104 similarity to a PC’s, adding new interfacing devices can
be as easy as plug and play.
There are many hybrid controllers, such as the National Instrument Field Point, which
is technology that lies between a PLC and ES. The field point is design to operate in variety
of environmental conditions, and is capable of performing control, digital, and analog I/O as
well as acting as a host for the user interfaces. However, these devices typically have a
limited amount of resources such as processing speed, and memory, and can are rather
Figure 7. Hercules-EBX
For the IAPCI system the Diamond System’s Hercules-EBX was chosen as the main
controller. The Hercules-EBX is a single board computer (SBC) that supports standard
features such as keyboard, mouse, hard disk, video, serial, and parallel interface, as well as
advanced features, such as data acquisition (DAQ). To meet the performance needs of the
pneumatic control system the SBC includes 750 MHz Pentium III class chipset and 256 MB
of ram. The SBC is capable of 16-bit Analog to Digital (A/D) and 12-bit Digital to Analog
(D/A) conversions. In additional the Hercules includes an expandable pc-104+ stack as well
as USB for future add-on support. The SBC is also internet protocol (IP) addressable for
remote access. Table 1 provides a list of the Hercules-EBX additional features provided by
Table 1. Hercules-EBX Specs
Feature Details Data Acquisition Power Supply
VIA Eden Pentium III class 550-750 MHz processor
32 wide-rande analog inputs, +/-10V down to 0-1.25V
5-28VDC input range standard - direct connect to vehicle power systems 128-256MB SDRAM soldered on
board 16-bit A/D resolution 20-48VDC input range optional VGA support up to 32 per pixel and
max resolution of 1920x1440
Single-channel, multi-channel round robin, and multi-channel scan sampling
40 watts output power (12-16 watts used by CPU)
Integrated S3 ProSavage 4 AGP-4X
graphics 250kHz max sample rate
Switched auxiliary power for IDE drives and accessories
Advance 3D rendering and 3D hardware acceleration
2048 A/D sample FIFO with programmable threshold LCD support any LVDS screen up to
1400x1050
Interrupt-based A/D data transfer with FIFO support
AC97 audio with on-board codec and 2W per channel Hi-Fi stereo amplifier
and DC volume control Programmable input ranges 10/100Mbps Ethernet with RJ-45 and
pin header connections
4 wide-range analog outputs with simultaneous update capability TV out feature - composite and
S-video 12-bit D/A resolution UDMA-100 IDE support
Multi-range autocalibraion for highest accuracy
IDE flashdisk module socket
40 digital I/O lines with programmable direction Compact flash socket 16-bit and 24-bit counter/timers 4 USB ports
4 programmable pulse-width modulation (PWM ) outputs 4 serial ports - 2 fixed 232 or
RS-485, 2 selectable RS232/485
Field-upgradeable logic circuit for performance upgrades or custom designs
PS/2 Keyboard and mouse
Programmable watchdog timer, 0 to 2 seconds
Low power fanless operation at 550 Mhz
PC/104-plus ISA and PCI expansion -40 ro +85 Celsuis Operation
2.2 Operating System
The IAPCI system’s SBC is based on the PC architecture, and as such requires the
use of an operating system (OS). The Hercules SBC supports many different operating
system including Microsoft Windows, OS X, Linux, and other PC compatible OS’s.
which are designed for the embedded system environments. Windows XP embedded allows
for user configuration and selection of components that helps to develop the OS with only the
required components. This is helpful in freeing up memory, processing time, and reducing
overhead. Windows CE is similar to the XP embedded. The complete customization features
of XP embedded are not available with the Windows CE operating system. Both of these
operating systems are plug-and-play compatible with many electronic devices which make
the system easily adaptable for future technology. Disadvantages with Microsoft products are
the occasional system crashes occurrences and the expensive licenses. To avoid these issues
the Linux operation system was investigated.
Linux is an open source, UNIX-like operation system that can be fully customized to
meet specific needs. The core of the Linux operation system is the kernel. The kernel is
loaded when the computer boots. The kernel provides policing and services to all of the other
running programs. The kernel can be configured to meet real-time performance. The Linux
operating system supports higher level languages and newer versions of the Linux kernel also
interact with plug-and-play devices.
A customized version of Red Hat Fedora 3 is used as the operating system for the
pneumatic control instrument. Libraries are included to support Java, C/C++, Perl, shell
scripts, and data acquisition. Modifications to the startup process are implemented for faster
startup and to lower system overhead. These modifications are found in the Appendix A.2.1
2.3 Pneumatic Valve
An important requirement of the IAPCI system is the manner in which air pressure or
vacuum is supplied to cells in a controlled manner. Pressure is a function of resistance to
flow in a fluid system, including wall resistance, bends, and the valves. A review of these
instruments reveals that several devices have been used to control air flow. Earlier systems
used on-off devices such as solenoid valves, and although these valves are usually fast acting,
the air flow rate can not be controlled using them.
Pneumatic proportional valves have been developed in recent years to allow for
variable flow rates according to the input signal. These valves usually contain a spool attach
by some mean of actuation such as magnetic, piezoelectric actuators, or servo motors. These
valves tend to have a slightly slower response time than solenoid valves. Proportional
pneumatic valves can have hysteresis problems associated with them; caused by spool
“stiction” and. high and low levels of air flow can effect the spool position. More advance
proportional valves incorporate their own closed loop control system, to monitor and control
the spool position.
The Norgren VP60 was selected to control the air flow in the new system. The VP60
is an electromagnetic proportional valve with a built in microprocessor to provide a linear Figure 8. Proportional Valve
Table 2. Port Connections
Port Connection
1 Out to Baseplates
2 Pressure Supply
3 No Connect (Plugged)
4 Free Exhast
response between input voltage and spool position. These valves contain 5 ports with 3
configurations. Port1 of the valve is connected to the baseplates chambers. Port2 of the valve
is connected to the pressure source (vacuum pump or compressor). Port 4 is the system
exhaust port. When the input voltage is 5 volts there is no flow in the system and the pressure
is maintain at it current levels. When the input voltage is 0 volts; Port 4 is completely
connected to Port 1 and pressure in the system is released. When the input voltage is 10 volts;
Port 2 is completely connected to Port1 and system differential pressure increases.
Table 3. Port Configuration
Configuration Input Voltage Active Flow
1 0->5V 1-4 and 2->3
2 5V No Flow
3 5->10V 1->2 and 4->5
Note: Using these valves Port2 and Port4 is not accessible to Port1 at same time, and
Port 3 should be plugged to relieve pressure on the pressure source
2.4 Feedback Sensor
A transducer is needed to monitor the systems pressure. A pressure transducer is a
device that converts pressure into an electrical signal. The most common pressure
transducers are diaphragm gages.
These gages consist of thin diaphragms rigidly mounted around their perimeter that
separate two chambers. A pressure difference between the two chambers causes the
diaphragm to deflect. The degree of flexure, and hence strain, is sensed by strain gages and a
Wheatstone Bridge. There is usually a linear relationship between pressure difference and the
output signal. Gage pressure is sensed by opening Port B (see Figure 9) of the transducer to
the atmosphere. Absolute pressure is sensed by vacuum sealing Port B. If both ports are
available the transducer senses differential pressure.
Pressure transducers are available with several types of output, and several styles.
Pressure transducer are generally available with three types of electrical outputs; milli-
voltage, voltage, and current.
Cheaper transducer tends to use milli-volts for their output signal. This signal requires
amplification in order to be processed by the microcontroller. These types of pressure
transducers are highly sensitive to noise. A regulated power supply is needed to reduce noise.
A voltage output transducer does not need amplification. Voltage transducers tend to output 0
to 5 or 0 to 10 volts. Voltage transducers are less influenced by noise but are more costly.
Transducers that output current are least effected by noise. Current transducers are best used
when the signal must be transmitted over long distances. Due to the wire resistance there is a
voltage drop between the output of the transducer and the input into the microcontroller, this
has to be compensated for. Just prior to the microcontroller a known resistance is attached to
the circuit; this converts the current into a known voltage. Wire resistance has no effect on
The Omega PX139-30A4V was chosen to monitor the system pressure. These
transducers responded to absolute pressure, delivering an output signal from 0.25 to 4.25
volts. Differential transducers could have been used in place of an absolute pressure. The
differential transducer signal senses the difference between atmospheric pressure and the
baseplate vacuum pressure. In the future, if it is decided to use both compressed air and
vacuum at the same time, these types of transducers would not have the capability of
deciphering between too much positive pressure and too much negative pressure. Care must
be taken here!
Figure 10. Types of Pressure Readings
In order to decipher the difference an absolute pressure is used and the differential
pressure is computed. In order to compute differential pressure the system must take an
atmospheric reading at the beginning of each experiment. The differential pressure is the
absolute pressure minus the atmospheric pressure. This technique could cause potential
2.5 Data Acquisition
Data Acquisition (DAQ) is responsible for collecting signals from the transducer and
converting the data into a digital form. The Hercules SBC has a built in DAQ circuitry that
will allow up to 32 single-ended, 16 bit analog to digital conversions. It is capable of
performing 4 simultaneous, 12-bit resolution digital to analog conversion. The input range of
the A/D is programmable for either a 10 or 5 volts range. The circuit has the ability to
produce a stable output in 10 micro seconds.
The system developed by the Flexcell International Corporation (i.e., the Fx4000)
used four pressure transducers for controlling the systems pressure. Two transducers are used
to control a low range of pressures from 0 to 5 psi (34.474 kPa). The remaining transducers
are used to control higher pressures up to 15 psi (103.421 kPa). The reason for four separate
transducers was due to the hardware limitations of their interface board. The previous system
used an 8 bit Analog to Digital converter only.
2.5.1 15psi Transducer with an 8 bit A/D
ofbits InputRange solution #
2
Re =
Equation 1. General Resolution
Using 15 pounds per square inch (psi) transducer with a 5 volt output range and an 8
bit analog converter the resolution of the transducer to in the system is calculated using
Equation 1. Using this equation the system can only respond to changes in voltages greater
V InputRange
Voltage
solution numberofbits 0.01953125 256 5 2 5 2 ] [
Re = = 8 = ≈
Equation 2. Resolution of 5 volt range using 8bit A/D
To calculate the transducer resolution in pressure the following assumption are made.
There is a linear relationship between voltage and pressure. The transducer outputs 0 volts
when the input pressure is 0 psi. The transducer outputs 5 volts when the input pressure is 15
psi. Using the proceeding assumptions the following relationships were derived to relate
voltage and pressure.
[ ]
(
essured psi)
V
Voltage Pr gage
3 1 ]
[ =
, Pressure[psi]=3
[
(
Voltage[V])
]
Equation 3. 15psi Transducer Voltage vs. PressureSubstituting the minimal detectable voltage change into Equation 2 gives the transducer
resolution. The following calculations reveal that the system can detected a 0.404kPa change
in pressure using the 15psi transducer in association with an 8 bit A/D converter.
Table 4. 15 psi Resolution Calculation
Step 1. Pressure at 0 volts Pressure
( ) ( )
0v =30 =0psi Step 2. Pressure at minimumvoltage resolution Pressure
(
19.53125mv) (
=319.53125m)
=0.05859375psi Step 3. Final ResolutionCalculation psi kPa
2.5.2 5 psi Transducer with an 8 bit A/D
The same procedures were used to calculate the system resolution of a 5 psi
transducer in association with an 8 bit A/D. These calculations are shown below.
Table 5. 5 psi Transducer w/ 8 bit A/D Calculations
Step 1. Voltage resolution calculations
V InputRange
Voltage
solution numberofbits 0.01953125 256 5 2 5 2 ] [
Re = = 8 = ≈
Step 2. Voltage and Pressure relationship
[ ]
(
essured psi)
V
Voltage[ ]= Pr gage Step 3. Pressure at
0 volts Pressure
( )
0v =0psiStep 4. Pressure at minimum voltage resolution
(
mv)
psiessure19.53125 0.01953125
Pr =
Step 5. Final Resolution
Calculation psi kPa
V ess mV ess res P solution 135 . 0 01953125 . 0 ) 0 ( Pr ) 53125 . 19 ( Pr ) 1 ( Re = = − = Δ =
Theses calculations reveal that the system can detected a 0.135 kPa change in
pressure using a 5psi transducer along with the 8 bit A/D converter.
2.5.3 30psia Transducer with an 16 bit A/D
In today’s market the 8 bit A/D have been replaced with 12 and 16 bit technology.
The increase in number of bits allow for higher resolutions. Using Equation 1 for an 16 bits
A/D and 5 volt range reveals that the systems is able to detect a change in voltage as little as
76.294 micro volts.
V InputRange
Voltage
solution numberofbits 76.294μ
65536 5 2 5 2 ] [
Re = = 16 = ≈
The Omega px-139 transducer outputs 0.25 volts when the input pressure is at
absolute vacuum (0 psia). The transducer outputs 4.25 volts when the system is at its
maximum pressure of 30 psia. Figure 11 displays a graph of the relationship between
absolute pressure and output voltage.
Figure 11. Omega Px-139 Pressure Transducer Function
Calculating the slope and y intercept the following equations where derive.
[
]
(
Pr)
0.2515 2 ]
[V = essureAbsolute psia +
Voltage
[
(
[ ])
0.25]
2 15 ] [
PressureAbsolute psia = VoltageV −
Equation 5. 30 psia Transducer Voltage vs. Pressure
Repeating the resolution calculations reveals that the 30 psia transducer along with a
Table 6. 30 psia Transducer w/ 16 bit A/D Calculations
Step 1.
( )
(
)
kPa v
essure 0.25 1.875 2
15 0
Pr = − =−
Step 2.
(
)
(
)
a psi v
essure 76.294 0.25 1.87442779541 2
15 294
. 76
Pr μ = μ− =−
Step 3. kPa psi V ess V ess res P solution a 0039452 . 0 9 0005722045 . 0 ) 0 ( Pr ) 035 . 61 ( Pr ) 1 ( Re = = − = Δ = μ
Table 7 is a summary of the results from the pressure transducer resolution
calculations. These calculations reveal that a single 16 bit A/D will produce far more
information than the Fx4000 systems sensors configuration.
Table 7. Transducer Resolution Summary
Resolution
5 psi Transducer with 8 bit A/D
15 psi Transducer with 8 bit A/D
30 psia Transducer with 16 bit A/D
Voltage 0.01953125 volts 0.01953125 volts 76.294 micro volts
Pressure 0.135 kPa 0.404 kPa 0.0039452 kPa
2.5.4 Digital to Analog Conversion for Valve Control
Digital to Analog (D/A) circuit is used to control the spool position of the valve. The
Hercules SBC has 4, 12 bit D/A with programmable ranges. The D/A can output voltage
from -10 volts to 10 volts. To control the valve the range is program to output voltages from
0 to 10 volts. Using Equation 1 the resolution of the D/A to the valve is 0.00244140655 volts.
V InputRange
Voltage
solution numberofbits 0.00244140625 4096 10 2 10 2 ] [
Re = = 12 = ≈
The valves ports have a 5 volt range. Port 4 is completely open (0% closed) at 0 volts.
Port 4 is completely closed (100% closed) at 5 volts (See Table 3 for more information).
Using this information the following equation was derived.
[
]
(
SpoolPosition closed)
V
Voltage %
25 1 ]
[ = SpoolPosition[%closed]=25
(
Voltage[V])
Equation 7. Valve Voltage vs. Spool Position
Using the calculations below, the DAQ can control the valve with a spool resolution
of 0.061035 percent.
Table 8. Valve Spool Position Resolution Calculations using 16 bit A/D
Step 1. SpoolPosition
( )
0v =25( )
0 =0%Step 2. SpoolPosition
(
0.00244140625v)
=25(
0.00244140625)
=0.061035%Step 3. SpoolPosition= ΔS(1res) = S(0.0024V)−Press(0V) =0.061035%
2.5.5 Software Interaction with DAQ
The Table 9 provides a list of all the devices that are controlled by the onboard DAQ.
The Board class (board.cpp) was implemented to provide an interface with theses devices.
The initDAC and sample methods are used to read signals from the A/D. initDIO,
setDIValue, getDIValue is used to for digital I/O.
Table 9. DAQ Control Devices
Type Port Device/Pin# Note
Digital Out DIO A0 J8/1 External Power
Digital Out DIO B0 J8/9 LCD Screen
Analog IN Vin 0 J9/7 Transducer
The initDAC method is used to set the system registers to allow unipolar output from
0 to 10 volts. The sample returns the average of 75 A/D samples from the port configure in
initDAC. InitDIO method used to set the DAQ port for either input or output. The setDIValue
and getDIValue methods perform digital read or write operations.
2.6 Power Supply
All of the system hardware requires the use of DC power. The pneumatic control
system uses a 200 watt power supply to convert the AC voltage into DC. There is a need of
variety of DC power levels. The proportional valves are powered by 24 volts. The feedback
transducer uses 5 volts. The touch screen, PC-104, and storage device requires 12 volts. The
Sola Hevi-Duty GLQ-05-200 well surpasses the system power needs. This power supply
provides the following voltages: 5v (30A), 12V (8A), -12V (4A), 24V (4A). This power
supply offers vacant wattage and easy access screw terminals for future additional add-ons.
One advantage of this particular power supply is that the input voltage can vary from
85 to 264 VAC at frequencies 47 to 63 Hz. The robustness of the power supply allows the
system to operate in both the American and European standards. One disadvantage of the
power supply that it requires a 10% minimal load on its 5 volts source. A power resistor is
used in order to meet the minimal load requirement.
( )
R IV =
( )
R V V I P
2
= =
Using Equation 8 the system would require a resistor less than 1.67 Ohms to meet the
minimal loading of 15 watts. These calculations are shown below.
Step 1. Total Power Calculation of
primary source P=I
( )
V =5v(
30A)
=150wattsStep 2. Minimum Load Calculation 10%(150 watts) = 15 watts Step 3. Ideal Resistor Value
Ω ≈ =
= 1.67
15 52 2 P V R
Step 4. Power consumption using a 1.5
Ohms resistor R watts
V
P 16.67
5 . 1 52 2 = = =
A 35 watts 1.5 Ohms resistor (DigiKey TCH35P1R50J-ND) consumes 16.67 watts which
exceeds the minimal load requirements and stabilizes the power supply. This resistor requires
the use of a heat sink (DigiKey HS110-220-ND) to keep the resistor’s temperature levels
within its operating range.
2.7 External Device Control
The pneumatic control unit provides two AC outlets for external device control.
These outlets are design to control the vacuum pump or compressor. The outlet provides an
AC voltage at the same amplitude and frequencies as the input supply voltage. The circuitry
for these features consists of fuses, relays, and voltage regulators to supply an output signal
| | | L N G Power Pl u g Pane l Relay Socket --7 1----8 2----9 3----A 4----B 6--Relay Socket --7 1----8 2----9 3----A 4----B
6--|
| |
L
N G Power Pl
u g Pan e l DPDT Panel Switch L N G DPDT On/Off 12v Regulator
Vin Vo Gnd On/Off
+12V
DAQ Digital Output
Figure 12. External Event Circuitry
To protect the system from power disturbances two 15 amps fast blow fuses (Mouser
504-GMA-15) are located within the panel switch. The controllable voltage regulator
(Mouser 852-PQ12RD21JOOH) is enabled by the system DAQ. Once enabled the voltage
regulator supplies 12 volts to activate the DPDT relay (Mouser 528-38815-6).
An external event controller was developed to allow for the following external events
settings: Always On, Always Off, Auto On, and Timer. The executable setPower (compiled
from setPower.c) interacts with the circuitry to activate or deactivate the external power. If
the system is selected for “Auto On”, external power is provided when the experiments are
started and turned off when the experiment is completed. The Timer mode uses the built-in
Linux crond feature for external power control. The methods in scheduler.c interact with
2.8 Web Services
The popularity of the World Wide Web (WWW) in providing a vast array of
information has drawn a large number of users in the past few years. The dramatic increase
in of Internet users has led to the development of Internet assessable equipment such as
network printers and other devices. Users are now able to monitor and control these devices
from anywhere in the world when they have access to properly networked equipment. The
IAPCI uses network technology to allow user to setup, monitor, and run experiments from a
web browser such as Internet Explorer.
In order for the system to be accessed by a web browser a local web server is required
on each instrument. There are several available web servers currently available on the
market. The Apache HTTP server is one of the most powerful, stable, open source, web
server available that is compatible with Linux OS. The Apache HTTP server can be freely
downloaded at www.apache.com. The Apache server lacks a user interface, and one may find
it difficult to configure. There are various more user friendly web servers available that are
based on the Apache server. The Apache HTTP server is installed in to allow network
execution of HTML files, Java Applets, and Java Scripts. For additional dynamic web
features, open source PHP (www.php.net) plug-in for Apache is installed on the system to
allow for general purpose HTML scripting.
The Apache server communicated with an onboard SQL server for data storage. SQL
serves allow for fast convenient access to shared data over the network. The IAPCI uses
MySQL (www.mysql.com) for data transactions. MySQL is reliable open source database
such as “MySQL Query Browser”, and “MySQL Administrator” that are useful for real time
debugging. Figure 13 displays important global variables that are accesses by the SQL
server.
Figure 13. SQL Variables
Chapter 3. User Interface
User interfaces were developed to interact with the system hardware components.
They provide user with the capability to create, start, and monitor a simulation or a real
experiment with the appropriate feedback, and of viewing the results as they become
available. There are two type of user interface for the pneumatic control system. The first
type of interface is the Control Client. This interface runs locally on each machine and is
accessed using the touch screen display. The second type of interface allows remote
operation of the system. This type of interface is discussed in Section 3.2 Remote Interface.
3.1 Control Client
The Control Client GUI is written in Java. This class is design to execute as an applet
or an application. When Java applications are executed the main method is automatically
invoked. Applets are started by the browser call to the init and start method. The appearance
of the interface is affected depending upon whether the interface is executed as an application
or applet. The Control Client application appears on the touch screen display requires larger
components than an Applet. The enlarge components allows for easier selection using a
touch screen. The IAPCI system lacks an external keyboard which is usefully for data entry.
The application implements an on-screen keyboard which assist the user in data entry. Data
entry for the application is kept to a minimal. The browser client allows for additional data
entry and full control of the system. The following sections discuss individual aspects of the
3.1.1 Communication Utilities
Sun Java has developed a protocol, Java Database Connectivity (JDBC), to allow for
interaction with various SQL database. The JDBC doesn’t interact with the database directly,
it communicates directly with drivers which then communicates with the database. There are
different types of JDBC drivers. Many of these drivers require local installation on each
client machine. This requirement reduces the robustness of operation the IAPCI system when
run remotely from any web browser. To work around this issue the MySQL support is
compiled directly into the code. The MySQL class was developed to interact with the IAPCI
system MySQL database. This class contains methods such as getRegimen() and getLog()
that is essential to the user interface.
3.1.2 On-Screen Keyboard
The system provides two on-screen display interfaces for data input. The
AlphaNumInput class provides an interface to allow both alpha and numeric inputs. The
Input class is used for only numerical inputs. The system GUI classes implements the
java.awt.event.FocusListener interface. When an editable text field receives focus the
focusGained method is called. This method saves the current text field information and either
Figure 15. On-Screen Keyboard
3.1.3 Connection Class
To give a more “commercial” feel to the IAPCI system, and to provide a more
realistic user interface, it was given the designation Fx5000, with the permission of the
Flexcell International Corporation. This permission was sought because we were using the
Fx4000 as the basis of our new design. The Fx5000 class was created to allow user friendly
methods to login into the unit, remotely or locally. This class is invoke by the issuing
following command; “java –jar Fx5000.jar fullscreen”. The command line argument,
“fullscreen” is an optional argument to resize the GUI to the screen maximum resolution.
Figure 16. Connection Screen
This class creates a window frame (shown in Figure 16) that contains the Flexcell logo, a
combo box with contains the host address, three labels with relating text fields for the
username, password, and port, a text field that displays error messages, a login, clear, and
cancel/restart buttons.
• [Server Host] This combo box, maintains a list of known host address. This list is
imported from the ASCII text file conn.dat. The combo box is editable to allow for
additional host names that are not listed in the file. The default host, ‘localhost’ or
allow users to access secondary units, from the main unit. The secondary units may
not contain touch screen displays.
• [<<] This button is used to remove hosts from the system. The hosts are removed
from the combo box as well as from the conn.dat file.
• [Username] Case sensitive String containing a valid username.
• [Password] This text field allows the user to enter a case sensitive password. The
password is not visible on the screen.
• [Port] This text field provides the port in which is used to connect to the control
server. The control server default port is 9001.
• [Login] The login button is used to authenticate with the system. If the username and
password are incorrect an error message will be display on the screen. If a successful
authentication the host is added to the conn.dat file and a new instance of the
FxClient class is invoked.
• [Clear] The clear button removes text from the username and password text fields.
• [Cancel] This button is used to exit the execution of the program. System.exit(1) is
use to terminate the program.
• [Restart] If the application is started using the full screen argument the [Cancel]
button is replaced with [Restart]. This button is used to restart the system. The
3.1.4 Client Class
Once a user logs into in to the system, the window frame changes it current panel to
the FxClient panel. The FxClient panel consists of the following tab panes: System Control,
System Status, Plot Config, External Event Control, Network Config, and Log Off.
3.1.4.1 System Control Pane
The System Control Pane consists of two combo boxes and ten buttons to allow users
to configure, start, and stop pneumatic pressures. Figure 17 contains a screen shot of the
• [Combo box “Regimen Name”] The first combo box contains a list of all the
available regimens. The combo box contents are retrieved from the SQL database
using the MySQL.getRegimens(). MySQL.getRegimens() returns a vector of Strings
containing the regimen names.
• [Combo box “Baseplate”] This combo box contains a list of all the available
baseplates. This list is created similar to the previous combo box using the function
MySQL.getBaseplates().
• [Assign] This button notifies the system that the user has chosen a regimen and a
baseplate. These selected items are changed by using the corresponding [+] or [–]
buttons or by using the combo box. The currently selected regimen and baseplate is
used for the chosen assignment. Once the assignment is completed the user can no
longer change the regimen and the baseplate until it is unassigned. The selected
regimen, baseplate, user, and current time are updated to the SQL database and the
current user name is displayed at the bottom left hand corner of the screen.
• [Unassign] The Unassign button stops the experiment, if running, and then reset the
system to allow the user to select alternative regimen and/or baseplate. The selected
regimen, baseplate, and user are cleared from the SQL database.
• [Run] This button is use to start the pneumatic control process. Once this button is
pressed the graph in the System Status pane (See Figure 18) is cleared and the control
• [Simulate] This button is use to simulate the pneumatic control process. This process
is similar to the process started by run except for in simulation actual waveforms are
not applied to the baseplates.
• [Pause/Resume] This button is used to pause and resume the experiment.
• [Stop] This button is used to stop running experiments.
3.1.4.2 System Status Pane
The System Status Pane as seen in Figure 18, it provides the user with information
regarding the current status of a running experiment. The red curve is the graph of desired
waveform. The blue curve displays the actual waveform obtained from by the system. These
graphs are generated from querying the SQL database using the fxclient.db.getStatus()
method. This method is called every second if the experiment is started and if System Status
Pane is visible.
The fxclient.db.getStatus() method provides the client with the data structure Status.
The Status class contains data such as current step, cycle, min, max, elapsed time, and
remaining time.
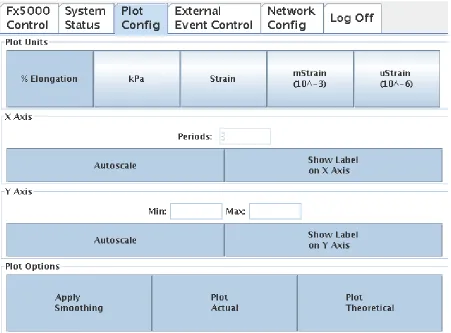
3.1.4.3 Plot Config Pane
The Plot Config Pane is design to control how the information is display on the
System Status Pane. The Plot units are change by pressing the corresponding button on the
Other plots setting are control using the buttons below.
• [X Axis Autoscale] This button allows the users to change the number of periods
displayed on the graph. The default setting allows the users to view 3 periods of the
waveform. Note: Changing the number of display periods only affects the current
clients display.
• [Show Label on X Axis] This button is used to remove or add the time label on the
graph.
• [Y Axis Autoscale] This button allows the users to change the y axis range of the
waveform. If Autoscale is enabled and an active experiment of running the y axis is
set to show the full range of the actual results. If simulating the y axis is set to show
the full range of the desired waveform.
• [Show Label on Y Axis] This button is used to remove or add the unit label on the
graph.
• [Apply Smoothing] This button is used to apply a 5 point moving average on the
results.
• [Plot Actual] This button is used to enable or disable the plot of the actual waveform.
• [Plot Theoretical] This button is used to enable or disable the plot of the expected
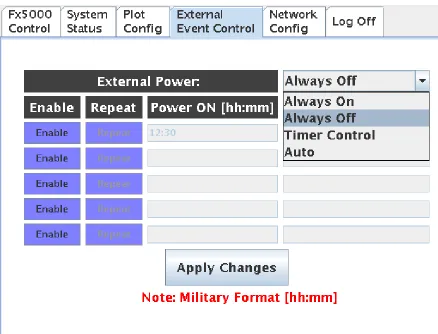
3.1.4.4 External Event Control Pane
The External Event Control Pane, as seen in Figure 20, provides a user interface for
control external power events. This interface contains a combo box where the user can select
the power modes as list in Section 2.7 External Device Control. The selected power mode is
stored in the SQL database using the MySQL.setPowerMode() method.
Figure 20. External Event Control Pane
The user interface provides buttons and text fields to allow up to five timed
[Power OFF] text field are enabled and editable. The [Repeat] button allows the event to
occur for multiple days until it is disabled. The Timer events are stored in the SQL database
using the MySQL. setPowerStatus().
3.1.4.5 Network Config Pane
The Network Config Pane is essential for the proper setup of the device. This Pane
provides the user with the current IP address which is needed to fully control this device. The
system default network status is displayed in the IP address, subnet mask, and default
gateway text field.
The default configuration allows the system to automatically connect to the network
using Dynamic Host Configuration Protocol (DHCP). The user interface provides a radio
button to allow for manual network configurations. If “Use the following IP address” radio
button is selected the text fields are enabled and editable. Once enabled the Input class
interface is displayed to allow user to input the network information. Network changes are
not effective until the [Apply] button is pressed. Pressing the [Apply] button executes the
command setNetwork (compiled from network.c) with the IP address, sub mask, and gateway
as the input arguments. setNetwork is responsible changing the network configuration. These
changes are effective at the end of execution and there is no need for a system restart.
Figure 22, display a screen shot of the Log Off Pane. This Pane allows the user to
either log-off or restart the system. If the user choose to the log-off the connection to the
server are closed and the window pane is change to the Fx5000 Panel.
3.2 Remote Interface
The remote interface is designed to fully control the pneumatic culture system. The
touch screen interface was primary designed to monitoring the system, but it does include
control features such as stopping and starting the device(s). There a several methods used for
remote interfacing. One method is too developed and distribute network applications. These
applications are usually are installed on each client machine. An example of this type is the
once famous “Kazaa”. In the early 21st century, Kazaa was a popular application using the
Peer-To-Peer (p2p) internet protocol for file sharing. To interact with the file server each user
would have to download and install the application on their personal machine. This
installation procedure reduces the availability of accessing the machine remotely. Another
disadvantage of network applications is the capability of the software between different
operating systems such a Palm OS, Pocket PC, Windows, and Linux. The Remote Interface
makes use of the web browser to communicate with the pneumatic culture system. Web
browsers such as Internet Explorer are becoming standard applications and are usually
included with the operation system. Advantages of using a web browser are that the average
typically easier to update for future development. The following sections provide an
overview of the web pages used to interact with the pneumatic culture systems.
3.2.1 Control.php
Once the user is properly authenticated the screen shown in Figure 23 is visible by the
browser. The FxClient applet is embedded within control.php. This applet is identical to the
Client class mentioned in Section 3.1.4 Client Class.
Figure 23. control.php
3.2.2 Regimen.php
The regimen.php provides a user interface for configuring experiments (Regimens).
![Figure 1. Longitudinal Stretch [2]](https://thumb-us.123doks.com/thumbv2/123dok_us/1345028.1167367/12.612.177.441.239.501/figure-longitudinal-stretch.webp)
![Figure 2. Compression Loading [2]](https://thumb-us.123doks.com/thumbv2/123dok_us/1345028.1167367/13.612.178.451.354.574/figure-compression-loading.webp)
![Figure 3. Out-of-Plane Loading [2]](https://thumb-us.123doks.com/thumbv2/123dok_us/1345028.1167367/14.612.162.468.215.464/figure-out-of-plane-loading.webp)
![Figure 4. In-Plane Loading [2]](https://thumb-us.123doks.com/thumbv2/123dok_us/1345028.1167367/15.612.141.491.73.327/figure-in-plane-loading.webp)