ABSTRACT
RAPPLEYE, DEVIN SPENCER. Developing Safeguards for Pyroprocessing: Detection of Plutonium Co-deposition on a Solid Cathode in an Electrorefiner by Applying the Signature-Based Safeguards Approach. (Under the direction of Dr. Man-Sung Yim and Dr. Korukonda L. Murty).
Pyroprocessing is a promising technology for the reprocessing of spent nuclear fuel
(SNF). One of its claimed benefits is its resistance to proliferation. However, as with any
separation of SNF, it is not completely immune to the diversion of special nuclear material
(SNM). Thus, safeguards need to be applied to pyroprocessing to prevent the diversion of
SNM. However, traditional methods of material control and accountancy cannot feasibly be
applied with current technology, largely due to the inability to precisely determine input
quantities of SNM from the spent fuel. Thus, alternative methods need to be developed to
track and confirm the flow of SNM for pyroprocessing. A prominent feature in some of the
proposed safeguarding methods is an accurate process model of pyroprocessing. One of the
more complex process units to model is the electrorefiner due to the many phenomena
occurring. The performance of an electrorefiner model is examined for the detection of
plutonium co-depositing on a solid cathode. The effect of the plutonium-to-uranium ratio and
the exchange current density (EXCD) on the co-deposition of plutonium and the
accompanying indicators are examined.
Using the model, a depressed cathode potential and an elevated cell current are
indentified as potential indicators of the co-deposition of plutonium. Both of these are
the prediction of the cathode potential that could result in inaccurate and untimely detection
of plutonium deposition on the cathode.
A model is developed that predicts the deposition rates at the cathode without
complete knowledge of the compositions in the electrorefiner by using the values of the
cathode potential at different requested cell current values. Although the model uses rough
estimates of parameters, the predicted composition and deposition rate values and trends are
consistent with ERAD. The model provides a theoretical basis for the method of
signature-based safeguards for pyroprocessing. Accuracy of the model can be improved by better
characterization of each species’ reaction area, mass-transfer coefficient, EXCD and activity
© Copyright 2012 by Devin Spencer Rappleye
Developing Safeguards for Pyroprocessing: Detection of a Plutonium Co-deposition on Solid Cathode in an Electrorefiner by Applying the Signature-Based Safeguards Approach
by
Devin Spencer Rappleye
A thesis submitted to the Graduate Faculty of North Carolina State University
in partial fulfillment of the requirements for the degree of
Master of Science
Nuclear Engineering
Raleigh, North Carolina
2013
APPROVED BY:
_______________________________ ______________________________
Dr. Man-Sung Yim Dr. Korukonda L. Murty
Committee Co-Chair Committee Co-Chair
________________________________ ________________________________
Dr. David N. McNelis Dr. Michael F. Simpson
________________________________ ________________________________
DEDICATION
BIOGRAPHY
Devin, raised in South Jordan, Utah, graduated from Bingham High School in 2003. During
high school, he served in student government as a vice-president of the student body. After
graduating, he spent two years serving a mission for the Church of Jesus Christ of Latter-day
Saints in Lithuania. In 2010, he graduated with a B.S. in Chemical Engineering from
Brigham Young University. This combination of political, international and technical
ACKNOWLEDGMENTS
A special thanks to the following individuals and organizations who contributed to this work:
Dr. Man-Sung Yim for advising me despite being in South Korea. He has sacrificed
many odd hours of the days to consult me here, in North Carolina.
Dr. Korukonda L. Murty for accommodating this long-distance advisement by
providing on-site advisement.
Dr. Michael F. Simpson for invaluable technical advisement and insights on
safeguards and pyroprocessing. His contributions to this work are irreplaceable.
Dr. David N. McNelis for support and guidance on the research process. His foresight
and experience helped me avoid many pitfalls.
Dr. Jun Li for technical assistance in model selection, modification and development.
Riley Cumberland for his patience while familiarizing me with ERAD.
Robert Hoover for his introduction to the modeling efforts of pyroprocessing.
Dr. Supathorn Phongikaroon and Robert Hoover for their technical review during the
development of the model in this work.
The Russell Family Foundation for funding this work.
My wife, Joslyn, for her patience as my work has crept into evenings, weekends and
has sometimes taken me away from the home for days at a time.
TABLE OF CONTENTS
LIST OF TABLES ... vi
LIST OF FIGURES ... vii
LIST OF SYMBOLS ... ix
LIST OF ABBEVIATIONS ... x
1 Introduction ... 1
1.1 History ... 2
1.2 Description of Pyroprocessing... 3
1.3 Safeguards ... 7
2 Theory ... 14
2.1 Electrochemical Cell ... 14
2.2 Potential ... 15
2.3 Current ... 18
3 Models... 22
3.1 UI Model... 23
3.2 ERAD ... 23
3.3 UNC Model ... 24
3.4 Selection ... 24
4 Diversion ... 25
5 Plutonium-to-Uranium Ratio Study ... 26
5.1 Results ... 27
5.2 Discussion ... 33
6 Exchange Current Density Sensitivity Study ... 41
6.1 Calculation Results ... 42
6.2 Discussion ... 54
7 Proposed Method for Signature-Based Safeguards ... 59
7.1 General Approach ... 60
7.2 Model Development ... 65
7.3 Results ... 68
7.4 Discussion ... 70
8 Conclusion ... 71
REFERENCES ... 73
APPENDICES ... 76
Appendix A: Representative Input File and Parameters for PUR and EXCD Studies ... 77
Appendix B: Calculation of EXCD ... 80
Appendix C: Plots from EXCD Sensitivity Study ... 81
Appendix D: Abnormal Runs in EXCD Sensitivity Study ... 89
Appendix E: Model User Interface and Code ... 90
LIST OF TABLES
Table 1.1 EBR-II Spent Fuel Composition [10] ... 7
Table 1.2 Significant quantities for SNM as determined by the IAEA [11] ... 9
Table 2.1 Standard Reduction Potential of Species in Table 1.1 vs. Ag/AgCl Reference Electrode at 500 °C [8] ... 18
Table 5.1 Test matrix and plutonium deposited using a fixed EXCD of 0.5 A/m2 ... 28
Table 5.2 Amount of plutonium deposited for each case using a variable EXCD ... 31
Table 5.3 Fitting parameters for the linear equation Y=A∙X+B for Figure 5.6 and Figure 5.7 ... 36
Table 5.4 Comparison of plutonium deposition for variable and fixed EXCD of 0.5 A/m2 ... 38
Table 5.5 Variable EXCD values ... 38
Table 5.6 Comparison of plutonium deposition for a variable and fixed EXCD of 5 A/m2 ... 39
Table 5.7 Comparison of the average cathode potential for a variable and fixed EXCD of 0.5 A/m2 ... 40
LIST OF FIGURES
Figure 1.1 Simplified Flowchart of Pyroprocessing ... 4
Figure 1.2 Mark-IV Electrorefiner [9] ... 6
Figure 2.1 Representation of the Mark–IV electrochemical cell ... 15
Figure 5.1 Plutonium deposited on cathode at each PUR value for a fixed EXCD ... 29
Figure 5.2 Cathode potentials at each PUR value for a fixed EXCD ... 30
Figure 5.3 Anode potentials at each PUR value for a fixed EXCD ... 30
Figure 5.4 Plutonium deposited on cathode at each PUR values for a variable EXCD ... 32
Figure 5.5 Cathode potentials at each PUR value for a variable EXCD ... 32
Figure 5.6 Average electrode potentials versus uranium composition in the ER salt ... 35
Figure 5.7 Averaged electrode potentials versus plutonium composition in the ER salt . 35 Figure 5.8 Plot of cathode potential against plutonium deposited on a semi-log plot ... 37
Figure 6.1 Typical cathode profile from EXCD sensitivity study ... 43
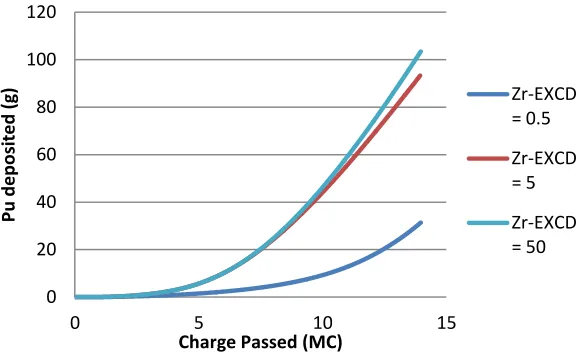
Figure 6.2 Plutonium deposition for select values of EXCD ... 45
Figure 6.3 Cathode potential profiles for select values of EXCD ... 46
Figure 6.4 Plutonium deposited versus the EXCD of U with EXCD of Pu and Zr varying ... 48
Figure 6.5 Plutonium deposited versus the EXCD of U with the EXCD of Pu and Zr fixed ... 48
Figure 6.6 Amount of charge passed before plutonium deposition begin in a run ... 49
Figure 6.7 Average cathode potential versus EXCD of U with the EXCD of Pu and Zr fixed on a semi-log plot ... 50
Figure 6.8 Range of the cathode potential versus the EXCD of U with EXCD of Pu and Zr fixed on a semi-log plot... 50
Figure 6.10 Average cathode potential versus the EXCD of Pu with the EXCD of U and
Zr fixed on a semi-log plot... 52
Figure 6.11 Range of the cathode potential versus the EXCD of Pu with EXCD of U and Zr fixed on a semi-log plot... 53
Figure 6.12 Plot of plutonium deposition on cathode at U-EXCD and Pu-EXCD equal to 0.5 A/m2 ... 54
Figure 6.13 Salt inventory of uranium for a fixed EXCD of 0.5 A/m2 for Pu and Zr... 55
Figure 6.14 Anode inventory of zirconium for a fixed EXCD of 0.5 A/m2 for U and Pu . 56 Figure 6.15 Cathode potential profile at the transition to co-deposition of U and Pu... 58
Figure 7.1 Example current and potential profiles for the application of deposition model for two species ... 61
Figure 7.2 Flowchart of solving method for the determination of deposition rates from cell current and cathode potential ... 64
Figure 7.3 Fit of mass-transfer coefficient from ERAD data ... 67
Figure 7.4 Absolute error between predicted and ERAD concentrations ... 69
LIST OF SYMBOLS
Symbol Meaning Symbol Meaning
Electrode surface area Species
activity Reaction rate constant
Concentration Molar flux
Diffusion coefficient Electrons transferred
Electrode diameter R Universal Gas Constant
Electrode potential Reaction rate
Faraday’s constant Reynolds number
Mass-transfer coeffient Temperature
I Current Schmidt number
Current density Sherwood number
Greek
Transfer coefficient Overpotential
Activity coefficient Stoichiometric coefficient
Diffusion layer thickness Rotational velocity of electrode
Superscripts
Anode Standard
Cathode Surface
Subscripts
Concentration Current step/setting
Equilibrium Exchange
Forward Operational
Reduced species Reverse
LIST OF ABBEVIATIONS
AFCI Advanced Fuel Cycle Initiative
ANL Argonne National Laboratory
B-V Butler-Volmer
CRIEPI Central Research Institute of Electric Power Institute
DA Destructive Analysis
EBR-II Experimental Breeder Reactor – II
ER Electrorefiner
ERAD Enhanced REFIN with Anodic Dissolution
EXCD Exchange Current Density
FCF Fuel Cycle Facility
FP Fission Products
HEU Highly Enriched Uranium
HFEF Hot Fuel Examination Facility
HLW High-level waste
IAEA International Atomic Energy Agency
IFR Integral Fast Reactor
INL Idaho National Laboratory
KAERI Korea Atomic Energy Research Institute
LEU Low-Enriched Uranium
MC Megacoulombs
MC&A Material Control and Accountability
MOX Mixed-Oxide
NDA Non-Destructive Assay
OCP Open-Circuit Potential
PCR Plutonium-to-Curium Ratio
PUR Plutonium-to-Uranium Ratio
PRIDE PyRoprocess integrated Inactive DEmonstration
PUREX Plutonium – Uranium Extraction
SNF Spent Nuclear Fuel
SNM Special Nuclear Material
SQ Significant Quantity
TRU Transuranic
UI University of Idaho
1
Introduction
Pyroprocessing is a promising technology for reprocessing spent nuclear fuel (SNF).
At the core of the process is the electrolysis of transuranics, specifically uranium and
plutonium, from SNF. The process of the separation of materials via electrolysis is referred to
as electrorefining. It has yet to be employed for industrial purposes. However, the U.S.,
South Korea, Japan and India are actively researching pyroprocessing [1, p. 1]. One of the
advantages of pyroprocessing over the traditional reprocessing technology, PUREX, is the
prevention of pure plutonium separation which is the material of concern for nuclear
proliferation. However, it is not completely immune to the diversion of special nuclear
material (SNM). Operational conditions of pyroprocessing can be altered to divert the flow of
plutonium. Domestically at Idaho National Laboratory (INL), Material Control and
Accountability (MC&A) – the tracking of SNM inventory in a process – has been applied to
an engineering-scale pyroprocessing operation for treatment of spent fuel from the
Experimental Breeder Reactor – II (EBR-II). However, this approach relies upon reactor
calculations for input quantities of SNM and involves destructive analysis based sampling
that does not meet the timeliness requirements of the International Atomic Energy Agency.
Therefore, it is not appropriate for achieving safeguards of facilities operating in non-nuclear
weapons states. Thus an alternative method of safeguarding SNM is required for
pyroprocessing
In this section, pyroprocessing’s history, key operations, and potential safeguards
pyroprocessing that inhibit the application of MC&A as a reliable safeguards approach.
Proposed alternatives to MC&A for safeguarding pyroprocessing are discussed to provide the
motivation and context of this work.
1.1
History
Until the 1980s, very little research had been done on the electrorefining of SNF. In the
mid-1950s, Knolls Atomic Power Laboratory used electrorefining to decontaminate
irradiated uranium [2]. At Los Alamos National Laboratory, in the 1960s, plutonium was
successfully electrorefined from used fuel from the Los Alamos Molten Plutonium Reactor
Experiment [3]. In 1984 research began at Argonne National Laboratory (ANL) on the
Integral Fast Reactor (IFR) [4]. Accompanying the IFR was a pyrochemical process –
pyroprocessing – that reprocessed fuel from the IFR.
Before ANL’s work, uranium and plutonium had not been simultaneously
electrorefined. The work at ANL laid the groundwork for the demonstration of the IFR. At
INL, EBR-II would serve as the test bed for the IFR developmental program along with the
Fuel Conditioning Facility (FCF). The designed pyrochemical process would be used to
separate used fuel, fabricate uranium-plutonium-zirconium fuel and process high-level waste.
However, in 1994 EBR-II was shutdown marking the end of U.S. IFR program [5].
Notwithstanding, the FCF could still be used to process EBR-II used fuel to make it suitable
for permanent disposal. Demonstration of pyroprocessing to treat the used EBR-II fuel was
In 2002, the Advanced Fuel Cycle Initiative (AFCI) funded continuing research and
development of pyroprocessing. Under AFCI, the process was expanded to include spent
oxide fuel reduction expanding pyroprocessing capabilities beyond metal fuel processing.
In addition to the work in the US, Japan’s Central Research Institute of Electric Power
Institute (CRIEPI) and the Korea Atomic Energy Research Institute (KAERI) are actively
researching pyroprocessing. KAERI especially has been aggressively pursuing
pyroprocessing technologies. In late 2011, KAERI finished construction on a 10t/yr
pyroprocessing facility named PRIDE (PyRoprocess integrated Inactive DEmonstration)
facility which does not process SNF, rather a surrogate uranium based material [6]. While
there are other countries researching pyroprocessing, these two countries are of particular
interest because they do not currently possess nuclear weapons. For these two countries, or
any other non-nuclear weapons states, the possibility of pyroprocessing being misused for
military purposes needs to be examined. Providing an assurance of nuclear safeguards would
be an important prerequisite for any commercial development of pyroprocessing technology.
1.2
Description of Pyroprocessing
INL has developed pyroprocessing on an engineering-scale at the FCF. This facility is
the ideal candidate for the safeguards analysis of pyroprocessing because of its
well-documented operation, the extensive nature of available data and its size. As presently
constituted at INL’s FCF, pyroprocessing is a batch process. Due to the high radioactivity of
The material moves from one unit of operation to the next in discrete movements. A
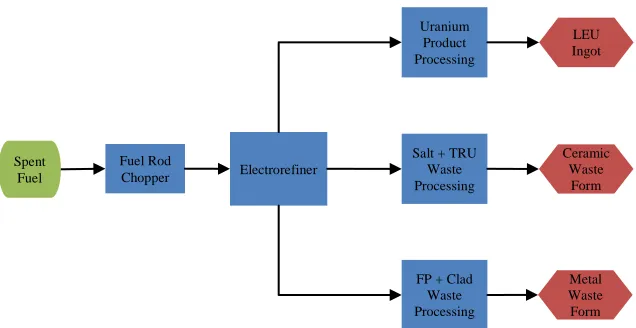
simplified flow chart of pyroprocessing of metallic spent fuel is shown in Figure 1.1. A more
detailed description of the entire process is available in other publications [7, pp. 28-32, 8,
pp. 3-6]. Notably, oxide spent fuel can be processed if it is first electrochemically reduced to
metallic form. This adds only one to three additional steps to the process given in Figure 1.1.
Initially, the SNF rods are chopped into small quarter-inch pellets. These pellets are
loaded into perforated baskets which serve as the anode in the electrorefiner (ER). Up until
the ER, all of the feed material flows in one line. The ER partitions SNF into three phases:
anode baskets, electrolyte and cathode deposits. Once the anode baskets have been loaded
into the ER, a current is applied. Uranium, other actinides and the more active fission
products (FP) in SNF are oxidized and transported into the electrolyte. Of the species Figure 1.1 Simplified Flowchart of Pyroprocessing
LEU Ingot
Fuel Rod
Chopper Electrorefiner
Uranium Product Processing
Salt + TRU Waste Processing
uranium product is processed into an ingot of low-enriched uranium (LEU). The
transuranics (TRU) and fission products remaining in the salt are processed into a ceramic
waste form. The fission products remaining in the anode baskets are processed along with the
fuel cladding into a metal waste form. Both waste forms are considered high-level waste
(HLW).
Several aspects of this process design provide challenges for the use MC&A. First the
feed material is not homogeneous. The isotopic composition of SNF varies spatially which
results in each chopped fuel rod segment having a different composition. The amount of each
nuclide fed to the process is predicted using ORIGEN calculations and adjusted based on
random sampling which introduces uncertainty and a time delay. Second, there is a large
amount of material hold-up in the ER, which further complicates the task of mass tracking.
1.2.1 Electrorefiner
Pyroprocessing at INL’s FCF consists of two parallel lines, one for EBR-II’s driver
fuel and the other for EBR-II’s blanket fuel, each with its own ER, the Mark-IV and Mark-V
respectively. The research presented in this thesis focuses on the Mark-IV ER configuration.
A representation of the Mark-IV electrorefiner is found in Figure 1.2. The Mark-IV uses four
rectangular stainless steel fuel baskets arranged in a cruciform geometry as the anode. The
anode is loaded into a molten eutectic mixture of 59 mol% lithium chloride (LiCl) and 41
mol% potassium chloride (KCl) which serves as the electrolyte. Beneath the electrolyte is a
dendrites. The electrorefiner operates at 500°C. During operation the LiCl-KCl mixture is
stirred by the rotation of the electrodes. The cadmium pool is mixed by a stirrer.
Figure 1.2 Mark-IV Electrorefiner[9]
As mentioned previously, the feed material for the Mark-IV is EBR-II’s driver fuel.
Li and Simpson[10] performed a study in which the typical composition of SNF in the anode
baskets was determined. While composition varies from batch to batch, Table 1.1 gives an
Table 1.1 EBR-II Spent Fuel Composition [10]
Element Weight (g) Wt%
Uranium 8070 80.6
Zirconium 1080 10.8
Sodium 216.0 2.16
Neodynium 93.10 0.930
Cesium 77.30 0.773
Molybdenum 77.20 0.771
Cerium 54.20 0.542
Plutonium 41.40 0.413
Ruthenium 40.70 0.407
1.3
Safeguards
Safeguards are a collection of verification and inspection methods used to ensure the
peaceful use of nuclear materials. The main objective of safeguards according to the
International Atomic Energy Agency (IAEA) is “the timely detection of diversion of
significant quantities of nuclear material from peaceful nuclear activities to the manufacture
of nuclear weapons or of other nuclear explosive devices or for purposes unknown, and
deterrence of such diversion by the risk of early detection” [11, p. 13]. Safeguards are applied
to facilities that handle nuclear material. These include enrichment plants, fuel fabrication
plants, nuclear reactors and reprocessing plants among others. Because pyroprocessing is
considered reprocessing technology, safeguards are required for the process.
Pyroprocessing holds an advantage in proliferation resistance over the traditional
aqueous based PUREX (Plutonium – URanium EXtraction) process. In the PUREX process,
pure plutonium is isolated from other actinides and fission products. Subsequently, uranium
Alternatively, pyroprocessing selectively removes uranium from SNF and plutonium is left in
a mix of actinides and active fission products or co-extracted with uranium. However, no fuel
separation technology can be assumed immune to being misused for diversion of SNM.
1.3.1 Traditional Safeguards
Traditionally, the tracking of materials is accomplished by MC&A. With PUREX, this
is more readily accomplished. At the beginning of the process, SNF is completely dissolved
in a dissolution tank commonly referred to as the “accountability tank.” This tank provides a
homogeneous sample from which the composition of the feed can be determined. Because
PUREX is a continuous process, the flow of this material can be tracked through the system
using flow rates. Thus by performing material balances on the process an expected product
inventory can be calculated and used to verify that the actual inventory is within a tolerable
amount of error. MC&A is a proven method for safeguarding the PUREX process, as a case
in point being the Rokkasho Reprocessing Plant in Japan.
The tolerable amount of error, as determined by the IAEA is one significant quantity
(SQ) or less over a material balance period [11, p. 25]. A material balance period is the time
between two consecutive physical inventory measurements. A SQ is “the approximate
amount of nuclear material for which the possibility of manufacturing a nuclear explosive
Table 1.2 Significant quantities for SNM as determined by the IAEA [11]
Material Amount
Direct Use Nuclear Material
Pu (containing less than 80% 238Pu) 8 kg
233
U 8 kg
Highly Enriched Uranium (HEU) – 235U ≥ 20% 25 kg*
Indirect Use Nuclear Material
Low-Enriched Uranium (LEU) - 235U < 20%, Natural Uranium
Depleted Uranium
75 kg* 10 t 20 t
Thorium 20 t
*Amount refers to mass of the 235U isotope
Early analyses of the application of traditional safeguards to pyroprocessing
demonstrate an unacceptably high level of inventory uncertainty [7, 12]. Uncertainty in the
inventory of SNM is introduced by the feed material. Because pyroprocess has no
“accountability tank” or any other homogeneous mixture before the process, the feed
inventory is approximated using burn-up calculations. These calculations are verified or
corrected using destructive analysis (DA) of random spent fuel rod samples which can create
a lag-time of months.
In addition to the challenge of characterizing the feed SNF, the material needs to be
tracked in the system. Non-destructive assay (NDA) techniques could provide some insight
into the flow of material, but “have an uncertain level of several percent” [7, p. 34]. Also
complicating the use of NDA is the high radiation environment. Additionally, the large
amount of holdup of plutonium in the ER adds a significant level of uncertainty. Simpson
near the 8 kg significant quantity for Pu based on a realistic total inventory in an
industrial-scale electrorefiner.”
1.3.2 Pyroprocessing Safeguards
Several options and methods have been proposed for pyroprocessing to either
compensate for the shortfall of traditional safeguards or alter the approach of safeguards to
take advantage of some features of pyroprocessing. Methods and approaches are still being
developed and designed. INL is currently developing an acceptable safeguards approach for
pyroprocessing using the “FCF as a scientific and experimental baseline” [1, p. 1]. Similarly,
South Korea has been researching possible safeguards methods [13]. This section reviews the
specific tools and methods being developed for safeguarding pyroprocessing.
1.3.2.1 Neutron Balance and Curium Accounting
Part of many of the proposed options for safeguarding is a neutron balance [14, pp.
30-31]. This involves a total neutron measurement of each pin of SNF introduced into the
process, the electrorefiner, the metal waste form, the ceramic waste form and the uranium
product. It would also incorporate process monitoring of the electrorefiner [14, p. 30].
The bulk of the neutrons in SNF are attributed to curium. The plutonium-to-curium
ratio (PCR) of SNF can be determined using DA. If that ratio is assumed to be constant
throughout the process, the amount of plutonium can be determined from neutron count.
the difficulty of tracking plutonium using curium. In the experiments, there was not a
significant accumulation of curium in salt to be detected using DA. However, this work was
performed EBR-II, a fast reactor, spent fuel which has low curium-244 content. Likewise,
South Korea is researching the applicability of Laser Induced Breakdown Spectroscopy
(LIBS) and high-resolution gamma-ray spectroscopy coupled with FRAM analysis code for
the real-time monitoring of the PCR [13].
1.3.2.2 Electrorefiner Assay
This technique is essentially a mass balance on the electrorefiner. This requires a
series of assays on all streams entering and leaving the electrorefiner over multiple batches.
The method “relies on elaborate analyses that would certainly impact operations and cause
delays between processing steps” [14]. Additionally, the assumption of a constant PCR is
made which, as discussed, is not a certainty in pyroprocessing. However, process monitoring
could be used to confirm the validity of the assumption.
1.3.2.3 Homogenized Input
Another suggested method is to homogenize the input by producing a molten solution
of the chopped fuel elements that is well-mixed [14]. This would allow for an accurate
assessment of plutonium feed inventory and the PCR. The plutonium would then be tracked
through the system using neutron counting and the PCR. Again, DA is required to verify that
This method would provide the means for MC&A to be accurately applied to pyroprocessing.
However, this is disruptive and would require modifications to the pyroprocess.
1.3.2.4 Digital Cloud Chamber and Inverse Spectroscopy Algorithm
INL has developed a method by which non-homogeneous samples can be
characterized [1]. It uses a digital cloud chamber (DCC) to record the pathways of gamma
rays and neutrons. Using the data from the DCC in conjunction with the inverse spectroscopy
algorithm, the energy and originating location of the incident radiation can be determined.
This tool could be used for quantifying plutonium in SNF or other containers in the
pyroprocess [15]. It should be noted that this detection method requires a long measurement
time making it better suited for evaluating feed and product inventory rather than
intermediary products in the pyroprocess.
1.3.2.5 Goals Driven Safeguards
One of the proposed alternatives to traditional safeguards is Goal Driven Safeguards
(GDS) as described by Wigeland et al. [7]. This approach takes advantage of the batch nature
of pyroprocessing. The material is moved between process units in containers. Each
container would be weighed and numbered marking the creation of an “item.” Each item
would be tracked through the system. The movement of the item would be recorded and
monitored. In pyroprocessing under normal operation, there is a unique set of motions
The location of the process in a shielded hot cell is also advantageous. The hot cell has
a limited number of portals. These portals could be monitored using NDA methods to ensure
that products leaving the cells are consistent with their declaration. Lack of accuracy in NDA
methods would be compensated by the item and motion tracking within the cell.
1.3.2.6 Signature-Based Safeguards
Signature-Based Safeguards [12] build upon the principles of Goals-Driven Safeguards
and adds a process model to identify measurable indicators (signatures) of diversion of SNM.
These include, but are not limited to temperature, density, voltages, current, etc. The process
model would simulate potential diversion scenarios to identify combinations of
measurements, movements and other conditions that are indicative of diversion. This model
would run in real-time in parallel to the actual process. It would use the sensor readings to
determine if diversion of SNM is occurring and sound an alarm if the conditions matched
that of a diversion scenario. In addition to Signature-Based safeguards, other methods of
incorporating a process model to support and compliment MC&A have been proposed [16].
In order to accomplish Signature-Based Safeguards “chemically and physically
correct representations of each unit operation should be built” [12]. Additionally, many of the
safeguards methods mentioned above require process monitoring. The ER is most important
and complex unit of operation because it partitions the SNF. It would be the ideal location for
potential proliferators to alter the flow of material. A better understanding of electrorefiner
can be accomplished through simulating its performance. A model of the ER would help in
both cases, the flow of plutonium is of specific interest. Thus, the conditions under which
plutonium could be removed from the salt and co-deposited with uranium is of particular
interest.
2
Theory
In order to accomplish the goals of Signature-Based Safeguards and other
pyroprocessing safeguard methods, a certain level of understanding of electrochemical theory
is required. An electrochemical cell, such as the electrorefiner, combines the physical
phenomena of reaction kinetics, thermodynamics and mass-transport. Most models of the
electrorefining process are based upon the electrochemical theory discussed in this section.
2.1
Electrochemical Cell
An electrochemical cell consists of four main components: a power supply, an anode, a
cathode and an electrolyte. The power supply drives the reaction. Material is oxidized at the
anode and reduced at the cathode. The electrolyte serves as conducting medium to allow the
flow of ions and electrons in the cell. A representation of Mark-IV electrochemical cell is
shown in Figure 2.1. In the case of the Mark-IV, SNF is oxidized from the anode and
uranium is reduced at cathode while other elements in SNF remain in the salt or the anode
baskets under normal operating conditions. EBR-II SNF is metallic resulting in a reaction of
oxidizing a metal species at the anode and the reduction of a metal ion at cathode. These
Anode: (2.1a)
Cathode: (2.1b)
In these equations, represents any species in SNF, is the number electrons exchanged and
represents an electron. At any time, multiple species can be reacting at either electrode.
Figure 2.1 Representation of the Mark–IV electrochemical cell
2.2
Potential
The potential of an electrode is composed of two parts: the equilibrium potential, ,
and overpotential, [17].
The equilibrium potential is given by the Nernst equation [18, p. 19]:
where represents the standard reduction potential of species , is the stoichiometric
coefficient (+1 for oxidation and -1 for reduction), is the universal gas constant, is the
temperature of the electrochemical cell, is Faraday’s constant, and represents the activity
of a species. The activity of the reduced metal, , is taken to be unity. The activity of the
oxidized species is related to the concentration, , by the activity coefficient, , and is
relative to a standard concentration, , as shown[18, p. 19].
The standard concentration is commonly taken to be 1 mol/L [19].
The overpotential can be split into two terms: surface ( ) and concentration ( )
overpotential [17].
The concentration overpotential is created by mass-transfer limitation near the electrode. This
limitation creates a thin layer next to each electrode, commonly referred to as the diffusion
boundary layer, in which a concentration difference exists between the bulk of the electrolyte
and the surface of the electrode. A certain amount of potential is consumed to drive species
(2.3)
(2.4)
through the diffusion layer and is calculated by the following equation [17]:
where represents the mole fraction of the ion of species at the electrode surface. The
surface overpotential is determined using the Butler-Volmer equation which is discussed
later.
The potential of each electrode determines which species are oxidized or reduced. For
example, in order for a species to reduce at the cathode, the species’ equilibrium potential
needs to be less negative than the cathode’s potential. Electrode potentials are measured in
reference to another electrode. The reference electrodes used in the Mark-IV electrorefiner
are silver/silver-chloride (Ag/AgCl) electrodes [20]. By observing the standard reduction
potentials of the most prevalent species in EBR-II SNF (see Table 1.1), it can be determined
at a standard concentration value which species will remain in the anode, be oxidized and
partitioned into the salt or reduced at the cathode. Values for the standard reduction
potentials at 500 °C are displayed in Table 2.1. The values are listed in descending order
from most noble to least noble. The shading color corresponds to color scheme in Figure 2.1.
The more active species will oxidize into the salt phase. Uranium is the least stable in the salt
phase and reduces onto the cathode.
Table 2.1 Standard Reduction Potential of Species in Table 1.1 vs. Ag/AgCl Reference Electrode at 500 °C [8]
Element E
o
(V) vs.
Ag/AgCl Phase Ruthenium 0.526*
Anode
Molybdenum 0.119*
Zirconium -1.088*
Uranium -1.248 Cathode
Plutonium -1.555
Salt (Electrolyte)
Cerium -2.026
Neodymium -2.358
Sodium -2.5*
Cesium1 ---
*
At 450 °C, 1 Position in table determined by free energy of
formation of its chloride in comparison to others [8, p. 72]
2.3
Current
The current determines the rate of reaction. The cell current is a measure of the total
net reaction rate of all species in the cell. A reliable expression for cell current is central to
determining flow of material between phases in the electrorefiner. Of particular interest is the
reaction occurring at the cathode for safeguard and product quality purposes.
To begin the development of an expression for cell current, the current and reaction
rate need to be linked. Faraday’s constant, , relates the current of a species, , to the
reaction rate of a species, [18, p. 10]:
where is the surface area of the electrode. Assuming the reactions in (2.1) to be single-step
the reaction rate is given by [18, p. 17]:
where and are respectively the concentrations of the reduced and oxidized species ,
and and are the forward and reverse rate constants for species . (2.8) refers to the
reduction reaction as the forward reaction and the oxidation reaction as the reverse. In
electrochemistry, the rate constants, , have an Arrhenius dependence on potential[18, pp.
20-21]:
where is the standard rate constant taken at a standard concentrations for the oxidized and
reduced species. This standard concentration is commonly taken to be 1 mol/L [19]. is the
transfer coefficient. is equilibrium condition at which is determined. If the
concentration of the oxidized species is at the standard value of 1 mol/L then by using (2.3)
and (2.4) then is given by the following equation.
where is the standard concentration at which is determined. By combining (2.7),
(2.8), (2.9) and (2.10), the basis for the Butler-Volmer (B-V) equation is formed.
(2.8)
(2.9)
(2.10)
(2.11)
The leading term in (2.12) is commonly represented as the standard exchange current, as
shown below.
Often the area term is divided out of (2.13) to remove the area dependence resulting in the
standard exchange current density, .
At this point, a slight diversion will be made to discuss the current under equilibrium
conditions. At equilibrium, the net current is zero and the bulk concentration is equivalent to
the surface concentration. Using (2.12), this results in the following equation.
The current at equilibrium is referred to as the exchange current. Thus, taking the B-V
equation at any arbitrary equilibrium condition, an expression for the exchange current can
be developed. The general expression for the exchange current is given below [18, p. 25].
However, the inclusion of a reduced species concentration term in exchange current assumes
a product in solution which is not case in the ER. Specifically for the Mark-IV ER, the
exchange current is derived by combining (2.3), (2.4), (2.11) and the left-hand side of (2.14)
and assuming a solid product with an activity of unity.
(2.13)
(2.14)
(2.15)
Returning to the derivation of an expression for the cell current, the B-V equation can
become more generalized by utilizing an expression developed from the combination of (2.3)
and (2.11)
(2.17) used with (2.2) and (2.12) results in the B-V equation being generalized to any
equilibrium condition as opposed to a standard condition.
Specifically applying (2.18) to the Mark-IV ER, it becomes (2.19).
The ratio of the surface and bulk concentrations of the reduced metal cancels out because the
activity of the metal is one. The generalized B-V equation provides a means whereby the
current for each species can be determined. If there is only one species depositing on the
cathode, then the B-V equation evaluated at the cathode will yield the cell current.
Thus far, the case of a single species has only been considered. In the case that there
is more than one reaction occurring at the cathode, the cell current is the sum of the current
of all the species actively reacting [21, p. 60].
Under galvanostatic operation, a secondary reaction begins to occur when the primary
reactant is unable to meet the requested cell current due to mass transfer limitations.
In an ER, the electrolyte is well mixed. However, there is thin layer next to the
electrode through which reacting species need to diffuse. The rate of diffusion can be
determined two ways. One possible method is to solve for molar flux, , using the transport
equation in the diffusion layer [22].
where is the diffusion coefficient. The other method is to use a mass-transfer
coefficient, , which encompasses all of the dynamics accounted for in the transport
equation which is accomplished using the following equation [8, p. 20].
The limiting current occurs at largest concentration difference. This occurs when the surface
concentration is zero. If the limiting current for the primary species is less than the requested
cell current, another species needs to deposit on the cathode to meet the requested value.
3
Models
Three models were available for investigation of signatures and methods to be used in
safeguarding pyroprocessing. The first model was developed by Robert Hoover at the
University of Idaho (UI) [8]. The second was Enhanced REFIN with Anodic Dissolution
(ERAD) which is an adaptation of the REFIN code developed by B. G. Park at Seoul
National University in Korea [22]. The last model was developed by Jun Li at the University
of North Carolina (UNC) [23]. This section provides an overview of each model and the
(2.21)
3.1
UI Model
This model was developed as part of a joint project with UI, INL, KAERI and Seoul
National University. The model provides operation voltages and currents along with
composition of the anode, salt and cathode. Also, the model allows for the user to specify the
applied current, initial composition of the anode, salt and cathode. This code used the B-V
equation to account for kinetics and the mass-transfer coefficient for mass transport in the
diffusion layer. The exchange current density was empirically fit to match data from the
Mark-IV electrorefiner and assumed to be constant with respect to concentration and the
same for each species. The model only accounts for the reaction and transport of uranium,
zirconium and plutonium in the Mark-IV and excludes the reduction of plutonium at the
cathode.
3.2
ERAD
ERAD introduces a number of additions and alterations to REFIN to account for
different physical phenomena and to improve the speed and convergence of the solutions.
The general approach of the model is similar to the Hoover model but accounts for more
physical processes and is more versatile. One difference is that before the diffusion layer on
the anode, there is a crud layer that builds up with time that the nuclides have to diffuse
through. Another difference is the mass-transfer treatment. ERAD solves the mass transport
equation for ionic solutions, discussed in detail elsewhere [22]. Also, ERAD accounts for
concentration dependence of exchange current density. However, neither ERAD nor the UI
of the species. ERAD can account for up to 10 radionuclides. In a comparison to
experimental data, ERAD demonstrated good agreement in electrode potential, but
over-predicted plutonium transport and under-over-predicted uranium transport. In addition, zirconium
dissolution did not agree well with the experimental data [24].
3.3
UNC Model
The previous two models are both considered one-dimensional. This model is
three-dimensional. The model uses ANSYS-CFX to generate a three-dimensional computational
fluid dynamics model. Using B-V equation to set the boundary conditions, the model solves
the transport equation to obtain species concentration distribution. The UNC model is able to
account for potential gradients along the electrodes; whereas, the UI model and ERAD
assume a uniform potential distribution along the electrodes. Also, the UNC model can
capture the current density distribution at the interface of the molten salt and cadmium pool.
Thus, it is best equipped to capture the effects of the cadmium pool.
3.4
Selection
The selection of a model was based on accuracy, availability and adaptability. The UI
model proved to be accurate for normal operation of the Mark-IV ER. However, because the
exchange current density was empirically determined and was considered constant, it can’t
be extended over large concentration ranges. This is required for the investigation of
deposition at the cathode. The UNC model is the most thorough of the models. However, for
an initial investigation of signatures, this model is overly advanced. The UNC model would
be useful in a more advanced investigation of signatures and may be used in future work, but
adds complexity which may not be necessary in this project. ERAD demonstrated to be
versatile because of its roots in fundamental electrochemistry, but is not overly complicated.
It too has been benchmarked against experimental data demonstrating accuracy particular in
regards to electrode potentials. Thus, ERAD was selected for an initial look at the dynamics
of an ER in off-normal operating condition for the purpose of identifying signatures.
4
Diversion
As discussed previously the goal of safeguards is the timely detection of diverted
SNM. In general, the diversion of SNM can be accomplished in two ways: abrupt and
protracted diversion [11, p. 21]. Abrupt diversion is the diversion of one SQ or more of SNM
from a process in less than one material balance period. Protracted diversion is the diversion
of one SQ or more of SNM over one or more material balance periods. Protracted diversion
can be easier to mask than abrupt diversion. For this purpose, this work investigates the case
of protracted diversion of SNM in the ER.
One possible method of protracted diversion in the ER is for small amounts of
plutonium to co-deposit with uranium at the cathode. Co-deposition of uranium and
plutonium can be accomplished by using a liquid cadmium cathode (LCC). This is explained
significantly lower than that of uranium [25]. However, the exchange of the standard solid
steel cathode for a LCC would require a movement outside of the standard operating paths.
A more difficult diversion scenario to detect would be one that uses the standard solid
cathode. An experiment performed at ANL demonstrated the feasibility of the co-deposition
of plutonium on a solid cathode when the ratio of plutonium-to-uranium (PUR) salt
concentrations is sufficiently high [26]. The PUR in the salt phase of the ER rises naturally
over time due to the nature and objective of electrorefining. At the anode, an impure product,
SNF, is being oxidized while a relatively pure product, uranium, is depositing at the cathode.
Thus the uranium being removed from the ER is more than the uranium being drawn from
the SNF because of the oxidation of actinides and active fission products. In the Mark-IV
ER, CdCl2, which oxidizes any metal uranium in contact with salt, was occasionally added to
maintain a desired concentration of uranium-chloride (UCl3) in the salt [8]. Thus, protracted
diversion could occur by suspending the addition of CdCl2 and allowing UCl3 concentration
to gradually decrease. This particular diversion scenario was selected for the examination of
potential signatures and the application of detection methods.
5
Plutonium-to-Uranium Ratio Study
To examine the behavior of certain measures in diversion scenario previously
discussed, the ER was simulated using ERAD at varying PUR values. The ER was simulated
in controlled current operation with a solid steel cathode. 12 cases were simulated each with
“base” case which represents the concentrations of uranium and plutonium under normal
Mark-IV operation. For a complete documentation of input parameters and settings, a copy
of the ERAD input file (inpref) for Case 1 is found in Appendix A. The only values that
changed from case to case in the input file were the concentrations of uranium and plutonium
in the salt.
Additionally, the PUR study was performed at two different settings to compare the
performance of a fixed and variable exchange current density (EXCD). The first setting is a
concentration independent (fixed) EXCD. For the second setting, the EXCD was allowed to
vary as the concentrations of uranium and plutonium were altered in the PUR study. In the
second case, the standard EXCD for uranium, plutonium and zirconium was assumed to be
0.8, 1.1 and 0.8 A/cm2 respectively.
5.1
Results
5.1.1 Constant EXCD
The following results were obtained while fixing the EXCD at 0.5 A/m2 for uranium,
plutonium and zirconium. The EXCD was not allowed vary with concentration during the
simulation. The amount of plutonium depositing on the cathode was tracked during each
case. In Table 5.1, the total amount of plutonium that deposited on the cathode in each case is
shown. In cases 3, 5, 6 the amount of plutonium deposited is actually higher than the
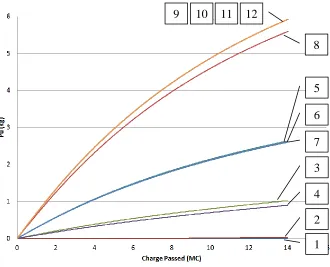
following case which has a higher PUR. A plot of the cumulative amount of plutonium
in Figure 5.1. The measure of time used is the charge passed in megacoulombs (MC). The
case number is indicated by the boxed number with a line pointing to curve to which it
corresponds. Some cases are so close in their values that they overlap. In this case, it may
appear that multiple case numbers are pointing to the same line, however; that is not the case,
there are multiple lines on top of the other.
Table 5.1 Test matrix and plutonium deposited using a fixed EXCD of 0.5 A/m2
Case Number 1 2 3 4 5 6
Pu-to-U ratio 0.031 0.091 0.254 1.149 2.621 4.511
U in Salt (wt%) 7.567 2.567 2.234 2.234 1.234 1.234
Pu in Salt (wt%) 0.234 0.234 0.567 2.567 3.234 5.567
Pu deposited (g) 0.00 31.4 1014.98 893.35 2631.46 2604.41
Case Number 7 8 9 10 11 12
Pu-to-U ratio 6.132 13.527 19.878 26.136 33.962 41.170
U in Salt (wt%) 1.234 0.313 0.213 0.213 0.213 0.200
Pu in Salt (wt%) 7.567 4.234 4.234 5.567 7.234 8.234
Figure 5.1 Plutonium deposited on cathode at each PUR value for a fixed EXCD
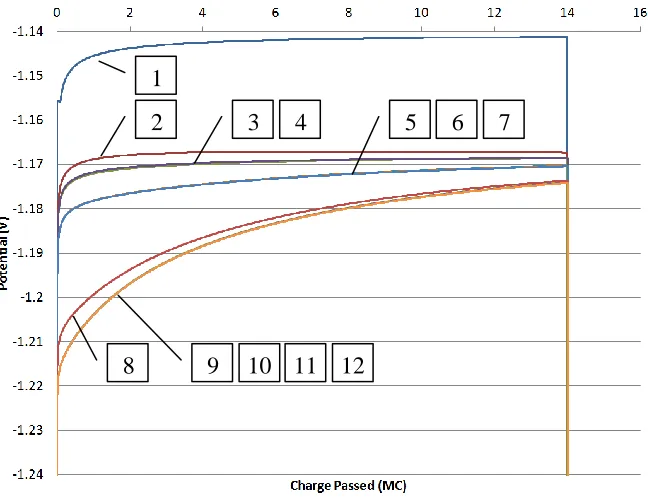
Also, included are plots of the cathode and anode potentials (see Figure 5.2 and
Figure 5.3) for each PUR case. Again, numbered boxes point to the curve that corresponds to
the case number. The general trend is a decreasing potential for increasing PUR values.
However, this is not the case for cases 3, 5, 6 and 9, 10 which have lower potentials than the
subsequent cases. The change in the anode potentials are on a smaller scale than the cathode
potentials and the differences are most pronounce near the beginning of the simulation. The
anode potential decrease with increasing PUR values without exception. 1 2 4 3 7 6 5 8
Figure 5.2 Cathode potentials at each PUR value for a fixed EXCD
1 2
5
4 7 6 3
8
9
10 12
11
1
2 3 4 5 6 7
5.1.2 Variable EXCD
The 12 cases were simulated again allowing for variation in the EXCD due to
concentration changes. The same results that were presented for the fixed EXCD setting are
presented here for the variable EXCD. In Table 5.2, the total plutonium deposited in each
case is reported for the setting of a variable EXCD in ERAD. Unfortunately, cases 2 and 12
were unable to converge using a variable EXCD. A comparable solution was obtained for
case 2 by using a slightly perturb value of 0.235 wt% for plutonium.
Table 5.2 Amount of plutonium deposited for each case using a variable EXCD
Case Number 1 2 3 4 5 6
Pu deposited (g) 0.00 6.77∙10-6 1044.66 995.25 2711.21 2716.26
Case Number 7 8 9 10 11 12
Pu deposited (g) 2726.61 5649.73 5969.75 5988.40 6005.08 ---
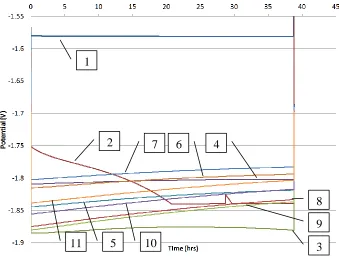
Similar to the fixed EXCD setting, the plutonium deposited and cathode potentials are
displayed in Figure 5.4 and Figure 5.5 respectively. However, due to differences in the
ERAD versions, the simulation progression was measured by time instead of the amount of
coulombs passed. Despite the difference in units, the x-axes in both settings are on the same
scale. Under the variable EXCD setting, the general trends of increasing plutonium
deposition and decreasing cathode potential with increasing PUR holds. The only exceptions
Figure 5.4 Plutonium deposited on cathode at each PUR values for a variable EXCD
1
2
5
4 6
7
3 8
9
10 11
2 1 3
4
5 6 7
5.2
Discussion
In Table 5.1 and Table 5.2, the largest gains in the amount of plutonium deposited on
the cathode are after cases 2, 4 and 7. In Table 5.1, it is shown that after cases 2, 4 and 7 the
initial amount of uranium in the salt decreases. This indicates that the amount of uranium in
the salt is a determining parameter for plutonium deposition. This is due to the principle of
limiting current.
Uranium is thermodynamically favored for metal deposition over plutonium. Thus the
only means whereby plutonium can deposit while uranium is present is if the concentration
of uranium is low enough that its limiting current is below the requested current. In this case,
the next most favorable reaction occurs. That reaction, in these studies, is plutonium
reduction. The cathode potential is forced to decrease to allow the deposition of plutonium to
meet the requested current for the ER cell.
This is not to say that the concentration of plutonium is irrelevant. Indeed, if the
concentration of plutonium was small relative to some other species’ (i.e. neptunium,
zirconium) than that species could be favored to deposit over plutonium. Inspecting (2.3),
shows that as the activity of a species increases, the equilibrium potential increases which
means a less negative potential is required to allow deposition.
It was noted that in Table 5.1 and Table 5.2 that increasing the initial plutonium
concentration, in some cases, actually reduced the total plutonium deposited on the cathode.
simulation, ERAD performs an equilibrium calculation for each of the species between the
salt and the cadmium pool. At equilibrium, the potential difference between the salt and the
pool for each species is equivalent. The increase in the initial plutonium concentration in the
salt causes the concentration difference of plutonium between the pool and the salt to
increase which increases the potential difference for plutonium. Because the potential
differences of plutonium and uranium have to match, uranium’s concentration difference
needs to increase as well. The concentration difference of uranium can increase by
transporting less uranium into the cadmium pool. Thus, even though Table 5.1 shows that the
initial amount of uranium in the salt is the same for some cases. However, that is not the case
after the equilibrium calculation between the salt and the pool. In fact, the amount of uranium
in the salt is slightly higher in cases 4, 6 and 7 after the equilibrium calculation resulting in
less plutonium being deposited. These cases illustrate the need to understand the flow of
material between the salt and cadmium phases in order to accurately simulate the ER.
5.2.1 Composition effects on signatures
By comparing Figure 5.2 and Figure 5.3, the cathode potential appears to be more
sensitive to the change in uranium and plutonium salt compositions. Additionally, the anode
potentials of the variable EXCD cases were lower than the anode potentials for a fixed
EXCD and vice versa for cathode potentials.
Further analysis was done to examine the strength of the dependence of the anode and
EXCD of 0.5 A/m2 and a variable EXCD. These values were plotted against the composition
of uranium and plutonium in the salt (see Figure 5.6 and Figure 5.7). A linear fit was applied
to the data. The values for the coefficients of the linear fit and the coefficient of
determination (R2) are displayed in Table 5.3.
Figure 5.6 Average electrode potentials versus uranium composition in the ER salt
Figure 5.7 Averaged electrode potentials versus plutonium composition in the ER salt
-2.2 -2 -1.8 -1.6 -1.4 -1.2 -1
0 2 4 6 8
A ve rag e Po te n tial ( V)
U in salt (wt %)
Anode - Fixed
Cathode - Fixed
Anode - Variable Cathode - Variable -2.2 -2 -1.8 -1.6 -1.4 -1.2 -1
0 2 4 6 8 10
A ve rag e Po te n tial ( V)
Pu in salt (wt %)
Anode - Fixed
Cathode - Fixed
Anode - Variable
Table 5.3 Fitting parameters for the linear equation Y= A∙X+ B for Figure 5.6 and Figure 5.7
EXCD Salt wt% (X) Potential (Y) Slope (A) Y-intercept (B) R2
Fixed
U Anode 0.006 -1.202 0.937
Cathode 0.036 -2.021 0.899
Pu Anode -0.003 -1.179 0.475
Cathode -0.017 -1.892 0.383
Variable
U Anode -0.003 -1.299 0.933
Cathode 0.033 -1.859 0.795
Pu Anode 0.002 -1.311 0.471
Cathode -0.009 -1.768 0.092
From the values in Table 5.3, it is confirmed that the cathode has a greater sensitivity
to the salt composition. Comparing the slope values of the cathode to that of anode, the
cathode has an order of magnitude greater dependence on the composition in both the
uranium and plutonium case except under the variable EXCD setting. The correlations, in
general, are weaker when utilizing a variable EXCD. Thus using a fixed EXCD in an ER
model could over-predict an expected change in the potential leading to false negative when
attempting to detect SNM diversion.
It is interesting to note that the R2 values are greater in the case of uranium
composition. This would indicate that not only is plutonium deposition more tightly
correlated with the uranium composition in the salt, but the electrode potentials are as well.
In regards to signatures, both the cell current and the cathode potential could be
indicative of the diversion of plutonium via deposition of the cathode. Plutonium could be
deposited on the cathode if the limiting current of uranium and other less active metals is
The other signature – potential – has been shown to be dependent on the uranium
inventory in the salt which is a controlling factor of plutonium deposition. By transitive logic,
potential should be dependent of plutonium deposition. This is confirmed for a fixed EXCD
in Figure 5.8 which contains a semi-log plot of the averaged cathode potentials against the
amount of plutonium deposited on the cathode. However, this relation is not found for a
variable EXCD. This could be the result of the increase in plutonium’s EXCD with
increasing plutonium deposition. As the EXCD of plutonium increases less overpotential is
need to obtain the same partial current value. This offsets the decrease in potential due to a
greater plutonium partial current. However, in both cases the potential drops when plutonium
deposition occurs. Thus, a depressed cathode potential and elevate cell current would be a
good signature of plutonium diversion, but a decreasing potential does not necessarily
meaning an increasing plutonium partial current at the cathode.
5.2.2 Comparison of constant and variable EXCD
Using a fixed or variable EXCD, can also affect the accuracy and identification of
signatures. This is illustrated for one of the results of interest, plutonium deposition, in Table
5.4. The table displays the plutonium deposited for both EXCD settings and the difference
between the two. In a separate table (see ), the initial value of the variable EXCD for each
case is provided. The initial values are shown for both uranium and plutonium because they
are no longer fixed or equal.
Table 5.4 Comparison of plutonium deposition for variable and fixed EXCD of 0.5 A/m2
Case number 1 2 3 4 5 6
Fixed EXCD 0 31.4 1014.98 893.35 2631.46 2604.41
Variable EXCD 0 6.77∙10-6 1044.66 995.26 2711.21 2716.26
Difference (g) 0 31.4 -29.68 -101.9 -79.75 -111.85
Case number 7 8 9 10 11 12
Fixed EXCD 2597.85 5591.84 5915.57 5915.71 5916.83 5916.83
Variable EXCD 2726.61 5649.73 5969.75 5988.4 6005.08 ---
Difference (g) -128.76 -57.89 -54.18 -79.69 -88.25 ---
Table 5.5 Variable EXCD values
Case number 1 2 3 4 5 6 7 8 9 10 11
Variable
EXCD (A/m2)
U 18.1 8.9 7.8 7.9 6.4 6.4 6.4 2.9 2.3 2.3 2.3
Pu 4.5 4.5 7.6 18.7 19.6 28.3 34.5 23.6 23.6 28.3 33.6
As seen in Table 5.4, there is a difference in plutonium deposition between the two
the variable EXCD to be from 2.3 to 18.1 for uranium and 4.5 to 34.5 for plutonium, the
cases were simulated with a fixed EXCD of 5 A/m2 and the differences were recalculated
based on the variable EXCD results in Table 5.4. The results for a fixed EXCD of 5 A/m2 are
displayed in Table 5.6.
Table 5.6 Comparison of plutonium deposition for a variable and fixed EXCD of 5 A/m2
Case number 1 2 3 4 5 6
Fixed EXCD 0 23.61 1010.33 888.59 2627.70 2600.65
Difference (g) 0 23.61 -34.33 -106.67 -83.51 -115.61
Case number 7 8 9 10 11 12
Fixed EXCD 2594.08 5589.78 5913.70 5913.85 5914.97 5914.97
Difference (g) -132.53 -59.95 -56.05 -74.55 -90.11 ---
The difference is only decreased for case 2 which had both the variable EXCD of
uranium and plutonium close in value to that of the fixed EXCD. However, as variable
EXCD of plutonium increases the plutonium deposition values continue to diverge despite
the decrease in the EXCD of uranium. This confirms that there is a difference due to the
different treatments of the EXCD.
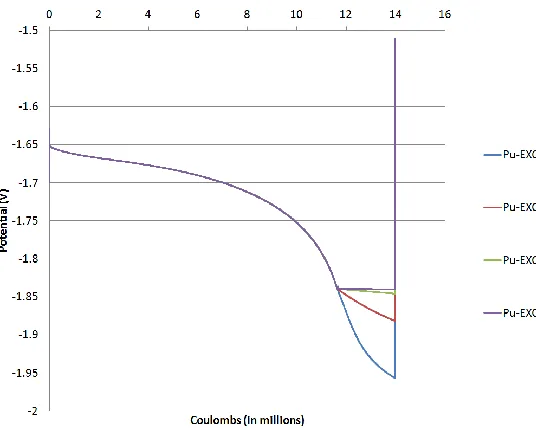
Another result affected by EXCD is the cathode potential. In Figure 5.2 and Figure
5.5, it is shown that the cathode potential profiles of fixed and variable EXCD have similar
trends, but are at different potential values. The size of the shift in potential between fixed
and variable EXCD is quantified in Table 5.7 by comparing averages of the potential
EXCD of 5 A/m2 are consistently 0.08 V greater than the potentials for a fixed EXCD of 0.5
A/m2.
Table 5.7 Comparison of the average cathode potential for a variable and fixed EXCD of 0.5 A/m2
Case number 1 2 3 4 5 6
Fixed EXCD -1.751 -1.867 -1.990 -1.951 -1.992 -1.976
Variable EXCD -1.576 -1.798 -1.865 -1.794 -1.818 -1.793
Difference (V) -0.176 -0.070 -0.125 -0.158 -0.174 -0.182
Case number 7 8 9 10 11 12
Fixed EXCD -1.972 -2.016 -2.019 -2.013 -2.003 -2.003
Variable EXCD -1.782 -1.842 -1.848 -1.828 -1.814 ---
Difference (V) -0.189 -0.174 -0.171 -0.184 -0.190 ---
As demonstrated, the treatment of the EXCD can have an effect on the modeling and
the prediction of potential especially for a diversion scenario in which the composition of the
ER salt varies greatly. Because the fixed EXCD is generally lower than the variable EXCD in
the PUR study, the potential predicted using a fixed EXCD is generally more negative and
underestimates the amount of plutonium deposited when compared to the variable EXCD
setting. This could lead to a false negative when monitoring the cathode potential for a signal
of SNM diversion because the predicted potential needed for plutonium deposition would be
more negative than the actual potential. In short, using a fixed EXCD limits the range within
which accurate signatures can be predicted.
In summary, it has been established that current and potential are useful signatures of
variable EXCD is needed when modeling the ER over a large range of salt compositions
which can occur in SNM diversion. The effect of the EXCD on potential diversion signatures
is further examined in the next chapter.
6
Exchange Current Density Sensitivity Study
If the signature-based safeguards approach is to be employed, the model used for the
ER needs to be able to accurately predict the values of the signatures for a range of ER
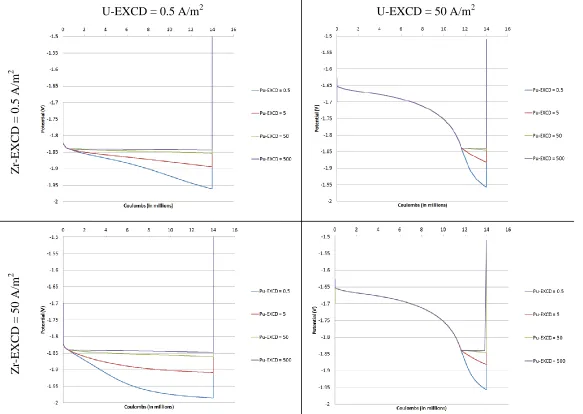
conditions. In the previous section, cell current and cathode potentials have been identified as
useful signatures for identification of plutonium diversion by deposition on a solid cathode.
The EXCD is a highly uncertain value that affects both the cell current and cathode potential
value predicted by ERAD and the other models. The effect of EXCD on these signatures is
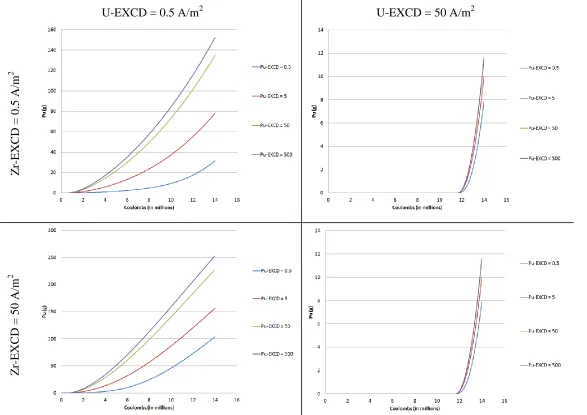
explored in this study.
Only Case 2 was examined (PUR of 0.091). Case 2 was selected because it captures
the transition from uranium deposition to co-deposition. The EXCD of three species
(uranium, plutonium and zirconium) varied between four values: 0.5, 5, 50 and 500 A/m2.
The three species selected were uranium, plutonium and zirconium because they contribute
the most to the cell current and cathode potential. The minimum EXCD of 0.5 A/m2 was
chosen because it was the lowest value found in literature for uranium [8]. The maximum
EXCD of 500 A/m2 was chosen because it was on same magnitude as the EXCD determined
for uranium in [27] and calculated from [28] (see Appendix B). Every combination of the
![Figure 1.2 Mark-IV Electrorefiner[9]](https://thumb-us.123doks.com/thumbv2/123dok_us/1335806.1166555/19.612.178.460.164.382/figure-mark-iv-electrorefiner.webp)